
The unfortunate fact of the matter is that some places in the Golden State have a larger percent of their population that never graduated from high school.
While the emphasis on going to college might be overblown, the fact is that not graduating from high school puts you at a significant disadvantage on average. Educational attainment might not be the best way to measure one person’s intelligence, but it does shine a light on the state.
We will use Saturday Night Science to determine what places in California have the highest percentage of adults without a high school degree.
A recent study we published found that California is the 45th smartest state in the United States, with an average IQ of 97.
But that doesn’t mean that a few cities in California are a bit slower than others due to a lack of basic education.
Table Of Contents: Top Ten | Methodology | Summary | Table
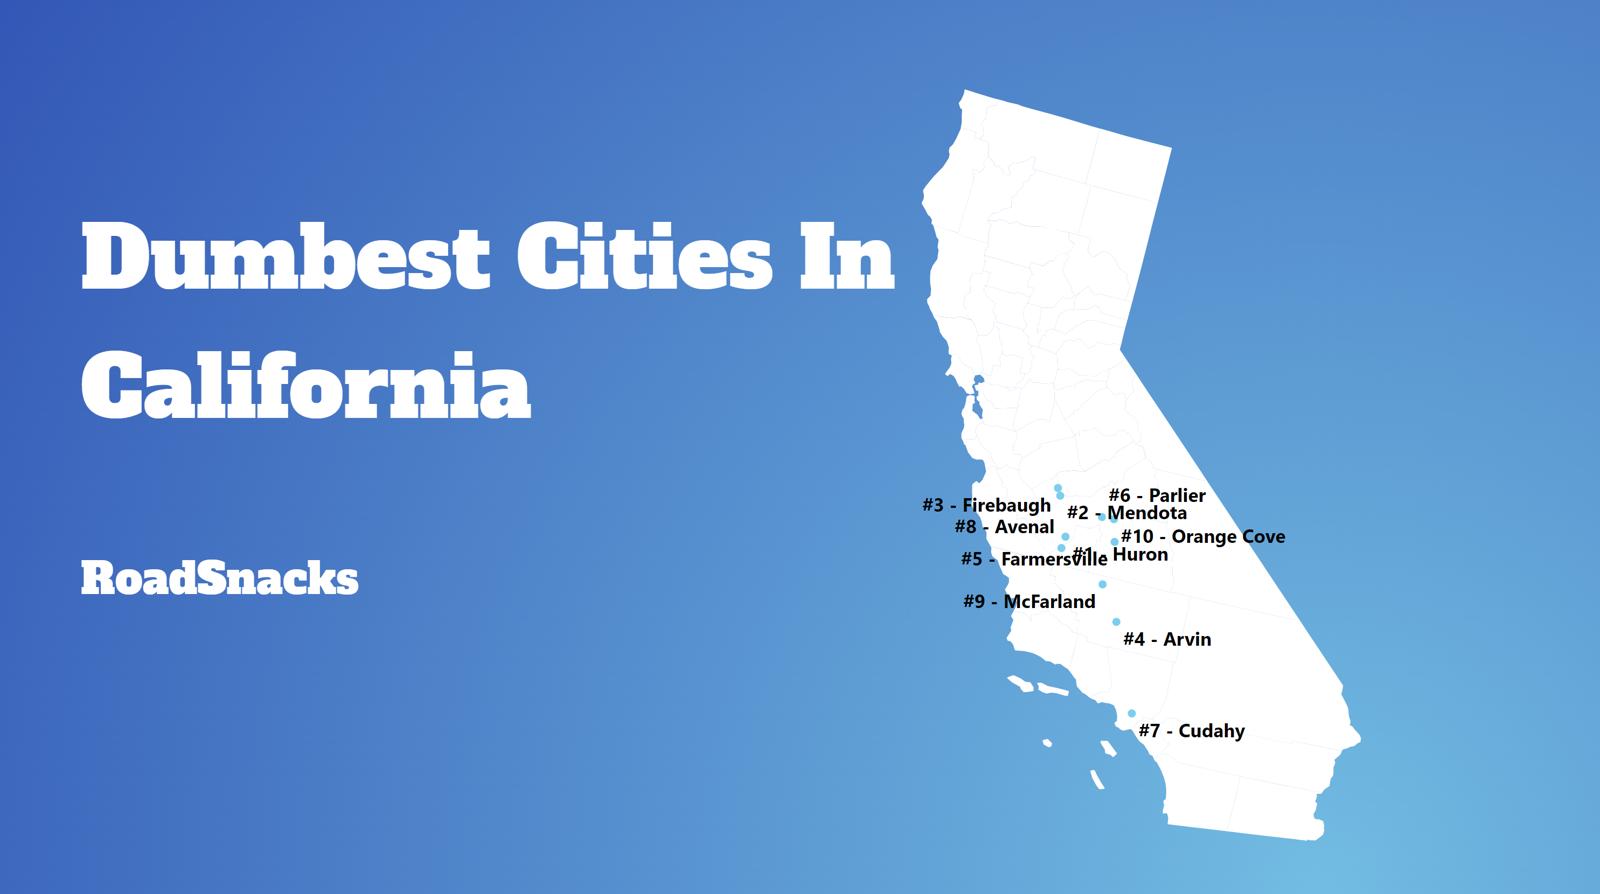
The 10 Dumbest Places In California
Don’t freak out.
Some places are just smarter than others, but that says nothing about the character of the people living there. It’s another data point a real estate agent would never tell you.
For this ranking, we only looked at cities with populations greater than 5,000, leaving us 411 cities in California to rank. You can take a look at the data below.
For more California reading, check out:
The 10 Dumbest Places In California For 2026

/10
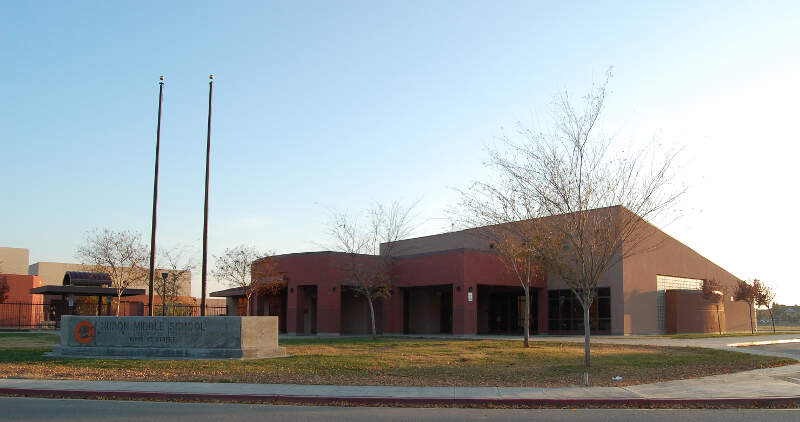
% Adult High School Dropout: 56.0%
% Highly Educated: 3.0%
More on Huron: Data | Crime | Cost Of Living | Movers

/10
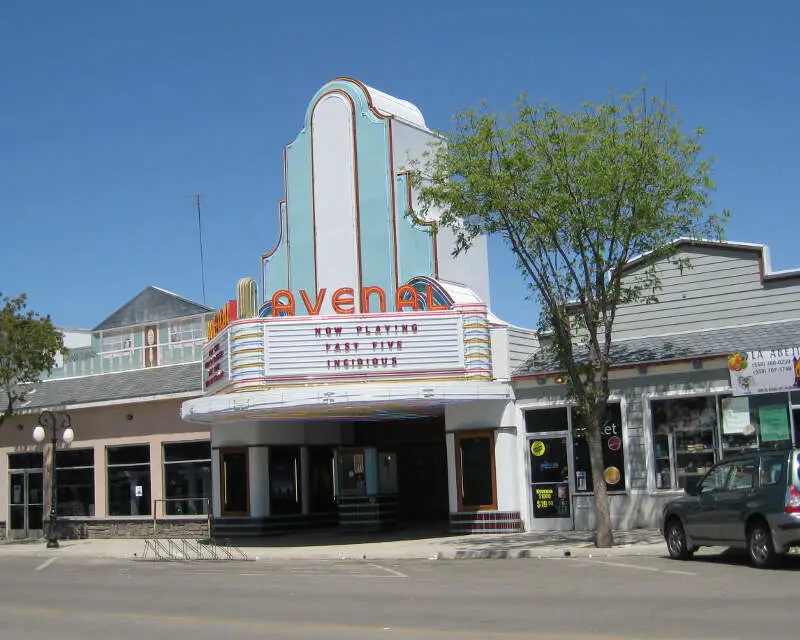
% Adult High School Dropout: 50.0%
% Highly Educated: 2.0%
More on Avenal: Data | Crime | Cost Of Living | Movers


/10
% Adult High School Dropout: 53.0%
% Highly Educated: 4.0%
More on Firebaugh: Data | Crime | Cost Of Living | Movers

/10
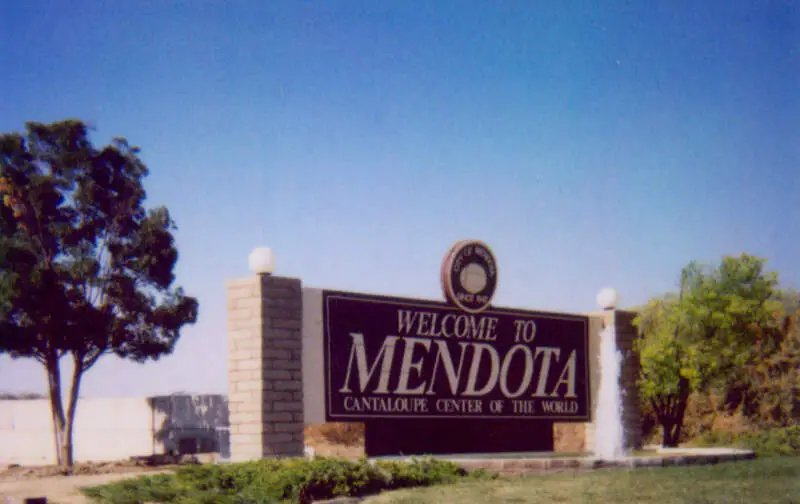
% Adult High School Dropout: 59.0%
% Highly Educated: 5.0%
More on Mendota: Data | Crime | Cost Of Living | Movers

/10
% Adult High School Dropout: 52.0%
% Highly Educated: 5.0%
More on Arvin: Data | Crime | Cost Of Living | Movers

/10
% Adult High School Dropout: 48.0%
% Highly Educated: 7.0%
More on Bell Gardens: Data | Crime | Cost Of Living | Movers

/10
% Adult High School Dropout: 43.0%
% Highly Educated: 6.0%
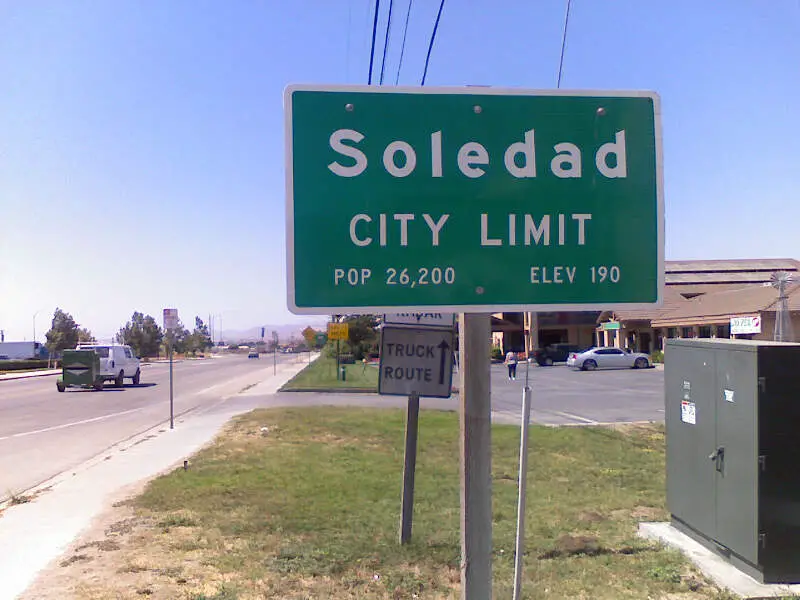
More on Soledad: Data | Crime | Cost Of Living | Movers

/10
% Adult High School Dropout: 44.0%
% Highly Educated: 6.0%
More on Farmersville: Data | Crime | Cost Of Living | Movers


/10
% Adult High School Dropout: 41.0%
% Highly Educated: 4.0%
More on Calipatria: Data | Cost Of Living | Movers

/10
% Adult High School Dropout: 49.0%
% Highly Educated: 8.0%
More on Maywood: Data | Crime | Cost Of Living | Movers
Methodology: How we determined the dumbest cities in the Golden State
We realize that formal education is only part of it when it comes to being intelligent, but on the other hand, knowing the difference between they’re, their, and there is always going to make you look pretty stupid.
So, we used Saturday Night Science to narrow down our criteria to focus on a city’s educational opportunities and what percentage of the population takes advantage of those opportunities.
In short, we came up with these criteria to determine the dumbest cities in California:
- % of the city’s population with less than a high school education (Age 25+)
- % of city’s population with a college degree (Age 25+)
We got the data from the U.S. Census 2020-2024 American Community Survey.
Then, our algorithm generates a rank for each place in these categories. After crunching all the numbers, a ranking of the cities in California from dumbest to brightest.
For this ranking, we used every California city with at least 5,000 residents. We updated this article for 2026, and it’s our eleventh time ranking the dumbest cities in California.
There You Have It – Now That You’re Asleep
If you’re measuring the locations in California where there are a high number of dropouts and adults who never received a formal education, this is an accurate ranking.
The dumbest cities in California are Huron, Avenal, Firebaugh, Mendota, Arvin, Bell Gardens, Soledad, Farmersville, Calipatria, and Maywood.
If you’re also curious enough, here are the smartest places in California, according to science:
- Piedmont
- Hillsborough
- Los Altos Hills
For more California reading, check out:
- Best Places To Live In California
- Cheapest Places To Live In California
- Most Dangerous Cities In California
- Richest Cities In California
- Safest Places In California
- Worst Places To Live In California
- Most Expensive Places To Live In California
Dumbest Cities In California For 2026
| Rank | City | Population | % Adult High School Dropout | % Highly Educated |
|---|---|---|---|---|
| 1 | Huron, CA | 6,519 | 56.0% | 3.0% |
| 2 | Avenal, CA | 13,608 | 50.0% | 2.0% |
| 3 | Firebaugh, CA | 8,392 | 53.0% | 4.0% |
| 4 | Mendota, CA | 12,577 | 59.0% | 5.0% |
| 5 | Arvin, CA | 19,539 | 52.0% | 5.0% |
| 6 | Bell Gardens, CA | 38,229 | 48.0% | 7.0% |
| 7 | Soledad, CA | 26,365 | 43.0% | 6.0% |
| 8 | Farmersville, CA | 10,397 | 44.0% | 6.0% |
| 9 | Calipatria, CA | 6,548 | 41.0% | 4.0% |
| 10 | Maywood, CA | 24,317 | 49.0% | 8.0% |
| 11 | Cudahy, CA | 22,087 | 43.0% | 6.0% |
| 12 | Coachella, CA | 43,307 | 45.0% | 7.0% |
| 13 | Parlier, CA | 14,507 | 43.0% | 6.0% |
| 14 | Huntington Park, CA | 53,108 | 47.0% | 8.0% |
| 15 | Mcfarland, CA | 14,222 | 41.0% | 6.0% |
| 16 | Corcoran, CA | 22,491 | 37.0% | 3.0% |
| 17 | Guadalupe, CA | 8,566 | 47.0% | 9.0% |
| 18 | Lindsay, CA | 12,643 | 37.0% | 5.0% |
| 19 | Orange Cove, CA | 9,695 | 52.0% | 11.0% |
| 20 | South El Monte, CA | 19,287 | 45.0% | 10.0% |
| 21 | Wasco, CA | 26,558 | 37.0% | 6.0% |
| 22 | Bell, CA | 32,476 | 43.0% | 9.0% |
| 23 | Delano, CA | 51,679 | 39.0% | 8.0% |
| 24 | Woodlake, CA | 7,702 | 43.0% | 10.0% |
| 25 | Gonzales, CA | 8,492 | 40.0% | 9.0% |
| 26 | Livingston, CA | 14,606 | 45.0% | 11.0% |
| 27 | Lynwood, CA | 64,578 | 40.0% | 9.0% |
| 28 | South Gate, CA | 91,483 | 41.0% | 11.0% |
| 29 | Commerce, CA | 11,993 | 38.0% | 10.0% |
| 30 | Blythe, CA | 17,396 | 32.0% | 8.0% |
| 31 | Madera, CA | 67,831 | 38.0% | 11.0% |
| 32 | Compton, CA | 92,698 | 35.0% | 10.0% |
| 33 | Watsonville, CA | 51,712 | 36.0% | 11.0% |
| 34 | Adelanto, CA | 37,964 | 27.0% | 7.0% |
| 35 | Waterford, CA | 9,204 | 29.0% | 9.0% |
| 36 | Selma, CA | 24,659 | 30.0% | 10.0% |
| 37 | Dos Palos, CA | 5,765 | 29.0% | 10.0% |
| 38 | La Puente, CA | 37,142 | 36.0% | 13.0% |
| 39 | Susanville, CA | 14,177 | 29.0% | 11.0% |
| 40 | Coalinga, CA | 17,203 | 30.0% | 12.0% |
| 41 | San Fernando, CA | 23,632 | 37.0% | 14.0% |
| 42 | Williams, CA | 5,585 | 35.0% | 14.0% |
| 43 | Santa Maria, CA | 110,462 | 38.0% | 15.0% |
| 44 | Baldwin Park, CA | 70,138 | 32.0% | 14.0% |
| 45 | Gustine, CA | 6,133 | 24.0% | 8.0% |
| 46 | Shafter, CA | 21,193 | 27.0% | 12.0% |
| 47 | El Monte, CA | 106,109 | 36.0% | 15.0% |
| 48 | Santa Paula, CA | 31,376 | 32.0% | 14.0% |
| 49 | Orland, CA | 8,357 | 27.0% | 12.0% |
| 50 | Perris, CA | 80,511 | 27.0% | 12.0% |
| 51 | Salinas, CA | 161,761 | 38.0% | 16.0% |
| 52 | Los Banos, CA | 47,593 | 28.0% | 13.0% |
| 53 | Paramount, CA | 52,050 | 32.0% | 15.0% |
| 54 | Ceres, CA | 49,342 | 27.0% | 13.0% |
| 55 | Rialto, CA | 104,143 | 25.0% | 12.0% |
| 56 | Hesperia, CA | 100,775 | 24.0% | 11.0% |
| 57 | Lompoc, CA | 43,646 | 26.0% | 13.0% |
| 58 | El Centro, CA | 44,240 | 27.0% | 14.0% |
| 59 | Porterville, CA | 63,157 | 30.0% | 15.0% |
| 60 | Atwater, CA | 32,162 | 26.0% | 13.0% |
| 61 | Reedley, CA | 25,609 | 32.0% | 16.0% |
| 62 | Brawley, CA | 27,283 | 28.0% | 15.0% |
| 63 | Tulare, CA | 70,945 | 24.0% | 12.0% |
| 64 | Chowchilla, CA | 19,020 | 28.0% | 15.0% |
| 65 | Newman, CA | 12,316 | 23.0% | 11.0% |
| 66 | Kerman, CA | 16,815 | 34.0% | 17.0% |
| 67 | Sanger, CA | 26,699 | 25.0% | 13.0% |
| 68 | San Bernardino, CA | 222,724 | 25.0% | 13.0% |
| 69 | Holtville, CA | 5,617 | 29.0% | 16.0% |
| 70 | Hawaiian Gardens, CA | 13,691 | 32.0% | 17.0% |
| 71 | Calexico, CA | 38,585 | 36.0% | 19.0% |
| 72 | Santa Ana, CA | 312,534 | 33.0% | 18.0% |
| 73 | Dinuba, CA | 25,475 | 26.0% | 15.0% |
| 74 | Patterson, CA | 24,693 | 25.0% | 14.0% |
| 75 | Jurupa Valley, CA | 107,011 | 26.0% | 15.0% |
| 76 | Clearlake, CA | 16,659 | 19.0% | 8.0% |
| 77 | Oxnard, CA | 200,928 | 31.0% | 19.0% |
| 78 | Taft, CA | 7,125 | 18.0% | 9.0% |
| 79 | Gridley, CA | 7,330 | 21.0% | 13.0% |
| 80 | Pico Rivera, CA | 60,272 | 27.0% | 17.0% |
| 81 | San Pablo, CA | 31,720 | 25.0% | 16.0% |
| 82 | Colton, CA | 53,772 | 25.0% | 16.0% |
| 83 | Victorville, CA | 137,627 | 20.0% | 13.0% |
| 84 | Rosemead, CA | 50,013 | 33.0% | 22.0% |
| 85 | Corning, CA | 8,155 | 22.0% | 15.0% |
| 86 | Stanton, CA | 39,402 | 29.0% | 21.0% |
| 87 | San Jacinto, CA | 55,180 | 21.0% | 14.0% |
| 88 | Colusa, CA | 6,505 | 23.0% | 16.0% |
| 89 | Willows, CA | 6,190 | 23.0% | 16.0% |
| 90 | Lawndale, CA | 30,781 | 27.0% | 21.0% |
| 91 | Indio, CA | 91,950 | 26.0% | 20.0% |
| 92 | Montclair, CA | 37,810 | 25.0% | 19.0% |
| 93 | Palmdale, CA | 164,634 | 23.0% | 17.0% |
| 94 | Tehachapi, CA | 11,946 | 21.0% | 16.0% |
| 95 | Fillmore, CA | 16,816 | 20.0% | 16.0% |
| 96 | Oroville, CA | 19,752 | 17.0% | 13.0% |
| 97 | Pomona, CA | 147,943 | 25.0% | 21.0% |
| 98 | Merced, CA | 91,953 | 23.0% | 20.0% |
| 99 | Montebello, CA | 61,045 | 26.0% | 23.0% |
| 100 | Stockton, CA | 322,326 | 22.0% | 20.0% |
Is the grammatical errors in this article did on purpose?
(In case you’re wondering the question I typed was done on purpose, in the style of the author of this article.)
If the author would stop being snarky long enough to take a look around the cities in the Central Valley, he would see the underprivileged. Migrant farmers trying to make a better life for their children. It’s not their shame that the cities are under-educated; it’s ours.
I agree with you and was the same thing I was thinking.
*I meant to type “and it’s the same thing I was thinking.”
Great comment. Being uneducated isn’t the same as dumb. i question the real motives of those who made this study.
Drop out rates grabbed my attention to this article through Walnut Creek (CA) Patch.
I find it rather churlish to speak about towns and people this way. To stick to the facts: drop out rate, graduation rate, etc would be more helpful ( motivation-wise.) But to call people stupid is down right mean. You don’t know them… people are smart in different ways. So they don’t know the square root of x, how many times have you used THAT since graduation? They may be even better people to others than the “brilliant” CEOs of the world. I’d rather hang out with good people than some of the candidates we have running for President (2016). Diplomas are not a prerequisite for honesty and goodness.
I don’t see any high school graduates lining up to pick our lettuce… and when they do… be ready to pay triple the price.)
Your study is as stupid as you are. I worked in LA, Orange, San Bernadino, Kern, Ventura and Santa Barbara counties and by far the cities in LA are head and shoulders above any others you listed. You could put a 20 mile radius, with the center being Huntington Park and you would find they all top the list. I moved from LA county to get away from these idiots once I retired.
Stats outweight personal experiences. You might be as stupid as the folks in those cities in the list if you think otherwise
First of all, just because you don’t have a high school diploma does not make you dumb. That should’ve been worded differently.
Second, before mentioning where certain cities are at you should double check like that YOU don’t make yourself look dumb especially since you must have at least a high school diploma. Bell is not in South Central Los Angeles. South East would be more accurate.