The unfortunate fact of the matter is that some places in the Buckeye State have a larger percent of their population that never graduated from high school.
While the emphasis on going to college might be overblown, the fact is that not graduating from high school puts you at a significant disadvantage on average. Educational attainment might not be the best way to measure one person’s intelligence, but it does shine a light on the state.
We will use Saturday Night Science to determine what places in Ohio have the highest percentage of adults without a high school degree.
A recent study we published found that Ohio is the 24th smartest state in the United States, with an average IQ of 100.
But that doesn’t mean that a few cities in Ohio are a bit slower than others due to a lack of basic education.
Table Of Contents: Top Ten | Methodology | Summary | Table
The 10 Dumbest Places In Ohio
Don’t freak out.
Some places are just smarter than others, but that says nothing about the character of the people living there. It’s another data point a real estate agent would never tell you.
For this ranking, we only looked at cities with populations greater than 5,000, leaving us 250 cities in Ohio to rank. You can take a look at the data below.
For more Ohio reading, check out:
The 10 Dumbest Places In Ohio For 2024

/10
% Adult High School Dropout: 17.0%
% Highly Educated: 10.0%
More on Uhrichsville: Data | Crime | Cost Of Living | Real Estate

/10
% Adult High School Dropout: 17.0%
% Highly Educated: 10.0%
More on Grafton: Data | Crime | Cost Of Living | Real Estate
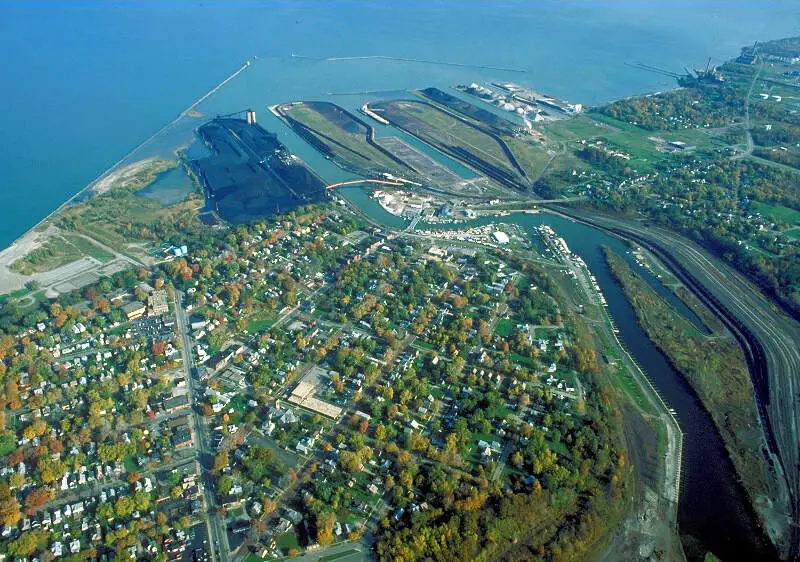
/10
% Adult High School Dropout: 21.0%
% Highly Educated: 11.0%
More on Ashtabula: Data | Cost Of Living | Real Estate
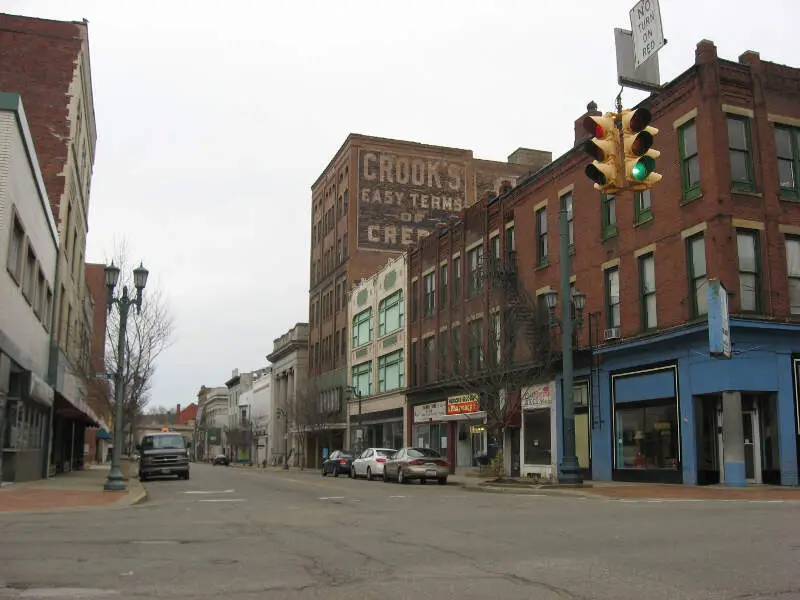
/10
% Adult High School Dropout: 15.0%
% Highly Educated: 8.0%
More on East Liverpool: Data | Crime | Cost Of Living | Real Estate
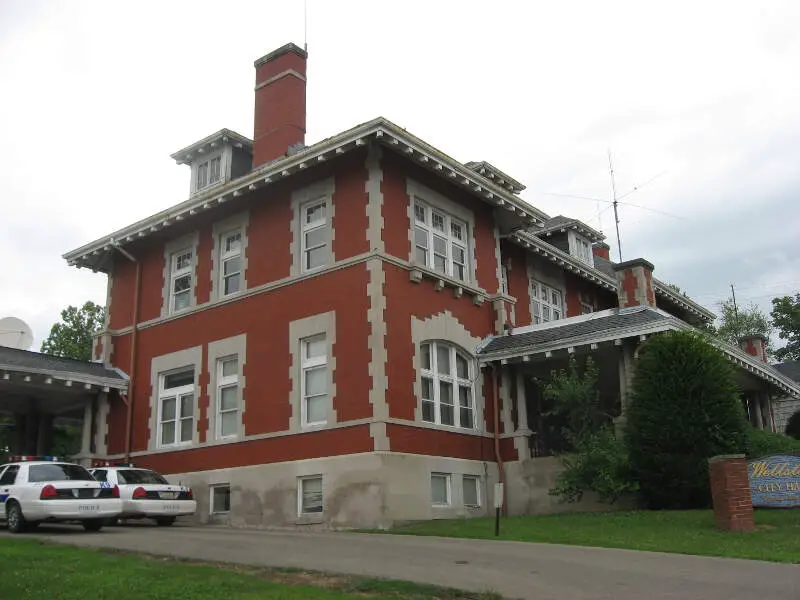
/10
% Adult High School Dropout: 15.0%
% Highly Educated: 7.0%
More on Wellston: Data | Crime | Cost Of Living | Real Estate
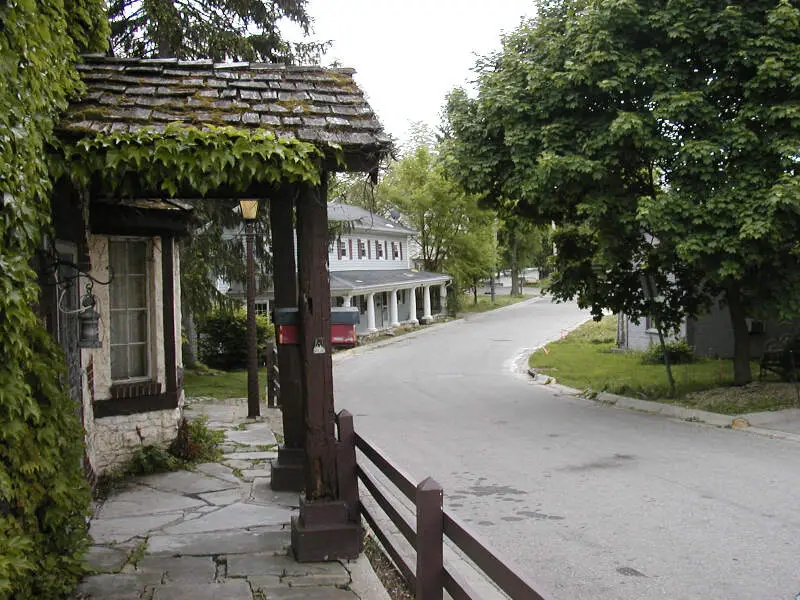
/10
% Adult High School Dropout: 18.0%
% Highly Educated: 14.0%
More on New Carlisle: Data | Cost Of Living | Real Estate
/10
% Adult High School Dropout: 14.0%
% Highly Educated: 11.0%
More on Franklin: Data | Crime | Cost Of Living | Real Estate
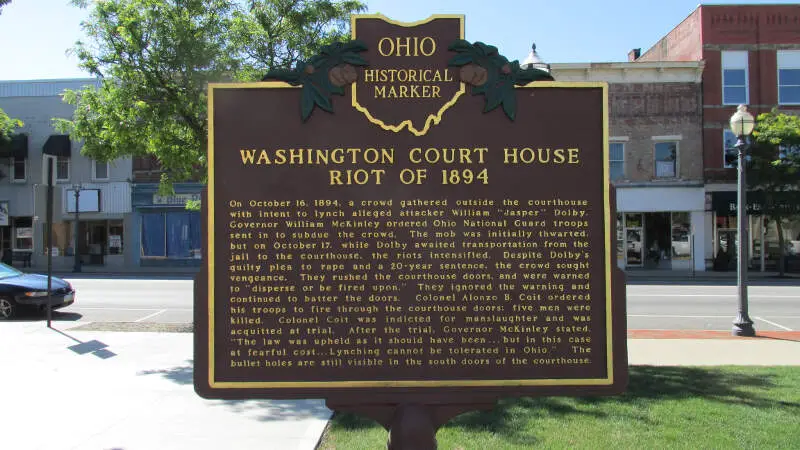
/10
% Adult High School Dropout: 15.0%
% Highly Educated: 13.0%
More on Washington Court House: Data | Crime | Cost Of Living | Real Estate

/10
% Adult High School Dropout: 16.0%
% Highly Educated: 14.0%
More on Lorain: Data | Crime | Cost Of Living | Real Estate
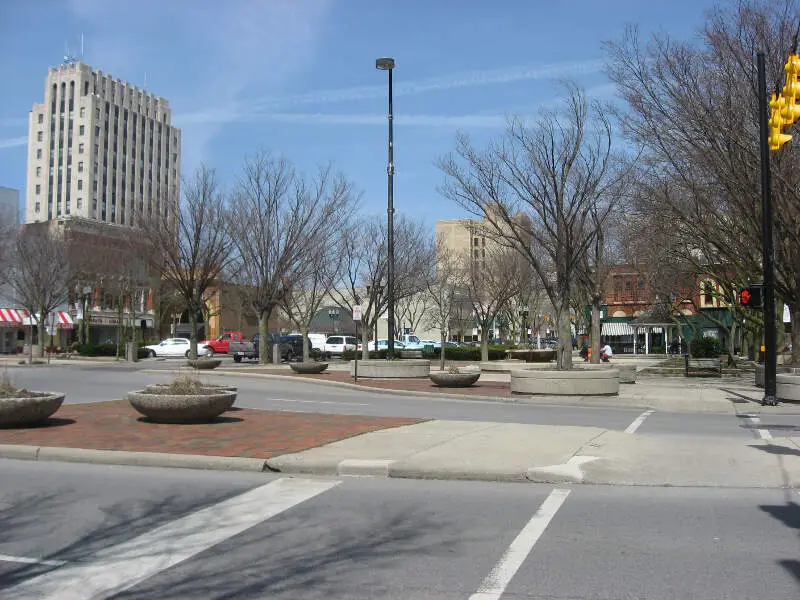
/10
% Adult High School Dropout: 13.0%
% Highly Educated: 10.0%
More on Lima: Data | Crime | Cost Of Living | Real Estate
Methodology: How we determined the dumbest cities in the Buckeye State
We realize that formal education is only part of it when it comes to being intelligent, but on the other hand, knowing the difference between they’re, their, and there is always going to make you look pretty stupid.
So, we used Saturday Night Science to narrow down our criteria to focus on a city’s educational opportunities and what percentage of the population takes advantage of those opportunities.
In short, we came up with these criteria to determine the dumbest cities in Ohio:
- % of the city’s population with less than a high school education (Age 25+)
- % of city’s population with a college degree (Age 25+)
We got the data from the U.S. Census 2018-2022 American Community Survey.
Then, our algorithm generates a rank for each place in these categories. After crunching all the numbers, a ranking of the cities in Ohio from dumbest to brightest.
For this ranking, we used every Ohio city with at least 5,000 residents. We updated this article for 2024, and it’s our tenth time ranking the dumbest cities in Ohio.
There You Have It – Now That You’re Asleep
If you’re measuring the locations in Ohio where there are a high number of dropouts and adults who never received a formal education, this is an accurate ranking.
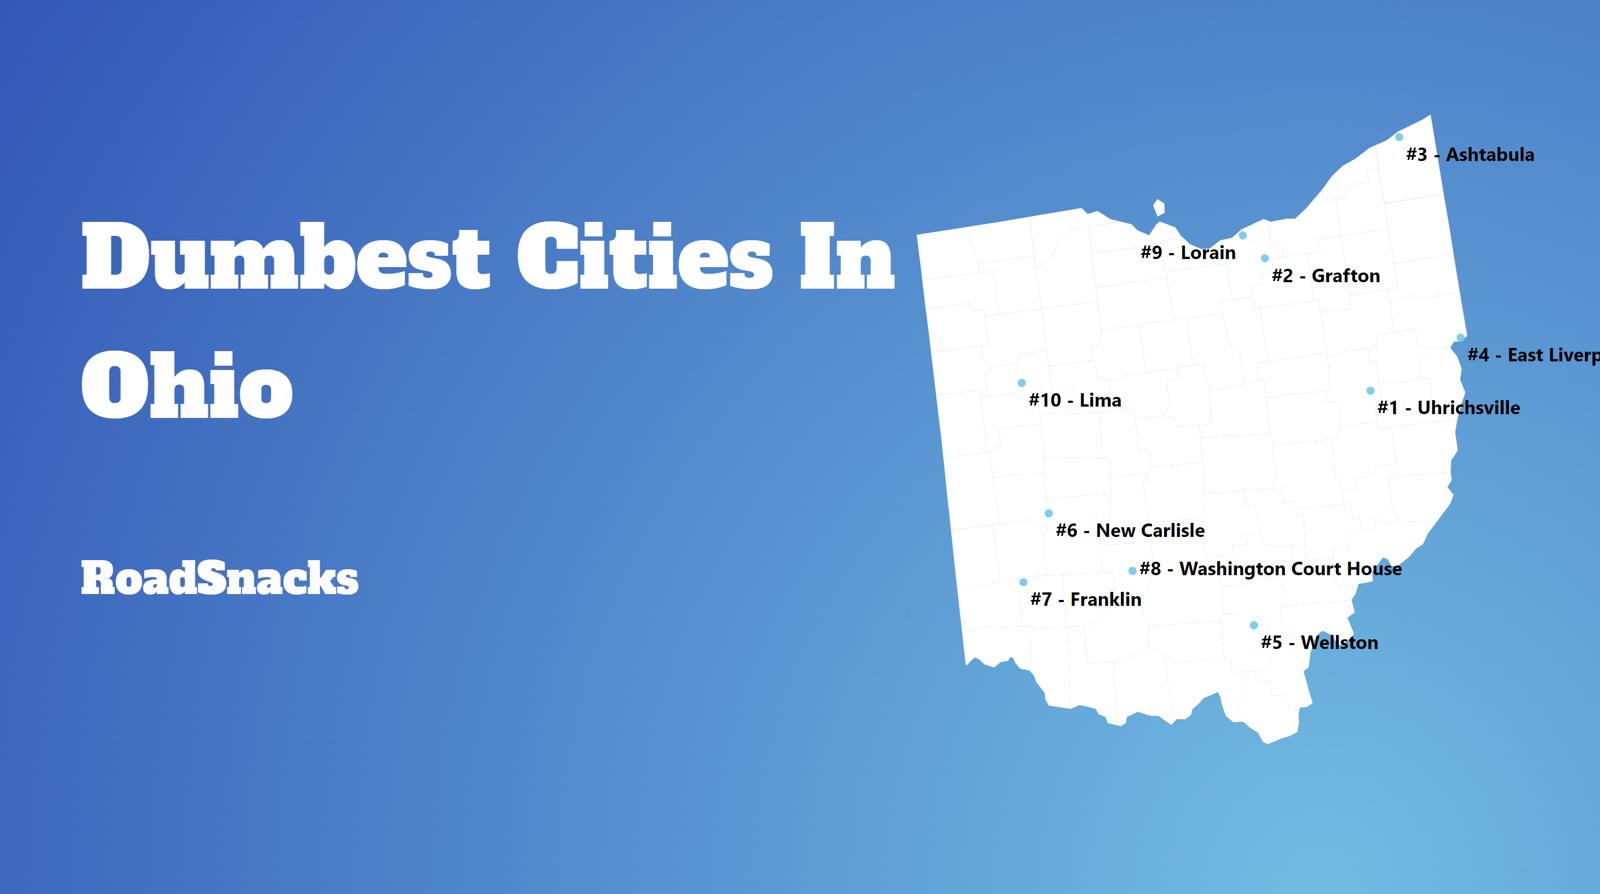
The dumbest cities in Ohio are Uhrichsville, Grafton, Ashtabula, East Liverpool, Wellston, New Carlisle, Franklin, Washington Court House, Lorain, and Lima.
If you’re also curious enough, here are the smartest places in Ohio, according to science:
- New Albany
- Pepper Pike
- Montgomery
For more Ohio reading, check out:
- Best Places To Live In Ohio
- Cheapest Places To Live In Ohio
- Most Dangerous Cities In Ohio
- Richest Cities In Ohio
- Safest Places In Ohio
- Worst Places To Live In Ohio
- Most Expensive Places To Live In Ohio
Dumbest Cities In Ohio For 2024
| Rank | City | Population | % Adult High School Dropout | % Highly Educated |
|---|---|---|---|---|
| 1 | Uhrichsville, OH | 5,238 | 17.0% | 10.0% |
| 2 | Grafton, OH | 5,730 | 17.0% | 10.0% |
| 3 | Ashtabula, OH | 18,003 | 21.0% | 11.0% |
| 4 | East Liverpool, OH | 9,969 | 15.0% | 8.0% |
| 5 | Wellston, OH | 5,420 | 15.0% | 7.0% |
| 6 | New Carlisle, OH | 5,579 | 18.0% | 14.0% |
| 7 | Franklin, OH | 11,672 | 14.0% | 11.0% |
| 8 | Washington Court House, OH | 14,387 | 15.0% | 13.0% |
| 9 | Lorain, OH | 65,138 | 16.0% | 14.0% |
| 10 | Lima, OH | 35,555 | 13.0% | 10.0% |
| 11 | Cambridge, OH | 10,087 | 14.0% | 13.0% |
| 12 | East Cleveland, OH | 13,926 | 16.0% | 15.0% |
| 13 | Marion, OH | 35,927 | 13.0% | 10.0% |
| 14 | Youngstown, OH | 60,048 | 15.0% | 15.0% |
| 15 | Carlisle, OH | 5,488 | 14.0% | 14.0% |
| 16 | Mansfield, OH | 47,630 | 15.0% | 15.0% |
| 17 | Zanesville, OH | 24,772 | 13.0% | 13.0% |
| 18 | Bryan, OH | 8,670 | 13.0% | 14.0% |
| 19 | Bucyrus, OH | 11,643 | 12.0% | 11.0% |
| 20 | Obetz, OH | 5,580 | 14.0% | 15.0% |
| 21 | Hamilton, OH | 63,149 | 14.0% | 15.0% |
| 22 | Whitehall, OH | 20,035 | 13.0% | 14.0% |
| 23 | Garfield Heights, OH | 29,497 | 13.0% | 14.0% |
| 24 | Springfield, OH | 58,645 | 14.0% | 15.0% |
| 25 | Canton, OH | 70,589 | 13.0% | 14.0% |
| 26 | Willard, OH | 6,189 | 12.0% | 13.0% |
| 27 | Campbell, OH | 7,819 | 16.0% | 17.0% |
| 28 | Warren, OH | 39,204 | 14.0% | 16.0% |
| 29 | London, OH | 10,316 | 16.0% | 18.0% |
| 30 | Galion, OH | 10,378 | 12.0% | 14.0% |
| 31 | Fostoria, OH | 12,904 | 10.0% | 11.0% |
| 32 | Piqua, OH | 20,441 | 11.0% | 13.0% |
| 33 | North College Hill, OH | 9,602 | 14.0% | 17.0% |
| 34 | Middletown, OH | 50,514 | 14.0% | 17.0% |
| 35 | Sidney, OH | 20,350 | 13.0% | 16.0% |
| 36 | Portsmouth, OH | 18,130 | 14.0% | 18.0% |
| 37 | Elyria, OH | 52,780 | 12.0% | 15.0% |
| 38 | Cleveland, OH | 370,365 | 18.0% | 20.0% |
| 39 | Maple Heights, OH | 23,473 | 11.0% | 15.0% |
| 40 | Hillsboro, OH | 6,492 | 13.0% | 17.0% |
| 41 | Conneaut, OH | 12,372 | 12.0% | 16.0% |
| 42 | Painesville, OH | 20,387 | 16.0% | 20.0% |
| 43 | St. Marys, OH | 8,323 | 9.0% | 13.0% |
| 44 | Martins Ferry, OH | 6,283 | 9.0% | 11.0% |
| 45 | Urbana, OH | 11,156 | 11.0% | 16.0% |
| 46 | Barberton, OH | 25,167 | 13.0% | 18.0% |
| 47 | Alliance, OH | 21,603 | 12.0% | 17.0% |
| 48 | Brook Park, OH | 18,509 | 11.0% | 16.0% |
| 49 | Moraine, OH | 6,484 | 10.0% | 15.0% |
| 50 | Salem, OH | 11,861 | 13.0% | 19.0% |
| 51 | Circleville, OH | 14,017 | 13.0% | 19.0% |
| 52 | Sandusky, OH | 24,964 | 13.0% | 19.0% |
| 53 | Fremont, OH | 15,900 | 9.0% | 15.0% |
| 54 | Shelby, OH | 8,360 | 10.0% | 16.0% |
| 55 | Dayton, OH | 137,305 | 13.0% | 20.0% |
| 56 | Port Clinton, OH | 6,024 | 12.0% | 19.0% |
| 57 | Brooklyn, OH | 11,259 | 12.0% | 19.0% |
| 58 | Trenton, OH | 13,133 | 8.0% | 14.0% |
| 59 | Logan, OH | 7,168 | 8.0% | 13.0% |
| 60 | Norwalk, OH | 17,041 | 10.0% | 17.0% |
| 61 | Bedford Heights, OH | 10,933 | 10.0% | 17.0% |
| 62 | Greenville, OH | 12,768 | 10.0% | 17.0% |
| 63 | Ironton, OH | 10,597 | 11.0% | 19.0% |
| 64 | Toledo, OH | 269,962 | 12.0% | 20.0% |
| 65 | Massillon, OH | 32,179 | 9.0% | 16.0% |
| 66 | Coshocton, OH | 11,054 | 10.0% | 19.0% |
| 67 | Ravenna, OH | 11,323 | 11.0% | 20.0% |
| 68 | Kenton, OH | 7,685 | 9.0% | 17.0% |
| 69 | Xenia, OH | 25,499 | 12.0% | 21.0% |
| 70 | Bellefontaine, OH | 13,785 | 8.0% | 16.0% |
| 71 | Defiance, OH | 16,852 | 10.0% | 19.0% |
| 72 | Rittman, OH | 6,058 | 11.0% | 21.0% |
| 73 | Riverside, OH | 24,482 | 11.0% | 21.0% |
| 74 | Belpre, OH | 6,690 | 8.0% | 16.0% |
| 75 | Bellevue, OH | 8,210 | 8.0% | 16.0% |
| 76 | Akron, OH | 190,273 | 12.0% | 23.0% |
| 77 | Springdale, OH | 10,991 | 15.0% | 30.0% |
| 78 | Girard, OH | 9,565 | 9.0% | 19.0% |
| 79 | Wapakoneta, OH | 9,879 | 9.0% | 19.0% |
| 80 | Chillicothe, OH | 22,002 | 9.0% | 19.0% |
| 81 | Trotwood, OH | 23,125 | 9.0% | 19.0% |
| 82 | Jackson, OH | 6,222 | 7.0% | 16.0% |
| 83 | Van Wert, OH | 10,828 | 8.0% | 18.0% |
| 84 | Wilmington, OH | 12,669 | 10.0% | 22.0% |
| 85 | Delphos, OH | 7,153 | 10.0% | 21.0% |
| 86 | Struthers, OH | 10,061 | 8.0% | 18.0% |
| 87 | Mount Healthy, OH | 6,949 | 7.0% | 16.0% |
| 88 | Ashland, OH | 19,270 | 10.0% | 24.0% |
| 89 | Clyde, OH | 6,314 | 8.0% | 19.0% |
| 90 | West Carrollton, OH | 13,060 | 9.0% | 21.0% |
| 91 | Fairborn, OH | 34,494 | 11.0% | 28.0% |
| 92 | Warrensville Heights, OH | 13,659 | 8.0% | 19.0% |
| 93 | Niles, OH | 18,107 | 9.0% | 22.0% |
| 94 | Orrville, OH | 8,304 | 10.0% | 26.0% |
| 95 | Cheviot, OH | 8,682 | 8.0% | 20.0% |
| 96 | New Philadelphia, OH | 17,602 | 9.0% | 23.0% |
| 97 | Parma Heights, OH | 20,706 | 10.0% | 25.0% |
| 98 | Norton, OH | 11,643 | 9.0% | 25.0% |
| 99 | Parma, OH | 80,587 | 9.0% | 24.0% |
| 100 | Geneva, OH | 5,935 | 8.0% | 21.0% |

While I appreciate that you made your criteria transparent, I will have to say that you did not isolate your variables. Using graduation rates and bar to library ratio says that you did not consider income or city tax income as a factor. It takes money to operate a library, and to build one. Also, bars are for profit, libraries are nonprofit. The data is incongruent with an actual scientific test, and has nothing to do with intelligence. I would say that this is probably a troll link, meant to draw people in who may be offended, and I probably should not have taken the bait. Anyway, this means nothing. Greetings from someone who grew up outside of Marion, OH. Also, all of these areas are economically depressed…if I didn’t stress that before.
Explain to me how men = dumb. That’s the most sexist, misandrist drivel I’ve ever read. You should be ashamed of yourself, and this website needs to fire this sexist idiot.
Niles is 5 mins. From Youngstown, Ohio and isn’t way out by the Pa. Line. We all can get to PA in 15 mins.
Something else to be considered. Many of the cities on this list have state correctional facilities either within the city limits or very nearby. That will skew the data also. The survey was setup/fixed to make the cities/state look awful. People who do surveys like this are only looking for clicks for their advertisers. It is all about the revenue for their pockets.