
The unfortunate fact of the matter is that some places in the Keystone State have a larger percent of their population that never graduated from high school.
While the emphasis on going to college might be overblown, the fact is that not graduating from high school puts you at a significant disadvantage on average. Educational attainment might not be the best way to measure one person’s intelligence, but it does shine a light on the state.
We will use Saturday Night Science to determine what places in Pennsylvania have the highest percentage of adults without a high school degree.
A recent study we published found that Pennsylvania is the 23rd smartest state in the United States, with an average IQ of 100.
But that doesn’t mean that a few cities in Pennsylvania are a bit slower than others due to a lack of basic education.
Table Of Contents: Top Ten | Methodology | Summary | Table
The 10 Dumbest Places In Pennsylvania
Don’t freak out.
Some places are just smarter than others, but that says nothing about the character of the people living there. It’s another data point a real estate agent would never tell you.
For this ranking, we only looked at cities with populations greater than 5,000, leaving us 176 cities in Pennsylvania to rank. You can take a look at the data below.
For more Pennsylvania reading, check out:
The 10 Dumbest Places In Pennsylvania For 2025


/10
% Adult High School Dropout: 25.0%
% Highly Educated: 11.0%
More on Hazleton: Data

/10
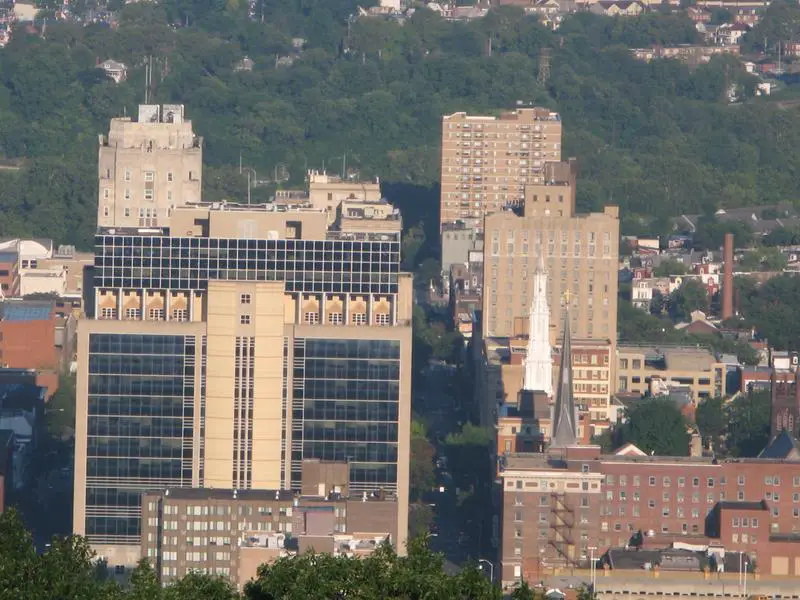
% Adult High School Dropout: 27.0%
% Highly Educated: 12.0%
More on Reading: Data

/10
% Adult High School Dropout: 16.0%
% Highly Educated: 11.0%
More on Plymouth: Data

/10
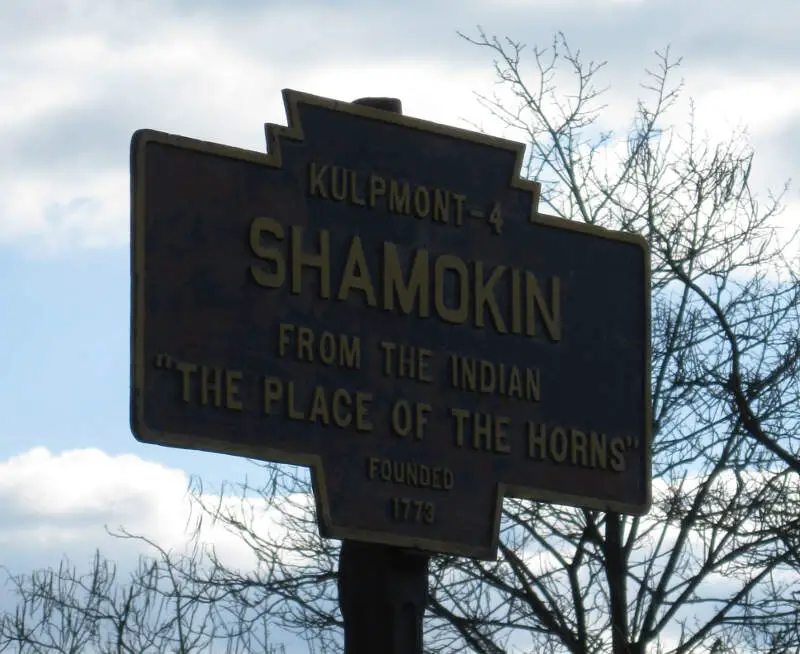
% Adult High School Dropout: 21.0%
% Highly Educated: 15.0%
More on Shamokin: Data

/10
% Adult High School Dropout: 15.0%
% Highly Educated: 12.0%
More on Chester: Data
/10
% Adult High School Dropout: 22.0%
% Highly Educated: 16.0%
More on West York: Data

/10
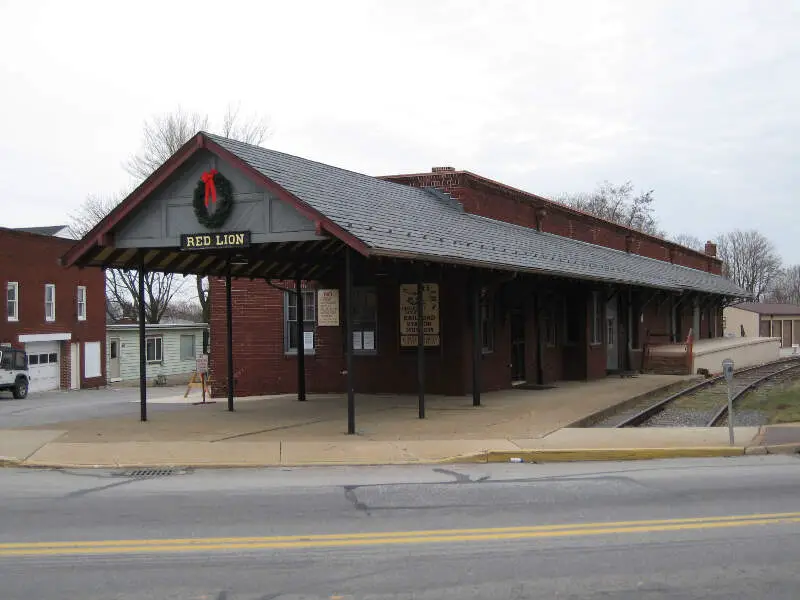
% Adult High School Dropout: 15.0%
% Highly Educated: 14.0%
More on Red Lion: Data
/10
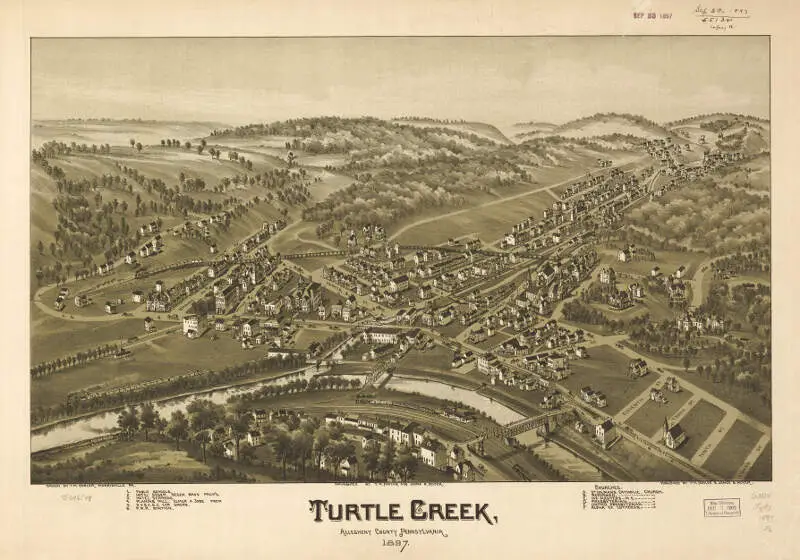
% Adult High School Dropout: 14.0%
% Highly Educated: 12.0%
More on Turtle Creek: Data

/10
% Adult High School Dropout: 17.0%
% Highly Educated: 15.0%
More on Lebanon: Data

/10
% Adult High School Dropout: 18.0%
% Highly Educated: 16.0%
More on Coatesville: Data
Methodology: How we determined the dumbest cities in the Keystone State
We realize that formal education is only part of it when it comes to being intelligent, but on the other hand, knowing the difference between they’re, their, and there is always going to make you look pretty stupid.
So, we used Saturday Night Science to narrow down our criteria to focus on a city’s educational opportunities and what percentage of the population takes advantage of those opportunities.
In short, we came up with these criteria to determine the dumbest cities in Pennsylvania:
- % of the city’s population with less than a high school education (Age 25+)
- % of city’s population with a college degree (Age 25+)
We got the data from the U.S. Census 2019-2023 American Community Survey.
Then, our algorithm generates a rank for each place in these categories. After crunching all the numbers, a ranking of the cities in Pennsylvania from dumbest to brightest.
For this ranking, we used every Pennsylvania city with at least 5,000 residents. We updated this article for 2025, and it’s our tenth time ranking the dumbest cities in Pennsylvania.
There You Have It – Now That You’re Asleep
If you’re measuring the locations in Pennsylvania where there are a high number of dropouts and adults who never received a formal education, this is an accurate ranking.
The dumbest cities in Pennsylvania are Hazleton, Reading, Plymouth, Shamokin, Chester, West York, Red Lion, Turtle Creek, Lebanon, and Coatesville.
If you’re also curious enough, here are the smartest places in Pennsylvania, according to science:
- Fox Chapel
- Swarthmore
- State College
For more Pennsylvania reading, check out:
- Best Places To Live In Pennsylvania
- Cheapest Places To Live In Pennsylvania
- Most Dangerous Cities In Pennsylvania
- Richest Cities In Pennsylvania
- Safest Places In Pennsylvania
- Worst Places To Live In Pennsylvania
- Most Expensive Places To Live In Pennsylvania
Dumbest Cities In Pennsylvania For 2025
| Rank | City | Population | % Adult High School Dropout | % Highly Educated |
|---|---|---|---|---|
| 1 | Hazleton, PA | 29,886 | 25.0% | 11.0% |
| 2 | Reading, PA | 94,836 | 27.0% | 12.0% |
| 3 | Plymouth, PA | 5,761 | 16.0% | 11.0% |
| 4 | Shamokin, PA | 6,890 | 21.0% | 15.0% |
| 5 | Chester, PA | 33,209 | 15.0% | 12.0% |
| 6 | West York, PA | 5,081 | 22.0% | 16.0% |
| 7 | Red Lion, PA | 6,494 | 15.0% | 14.0% |
| 8 | Turtle Creek, PA | 5,046 | 14.0% | 12.0% |
| 9 | Lebanon, PA | 26,600 | 17.0% | 15.0% |
| 10 | Coatesville, PA | 13,323 | 18.0% | 16.0% |
| 11 | West Hazleton, PA | 5,156 | 22.0% | 17.0% |
| 12 | Mckeesport, PA | 17,520 | 13.0% | 13.0% |
| 13 | York, PA | 44,830 | 18.0% | 17.0% |
| 14 | Johnstown, PA | 18,245 | 13.0% | 15.0% |
| 15 | Columbia, PA | 10,217 | 18.0% | 17.0% |
| 16 | Sunbury, PA | 9,643 | 11.0% | 11.0% |
| 17 | Wilkes-Barre, PA | 44,217 | 16.0% | 19.0% |
| 18 | Hanover, PA | 16,483 | 13.0% | 17.0% |
| 19 | Berwick, PA | 10,291 | 12.0% | 16.0% |
| 20 | Allentown, PA | 125,320 | 18.0% | 20.0% |
| 21 | New Castle, PA | 21,727 | 11.0% | 15.0% |
| 22 | Collingdale, PA | 8,862 | 14.0% | 19.0% |
| 23 | Darby, PA | 10,664 | 12.0% | 16.0% |
| 24 | Nanticoke, PA | 10,610 | 13.0% | 19.0% |
| 25 | Taylor, PA | 6,261 | 14.0% | 20.0% |
| 26 | Wilson, PA | 8,196 | 14.0% | 20.0% |
| 27 | Tamaqua, PA | 6,922 | 11.0% | 16.0% |
| 28 | Clifton Heights, PA | 6,821 | 12.0% | 17.0% |
| 29 | Bradford, PA | 7,738 | 12.0% | 18.0% |
| 30 | Palmerton, PA | 5,624 | 11.0% | 16.0% |
| 31 | Bangor, PA | 5,158 | 12.0% | 19.0% |
| 32 | Steelton, PA | 6,267 | 9.0% | 16.0% |
| 33 | Mount Carmel, PA | 5,695 | 10.0% | 17.0% |
| 34 | Connellsville, PA | 6,914 | 11.0% | 19.0% |
| 35 | Carbondale, PA | 8,820 | 11.0% | 18.0% |
| 36 | Duquesne, PA | 5,186 | 7.0% | 11.0% |
| 37 | Tyrone, PA | 5,421 | 8.0% | 16.0% |
| 38 | Scranton, PA | 76,074 | 13.0% | 23.0% |
| 39 | Lancaster, PA | 57,683 | 18.0% | 27.0% |
| 40 | Ephrata, PA | 13,729 | 12.0% | 23.0% |
| 41 | Erie, PA | 94,156 | 12.0% | 22.0% |
| 42 | Vandergrift, PA | 5,028 | 7.0% | 15.0% |
| 43 | Uniontown, PA | 9,819 | 11.0% | 21.0% |
| 44 | Pottsville, PA | 13,374 | 11.0% | 21.0% |
| 45 | Somerset, PA | 5,984 | 14.0% | 26.0% |
| 46 | Beaver Falls, PA | 8,885 | 10.0% | 20.0% |
| 47 | Sharon, PA | 13,019 | 9.0% | 19.0% |
| 48 | New Holland, PA | 5,743 | 11.0% | 22.0% |
| 49 | Corry, PA | 6,162 | 12.0% | 24.0% |
| 50 | Bristol, PA | 9,874 | 11.0% | 23.0% |
| 51 | Washington, PA | 13,361 | 9.0% | 20.0% |
| 52 | Harrisburg, PA | 50,092 | 13.0% | 27.0% |
| 53 | Folcroft, PA | 6,748 | 11.0% | 22.0% |
| 54 | Oxford, PA | 5,763 | 18.0% | 32.0% |
| 55 | Mckees Rocks, PA | 5,827 | 6.0% | 11.0% |
| 56 | Easton, PA | 29,079 | 13.0% | 27.0% |
| 57 | Lock Haven, PA | 8,386 | 11.0% | 24.0% |
| 58 | East Stroudsburg, PA | 9,278 | 13.0% | 30.0% |
| 59 | Kennett Square, PA | 6,096 | 19.0% | 36.0% |
| 60 | St. Marys, PA | 12,612 | 7.0% | 19.0% |
| 61 | Jeannette, PA | 8,719 | 7.0% | 18.0% |
| 62 | Aliquippa, PA | 9,146 | 8.0% | 21.0% |
| 63 | Waynesboro, PA | 11,044 | 7.0% | 18.0% |
| 64 | Williamsport, PA | 27,629 | 11.0% | 27.0% |
| 65 | Butler, PA | 13,306 | 8.0% | 21.0% |
| 66 | Stroudsburg, PA | 5,898 | 13.0% | 32.0% |
| 67 | Chambersburg, PA | 22,051 | 10.0% | 26.0% |
| 68 | Philadelphia, PA | 1,582,432 | 13.0% | 34.0% |
| 69 | Birdsboro, PA | 5,090 | 9.0% | 26.0% |
| 70 | Lehighton, PA | 5,268 | 5.0% | 16.0% |
| 71 | Milton, PA | 6,582 | 5.0% | 15.0% |
| 72 | Pittston, PA | 7,618 | 7.0% | 21.0% |
| 73 | Altoona, PA | 43,508 | 7.0% | 20.0% |
| 74 | Monessen, PA | 6,825 | 8.0% | 25.0% |
| 75 | Meadville, PA | 12,723 | 8.0% | 25.0% |
| 76 | Exeter, PA | 5,514 | 7.0% | 22.0% |
| 77 | Millersville, PA | 8,711 | 12.0% | 34.0% |
| 78 | Clairton, PA | 6,105 | 8.0% | 24.0% |
| 79 | Duryea, PA | 5,054 | 7.0% | 22.0% |
| 80 | Dubois, PA | 7,449 | 8.0% | 27.0% |
| 81 | Huntingdon, PA | 6,884 | 8.0% | 28.0% |
| 82 | Ambridge, PA | 6,912 | 6.0% | 21.0% |
| 83 | Nazareth, PA | 6,032 | 7.0% | 25.0% |
| 84 | Lewisburg, PA | 5,247 | 14.0% | 43.0% |
| 85 | Lansdale, PA | 18,865 | 12.0% | 38.0% |
| 86 | Shippensburg, PA | 5,811 | 10.0% | 33.0% |
| 87 | Titusville, PA | 5,230 | 5.0% | 19.0% |
| 88 | New Brighton, PA | 5,600 | 4.0% | 17.0% |
| 89 | Selinsgrove, PA | 5,655 | 11.0% | 35.0% |
| 90 | Norwood, PA | 5,915 | 7.0% | 26.0% |
| 91 | California, PA | 5,046 | 8.0% | 30.0% |
| 92 | Yeadon, PA | 12,091 | 6.0% | 22.0% |
| 93 | Palmyra, PA | 7,769 | 7.0% | 25.0% |
| 94 | Punxsutawney, PA | 5,689 | 5.0% | 20.0% |
| 95 | Baldwin, PA | 21,159 | 8.0% | 32.0% |
| 96 | Souderton, PA | 7,215 | 10.0% | 36.0% |
| 97 | Glenolden, PA | 7,207 | 7.0% | 28.0% |
| 98 | Bethlehem, PA | 77,069 | 9.0% | 36.0% |
| 99 | Schuylkill Haven, PA | 5,247 | 3.0% | 17.0% |
| 100 | Monaca, PA | 5,557 | 6.0% | 23.0% |
Kennett Square may be on the dumb list but apparently the writer is not very bright either! Kennett Square is nowhere near New Jersey. If the writer meant Delaware border, they are still wrong because Kennett Square is not on the Delaware boarder either. Kennett TOWNSHIP is on the Delaware border but that is an entirely different municipality.
“We used science and data to determine which cities in PA are real dummies.”
I’m not sure if science was actually used in this. The data was, poorly.
I’m also not too sure about the legitimacy of this website in general. I’ll have to add it to the list of “special derp derp” news sites out there.
Shenandoah is hours away from West Virginia. It is in Schuylkill County.
Whoever wrote this must have done their research in one of the above mentioned bars. Not only is Shenandoah in the east central county of Schuylkill, it hasn’t been part of Northumberland County since the early 1800’s.
Author is a complete ignoramus. How is a bar to library ratio even remotely a scientific way to determine a community’s average intellectual capabilities? Many of these numbers are far more closely related to local economic trends, not intellect. Oops, but I am a man, so I guess my degree and experience in Geography and Geospatial Technology mean less than the poorly written piecemeal pseudoscience some unemployed English major puked onto her blog one day while she felt particularly better than people living in lower-income communities. Many of said communities either contain high concentrations of first generation immigrants working predominantly unskilled labor jobs or higher percentages of non-white people. How about this, before you start calling entire towns stupid in the name of “girl power”, go to one of these libraries you’re so fond of and try to get a basic understanding of micro- and macro- economic trends over time. Then look up more demographic information than the 4 or 5 things that liberal arts degree (that your parents paid for) taught you about. Maybe toss in some local economic history to your research. Maybe about then you would learn that you are, in fact, the dummy in this situation. Not having a GED doesn’t indicate stupidity. Neither does going to bars or being a man. Your logic is flawed. Your writing lacks substance. You are a hack, a vapid vacuum of talent and any creative substance, and a detriment to the cause of racial, economic, and sexual equality. My evidence for such claims was provided in the article above. It’s hard to make “dumb” communities the punchline of a joke, while your “career” is the punchline of the joke that is your life. Please consider finding another “profession”. You are bad at this. May I suggest bartender? Evidently there are quite a few bars out there, and I feel like that might be your speed.