
There’s no denying it: there are plenty of places in California that are downright beautiful and full of excitement.
Unfortunately, not all towns and cities in Golden State are so lucky.
Just like in all U.S. States, there are definitely some boring places within California’s’ borders. You know the places where everyone has an AARP card and the most exciting thing they do all day is post a picture of their grandchild on Facebook.
Like Lafayette, for instance. In our latest analysis, we found that this city was the most boring city in all of Oklahoma according to Saturday Night Science. But don’t feel bad if you’re a resident of Lafayette. There are plenty of other boring, lackluster places in California as well.
Here they are. Try not to jump out of your seat with excitement.
Table Of Contents: Top Ten | Methodology | Summary | Table
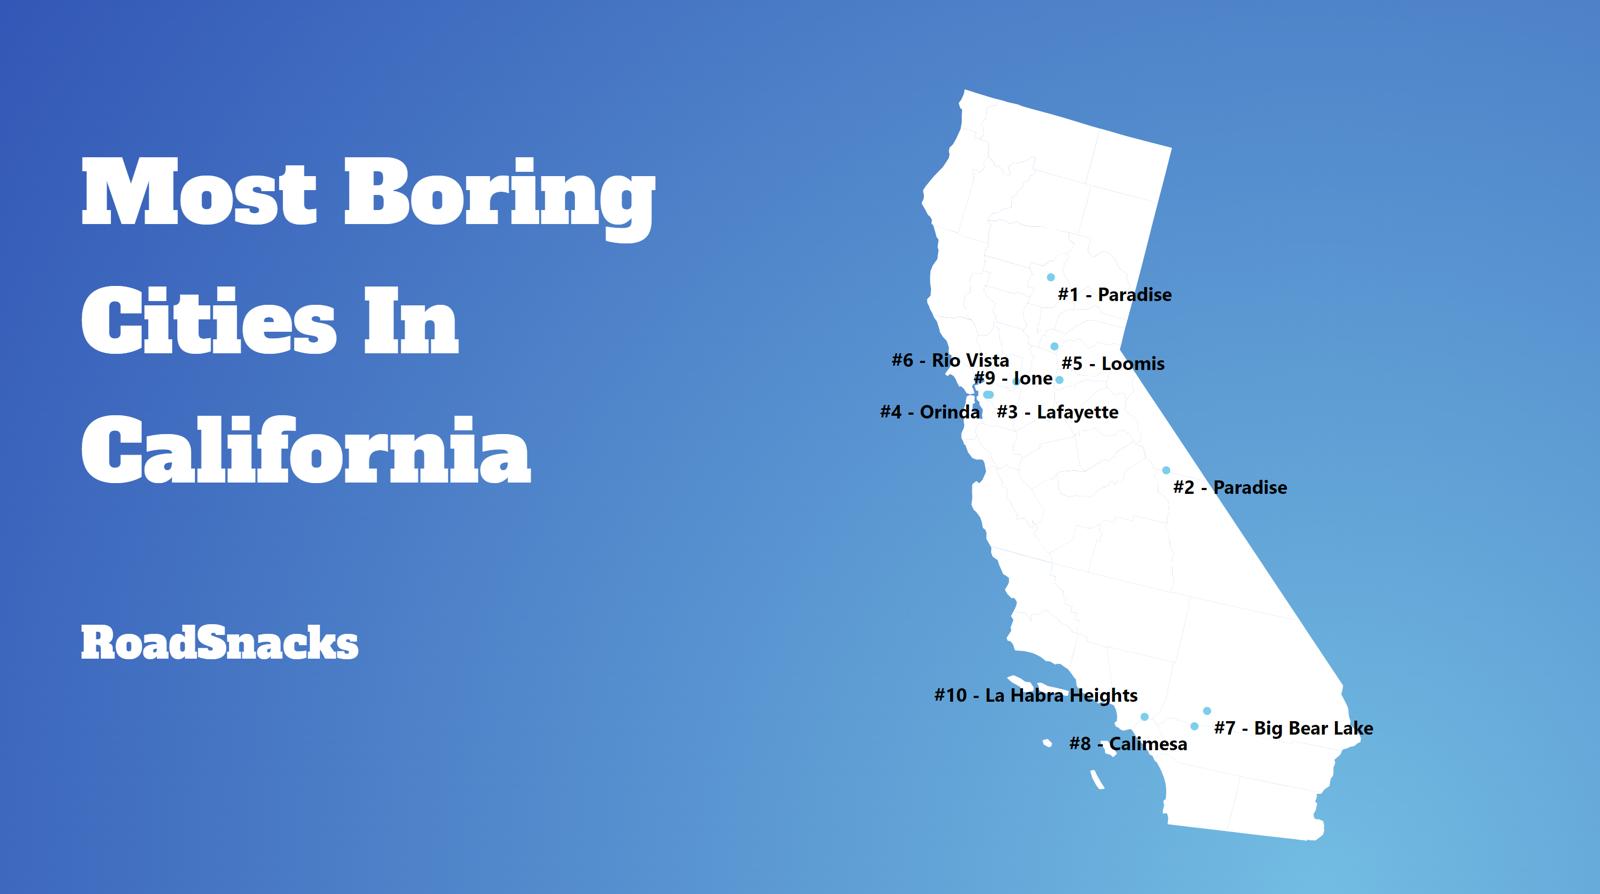
The 10 Most Boring Places In California
Don’t freak out, in fact, believe it not, a boring city is actually one a lot of people would like to call home.
Before you get all upset if your city’s name is on the list, rest assured that we didn’t use personal opinion when it comes to what classifies a city or town as “boring” or “exciting”. We crunched actual numbers to figure out which towns are statistically more boring.
Showing this data to you is the kind of thing that a real estate agent knows, but would never share.
For more California reading, check out:
The 10 Most Boring Places In California For 2026

/10
Average Age: 45.7
% Married: 31.0%
More on Lafayette: Data | Crime | Cost Of Living | Movers

/10
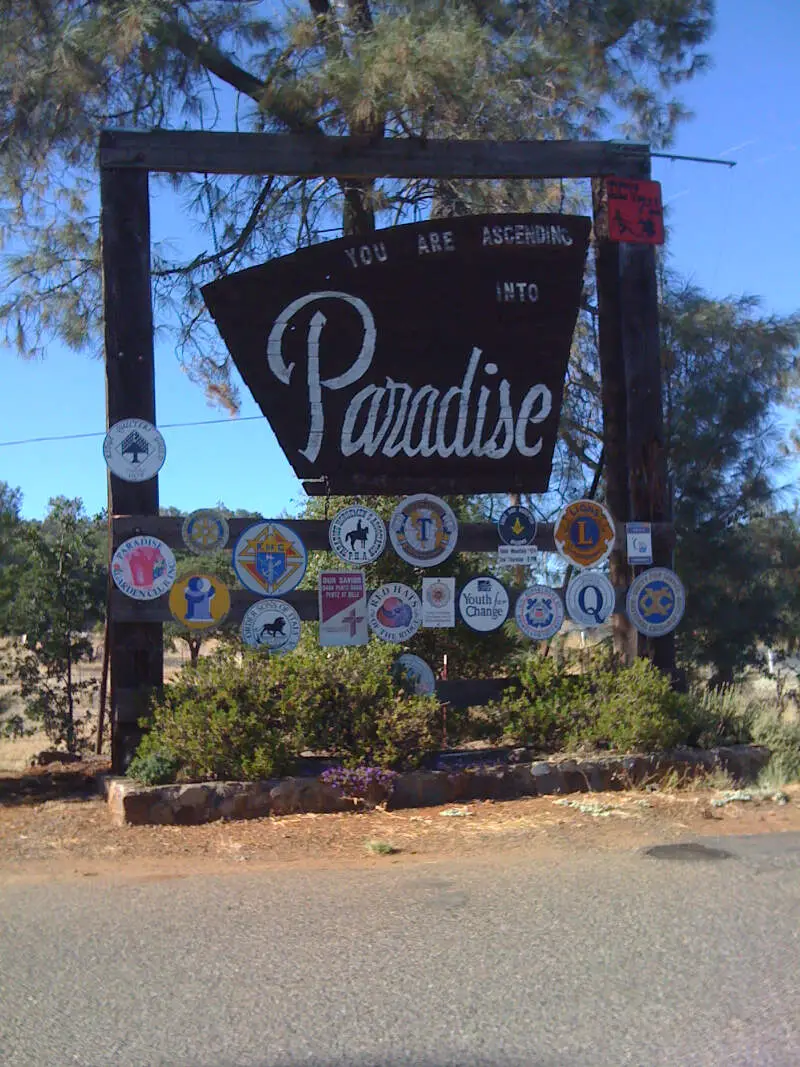
Average Age: 57.4
% Married: 39.0%
More on Paradise: Data | Crime | Cost Of Living | Movers

/10
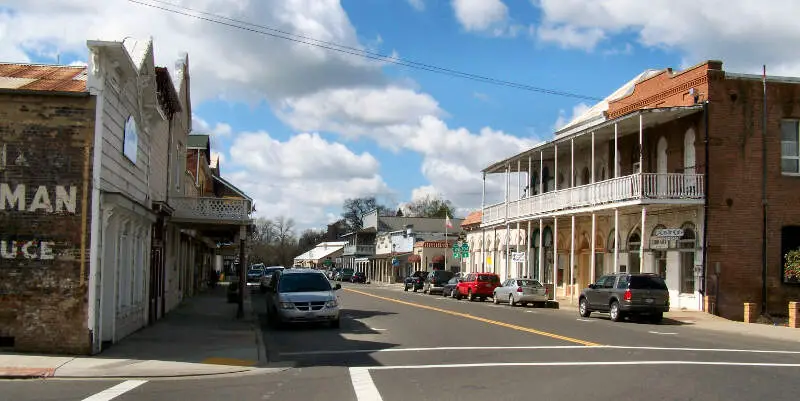
Average Age: 41.5
% Married: 27.0%
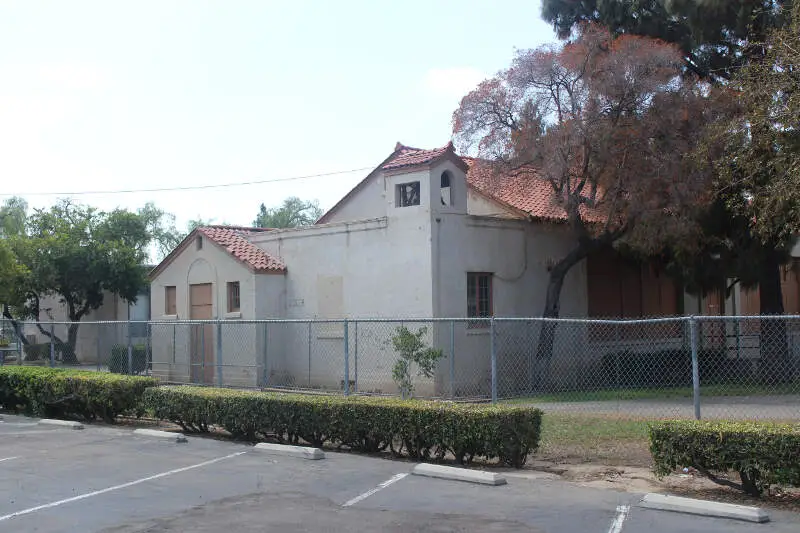
More on Ione: Data | Crime | Cost Of Living | Movers

/10
Average Age: 53.6
% Married: 36.0%
More on Villa Park: Data | Crime | Cost Of Living | Movers

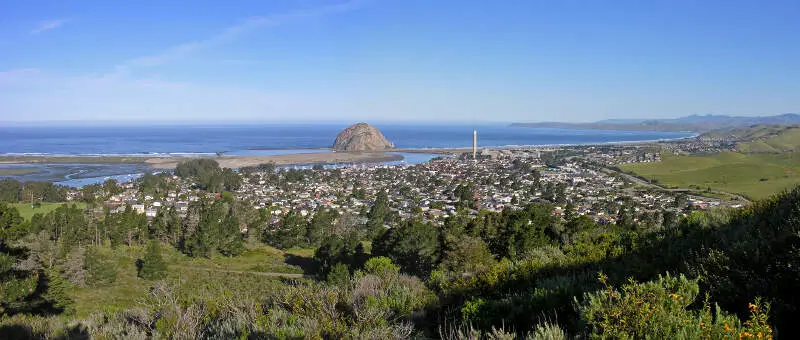
/10
Average Age: 54.3
% Married: 31.0%
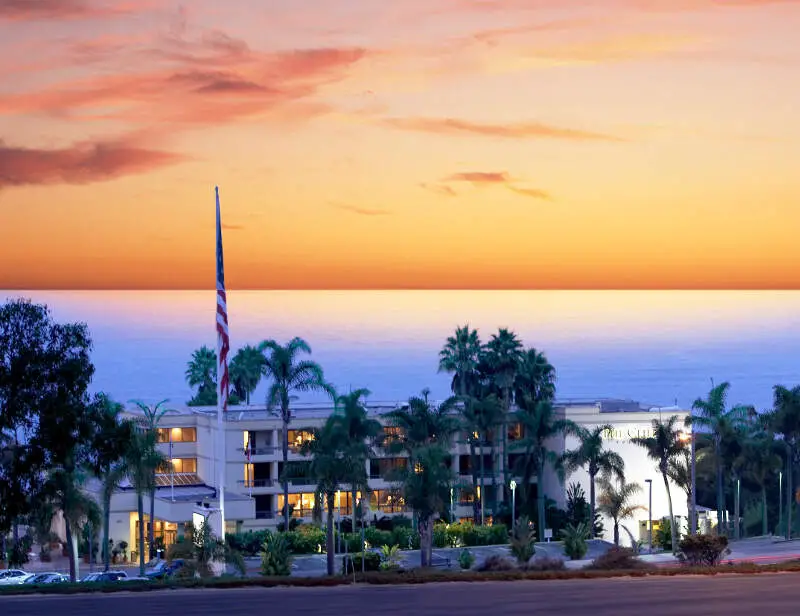
More on Morro Bay: Data | Crime | Cost Of Living | Movers
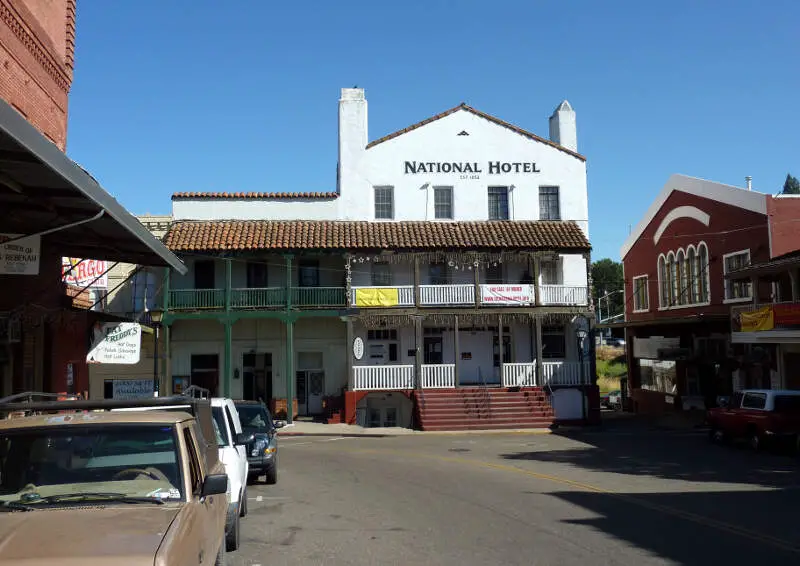
6. Jackson
/10

/10

/10
Average Age: 55.1
% Married: 30.0%
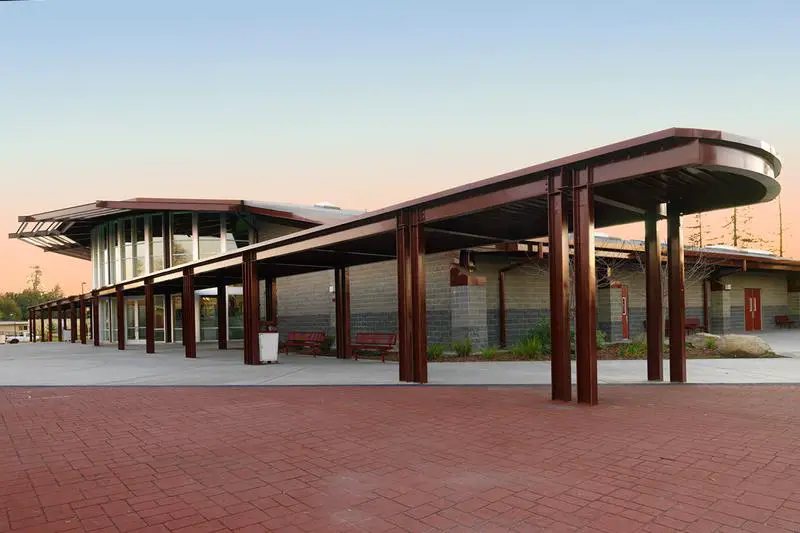
More on Pismo Beach: Data | Crime | Cost Of Living | Movers

/10
Average Age: 42.0
% Married: 25.0%
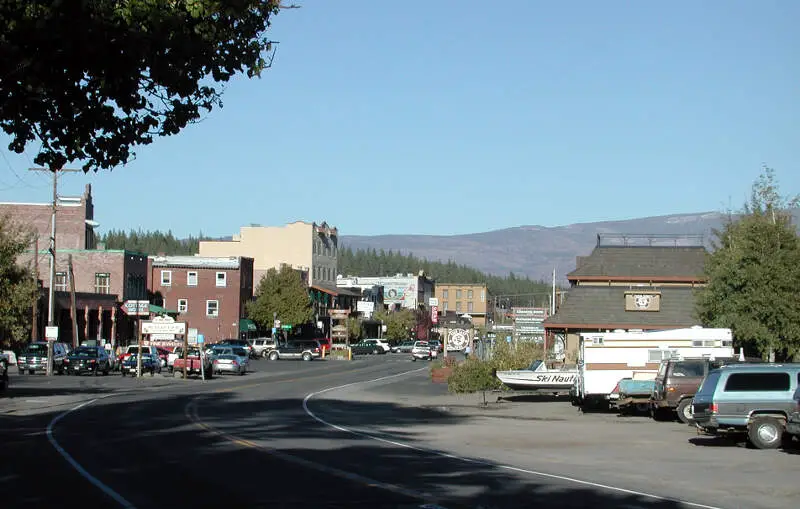
More on Truckee: Data | Crime | Cost Of Living | Movers

/10
Average Age: 47.5
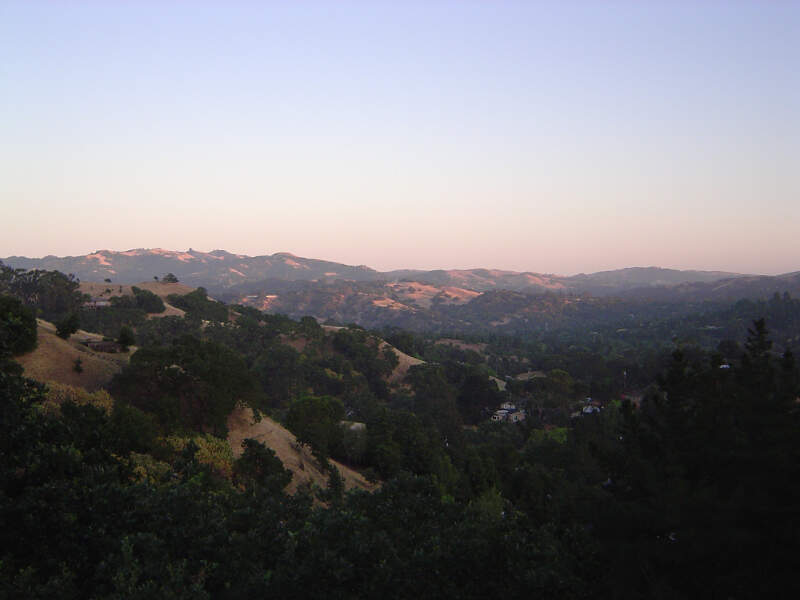
% Married: 22.0%
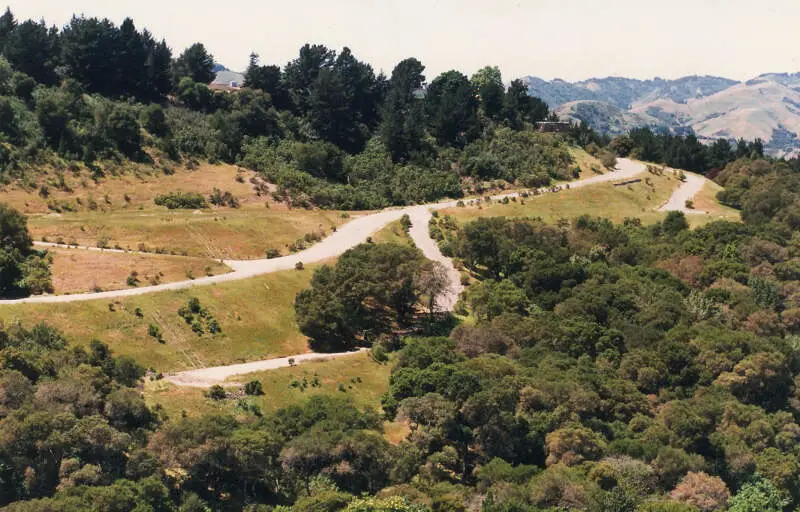
More on Orinda: Data | Crime | Cost Of Living | Movers
Methodology: How we determined the boring cities in the Golden State
You would present the following case to your friends if you were argueing with them at a bar about the most boring place to live in California. And that’s why we call it Saturday Night Science.
Because our data speaks more truth than feelings.
To figure out how boring a place is, we factored in things we generally think make people exciting, and then we figure out which cities have the least number of those exciting people.
We used the U.S. American Community Census data to gather the information presented here. HSome of the things people tend to think of as making a city’s population boring include:
- % of Population Over 25 (higher is more boring)
- % of Married Household (higher is more boring)
- Average Age (higher is more boring)
- % of Households With Kids (higher is more boring)
- Population density (lower is more boring)
Then, our algorithm generates a ranking for each place in these categories. After crunching the numbers, all of the cities ranked from most boring to most exciting.
For this ranking, we used every California city with at least 5,000 residents. This keeps us from prejudicing our rankings by including very small pockets of retired people.
Grab your rocker and hold on.
We updated this article for 2026, and it’s our eleventh time ranking the most boring cities in California.
There You Have It – Now That You’re Asleep
On a ranking like this, there are usually no winners, but since California isn’t necessarily the most boring state in the United States, the cities on this ranking can at least take solace that there are, in fact, more boring cities in the country.
The most boring cities in California are Lafayette, Paradise, Ione, Villa Park, Morro Bay, Jackson, Loomis, Pismo Beach, Truckee, and Orinda.
If you’re also curious enough, here are the most exciting places in California, according to science:
- Berkeley
- Davis
- Santa Cruz
For more California reading, check out:
- Best Places To Live In California
- Cheapest Places To Live In California
- Most Dangerous Cities In California
- Richest Cities In California
- Safest Places In California
- Worst Places To Live In California
- Most Expensive Places To Live In California
Detailed List Of The Most Boring Cities In California For 2026
| Rank | City | Population | Average Age | % Married | % Kids |
|---|---|---|---|---|---|
| 1 | Lafayette, CA | 25,285 | 45.7 | 31.0% | 37.8% |
| 2 | Paradise, CA | 7,392 | 57.4 | 39.0% | 19.7% |
| 3 | Ione, CA | 9,156 | 41.5 | 27.0% | 32.3% |
| 4 | Villa Park, CA | 5,748 | 53.6 | 36.0% | 30.7% |
| 5 | Morro Bay, CA | 10,692 | 54.3 | 31.0% | 16.0% |
| 6 | Jackson, CA | 5,048 | 50.2 | 33.0% | 21.1% |
| 7 | Loomis, CA | 6,853 | 45.5 | 35.0% | 24.4% |
| 8 | Pismo Beach, CA | 8,014 | 55.1 | 30.0% | 15.9% |
| 9 | Truckee, CA | 17,066 | 42.0 | 25.0% | 33.5% |
| 10 | Orinda, CA | 19,514 | 47.5 | 22.0% | 37.8% |
| 11 | Norco, CA | 25,054 | 40.3 | 30.0% | 36.2% |
| 12 | Rio Vista, CA | 10,102 | 63.8 | 25.0% | 10.2% |
| 13 | Mammoth Lakes, CA | 7,214 | 41.3 | 33.0% | 19.4% |
| 14 | La Quinta, CA | 38,707 | 53.3 | 25.0% | 19.9% |
| 15 | Danville, CA | 43,401 | 45.4 | 29.0% | 39.0% |
| 16 | Placerville, CA | 10,762 | 46.8 | 27.0% | 25.3% |
| 17 | Auburn, CA | 13,768 | 47.5 | 30.0% | 22.3% |
| 18 | Scotts Valley, CA | 12,044 | 47.3 | 30.0% | 27.7% |
| 19 | Canyon Lake, CA | 11,119 | 47.0 | 35.0% | 29.5% |
| 20 | Calimesa, CA | 10,902 | 40.0 | 39.0% | 32.6% |
| 21 | Agoura Hills, CA | 19,721 | 46.8 | 25.0% | 34.5% |
| 22 | Lincoln, CA | 52,956 | 43.2 | 32.0% | 32.3% |
| 23 | La Habra Heights, CA | 5,478 | 46.9 | 24.0% | 24.4% |
| 24 | San Dimas, CA | 33,789 | 43.3 | 28.0% | 30.4% |
| 25 | Corte Madera, CA | 10,077 | 45.9 | 25.0% | 39.7% |
| 26 | Big Bear Lake, CA | 5,041 | 46.6 | 24.0% | 16.7% |
| 27 | Laguna Beach, CA | 22,710 | 53.9 | 25.0% | 17.8% |
| 28 | St. Helena, CA | 5,318 | 48.9 | 15.0% | 32.5% |
| 29 | Seal Beach, CA | 24,722 | 61.5 | 22.0% | 14.3% |
| 30 | Yorba Linda, CA | 67,170 | 44.9 | 29.0% | 34.2% |
| 31 | Benicia, CA | 26,749 | 44.9 | 25.0% | 27.6% |
| 32 | Malibu, CA | 10,421 | 53.9 | 19.0% | 20.5% |
| 33 | Glendora, CA | 50,926 | 40.6 | 30.0% | 35.9% |
| 34 | Lakeport, CA | 5,113 | 42.1 | 30.0% | 28.1% |
| 35 | Poway, CA | 48,713 | 41.2 | 22.0% | 35.9% |
| 36 | Hillsborough, CA | 11,099 | 47.0 | 20.0% | 37.8% |
| 37 | San Juan Capistrano, CA | 35,095 | 46.2 | 25.0% | 31.0% |
| 38 | Arroyo Grande, CA | 18,372 | 45.8 | 39.0% | 24.8% |
| 39 | Shasta Lake, CA | 10,311 | 41.8 | 32.0% | 28.7% |
| 40 | Martinez, CA | 36,903 | 42.6 | 31.0% | 28.0% |
| 41 | Palos Verdes Estates, CA | 12,925 | 52.4 | 24.0% | 29.9% |
| 42 | Atascadero, CA | 29,712 | 40.4 | 34.0% | 30.1% |
| 43 | Cloverdale, CA | 8,886 | 45.2 | 27.0% | 26.0% |
| 44 | Buellton, CA | 5,074 | 39.0 | 27.0% | 36.4% |
| 45 | Novato, CA | 52,546 | 47.5 | 21.0% | 28.4% |
| 46 | Woodside, CA | 5,126 | 46.4 | 20.0% | 29.9% |
| 47 | Livermore, CA | 85,522 | 40.7 | 28.0% | 34.6% |
| 48 | Clayton, CA | 10,937 | 43.8 | 28.0% | 35.4% |
| 49 | Menifee, CA | 110,305 | 38.1 | 27.0% | 37.6% |
| 50 | Solvang, CA | 6,034 | 54.2 | 20.0% | 15.6% |
| 51 | Tiburon, CA | 9,012 | 51.6 | 16.0% | 31.2% |
| 52 | Pacifica, CA | 37,261 | 44.6 | 23.0% | 28.1% |
| 53 | Chino Hills, CA | 77,927 | 40.5 | 21.0% | 35.4% |
| 54 | San Clemente, CA | 63,273 | 45.6 | 28.0% | 27.3% |
| 55 | Folsom, CA | 83,916 | 41.0 | 25.0% | 37.3% |
| 56 | Half Moon Bay, CA | 11,391 | 47.4 | 21.0% | 28.6% |
| 57 | Rancho Mirage, CA | 17,563 | 66.1 | 15.0% | 8.9% |
| 58 | La Verne, CA | 30,600 | 46.4 | 29.0% | 28.7% |
| 59 | Tehachapi, CA | 11,946 | 39.1 | 22.0% | 29.6% |
| 60 | Simi Valley, CA | 125,634 | 41.9 | 26.0% | 30.6% |
| 61 | Palm Desert, CA | 51,990 | 57.5 | 17.0% | 16.0% |
| 62 | Moorpark, CA | 35,854 | 38.7 | 27.0% | 38.2% |
| 63 | Fort Bragg, CA | 7,032 | 49.0 | 22.0% | 21.2% |
| 64 | Ripon, CA | 16,201 | 40.1 | 40.0% | 35.5% |
| 65 | Escalon, CA | 7,451 | 35.7 | 40.0% | 39.2% |
| 66 | Saratoga, CA | 30,319 | 51.7 | 11.0% | 32.8% |
| 67 | Thousand Oaks, CA | 125,205 | 44.9 | 23.0% | 28.3% |
| 68 | Los Gatos, CA | 32,786 | 44.7 | 19.0% | 33.7% |
| 69 | Santee, CA | 59,332 | 40.3 | 26.0% | 33.6% |
| 70 | Brentwood, CA | 65,208 | 40.2 | 28.0% | 43.9% |
| 71 | Beaumont, CA | 56,266 | 35.5 | 30.0% | 43.6% |
| 72 | Pleasanton, CA | 76,960 | 43.1 | 17.0% | 38.8% |
| 73 | Wildomar, CA | 37,277 | 37.7 | 25.0% | 37.3% |
| 74 | Roseville, CA | 155,955 | 40.2 | 29.0% | 33.2% |
| 75 | San Anselmo, CA | 12,679 | 45.6 | 26.0% | 33.0% |
| 76 | Petaluma, CA | 59,247 | 45.3 | 27.0% | 26.3% |
| 77 | Oakley, CA | 45,183 | 36.6 | 28.0% | 41.0% |
| 78 | Sierra Madre, CA | 10,940 | 44.8 | 24.0% | 26.4% |
| 79 | Los Altos Hills, CA | 8,377 | 53.6 | 14.0% | 24.5% |
| 80 | Rancho Palos Verdes, CA | 40,864 | 49.1 | 19.0% | 31.1% |
| 81 | Rancho Santa Margarita, CA | 46,990 | 40.9 | 26.0% | 34.6% |
| 82 | Rocklin, CA | 73,327 | 38.4 | 30.0% | 38.7% |
| 83 | Santa Fe Springs, CA | 18,871 | 39.2 | 23.0% | 32.0% |
| 84 | Rolling Hills Estates, CA | 8,131 | 48.3 | 21.0% | 27.0% |
| 85 | Dana Point, CA | 32,790 | 47.4 | 28.0% | 22.8% |
| 86 | El Paso De Robles (Paso Robles), CA | 31,446 | 38.7 | 27.0% | 32.5% |
| 87 | Palm Springs, CA | 45,070 | 58.5 | 11.0% | 8.5% |
| 88 | Sebastopol, CA | 7,445 | 49.1 | 23.0% | 22.5% |
| 89 | Blythe, CA | 17,396 | 38.3 | 17.0% | 36.7% |
| 90 | Sonoma, CA | 10,670 | 57.3 | 22.0% | 16.4% |
| 91 | Yucaipa, CA | 54,421 | 36.3 | 32.0% | 37.0% |
| 92 | Piedmont, CA | 10,945 | 43.6 | 25.0% | 47.6% |
| 93 | Windsor, CA | 26,081 | 42.7 | 27.0% | 33.8% |
| 94 | Ojai, CA | 7,577 | 47.3 | 15.0% | 25.1% |
| 95 | Banning, CA | 31,093 | 42.1 | 21.0% | 28.5% |
| 96 | Grass Valley, CA | 14,113 | 49.6 | 18.0% | 22.1% |
| 97 | Camarillo, CA | 70,186 | 41.2 | 25.0% | 30.0% |
| 98 | Morgan Hill, CA | 45,425 | 39.0 | 25.0% | 38.9% |
| 99 | Healdsburg, CA | 11,243 | 44.6 | 19.0% | 24.4% |
| 100 | Galt, CA | 25,962 | 38.3 | 30.0% | 40.6% |
This is one of the most idiotic posts I have ever read. Obviously written by someone Boring, with a capital B.
This is a stupid article. What are the most interesting cities? Do you just turn the list upside-down?
looks pretty ageist to me…as if youth, per se, makes for interesting people…It doesn’t. Also , San Marino is the third wealthiest community per capita in the United States…It’s been the home for many of the nation’s major movers and shakers for decades..hardly boring. Rolling Hills is close to some of the best surfing in the world..etc. etc..If you want to pick someplace boring, how about sacramento…now that’s boring.
This article? Boooooooooorrrrrrrringggg.
This is unadulterated crap and I suspect it was written by one of those entitled millennials, no doubt. I’m 49, MARRIED to an awesome redhead, am a ROCK musician who Cosplays as a Zombie, (I was featured on the Mythbusters and we do fund raisers and food drives as Zombies, btw), Doctor Who, Star Lord and a Pirate (you know…for kids)…all this *WITH* my wife…and oh *by the way* you counted age three times in your ‘study’.
————————————————-
% of Population Over 35 (Higher is more boring) <—-Once
% of Married Household (Higher is more boring)
Average Age (higher is more boring) <—Twice
% of Households With Kids (higher is more boring)
% of Households with People Over 65 (higher is more boring)< —Three times…serious?
Population density (lower is more boring)
————————————————-
Look, if you're gonna count age against any location, you might wanna consider, perhaps….ooohhhh, I don't know…how about putting some actual effort in spending the time to find out what people in these purportedly "boring" places actually *DO* for fun rather than baking up weak statistics about them, so, pretty-please, (with what ever kind of topping that blows your skirt up), stop being so douchey about it and give us something we can sink our teeth into. GhaAAahd….
Oh brother!!! Silly article! The top places listed are the best places to raise kids! The author must not have kids. Of course these wouldn’t be “fun” for singles.