
There’s no denying it: there are plenty of places in Missouri that are downright beautiful and full of excitement.
Unfortunately, not all towns and cities in Show Me State are so lucky.
Just like in all U.S. States, there are definitely some boring places within Missouri’s’ borders. You know the places where everyone has an AARP card and the most exciting thing they do all day is post a picture of their grandchild on Facebook.
Like Ladue, for instance. In our latest analysis, we found that this city was the most boring city in all of Oklahoma according to Saturday Night Science. But don’t feel bad if you’re a resident of Ladue. There are plenty of other boring, lackluster places in Missouri as well.
Here they are. Try not to jump out of your seat with excitement.
Table Of Contents: Top Ten | Methodology | Summary | Table
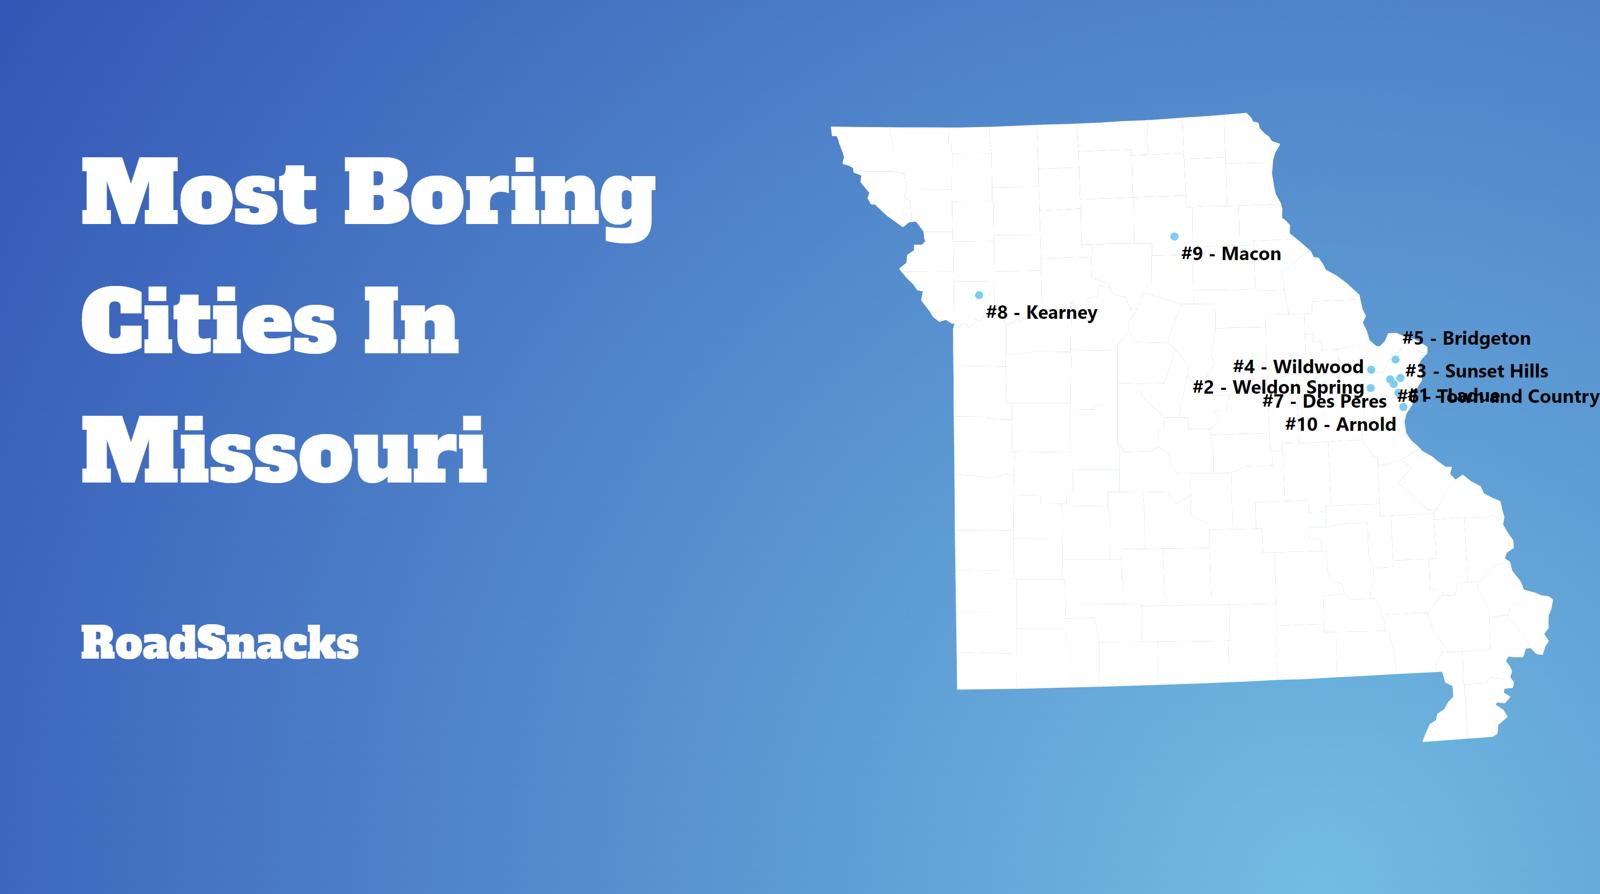
The 10 Most Boring Places In Missouri
Don’t freak out, in fact, believe it not, a boring city is actually one a lot of people would like to call home.
Before you get all upset if your city’s name is on the list, rest assured that we didn’t use personal opinion when it comes to what classifies a city or town as “boring” or “exciting”. We crunched actual numbers to figure out which towns are statistically more boring.
Showing this data to you is the kind of thing that a real estate agent knows, but would never share.
For more Missouri reading, check out:
The 10 Most Boring Places In Missouri For 2026

/10
Average Age: 50.1
% Married: 37.0%
More on Ladue: Data | Crime | Cost Of Living | Movers

/10
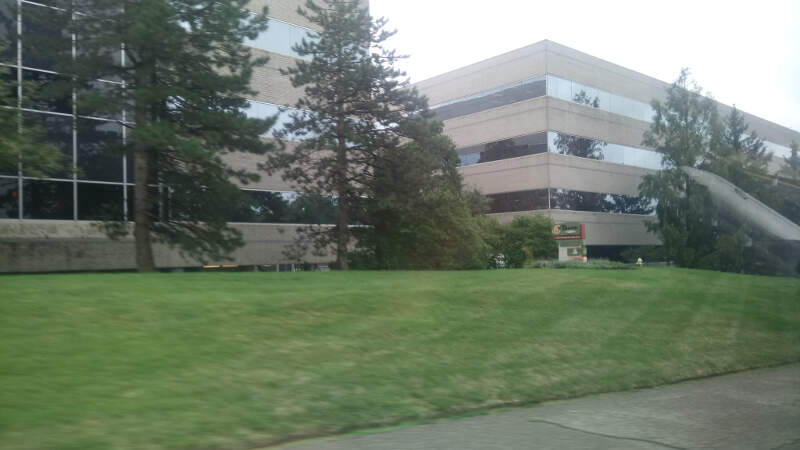
Average Age: 52.2
% Married: 45.0%
More on Weldon Spring: Data | Cost Of Living | Movers

/10
Average Age: 45.7
% Married: 32.0%
More on Wildwood: Data | Cost Of Living | Movers
/10

/10
Average Age: 51.1
% Married: 39.0%
More on Sunset Hills: Data | Crime | Cost Of Living | Movers

/10
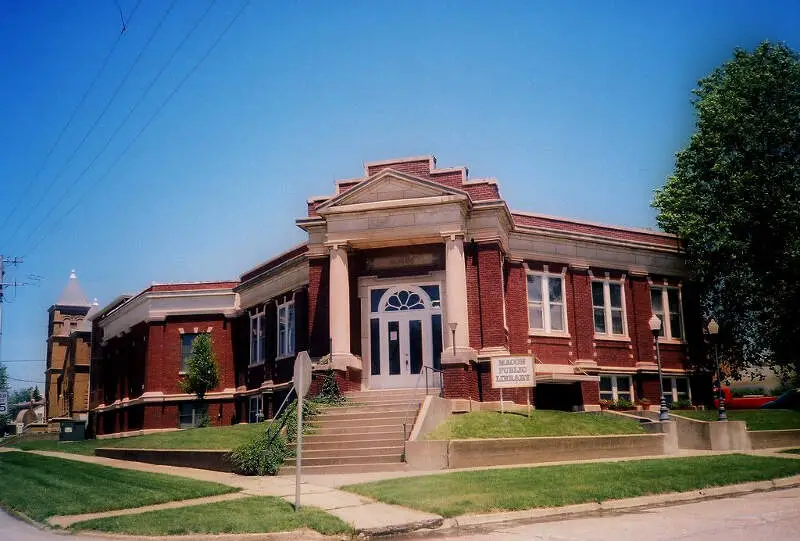
Average Age: 46.1
% Married: 31.0%
More on Macon: Data | Crime | Cost Of Living | Movers

/10
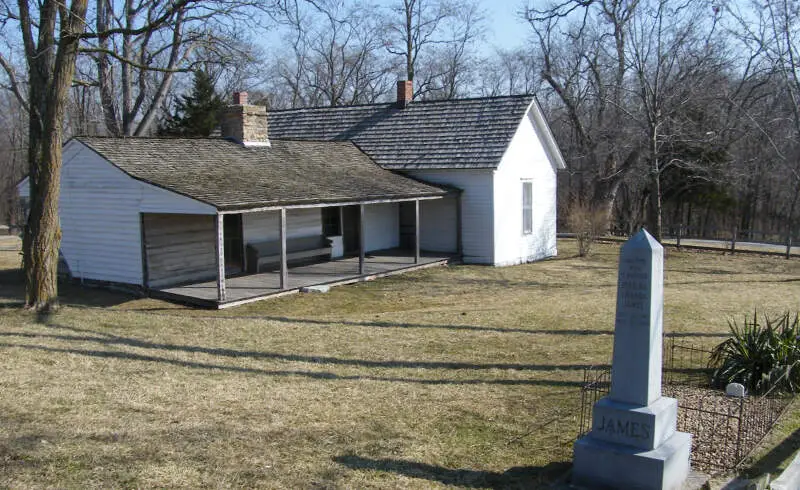
Average Age: 39.3
% Married: 32.0%
More on Kearney: Data | Crime | Cost Of Living | Movers
/10

/10
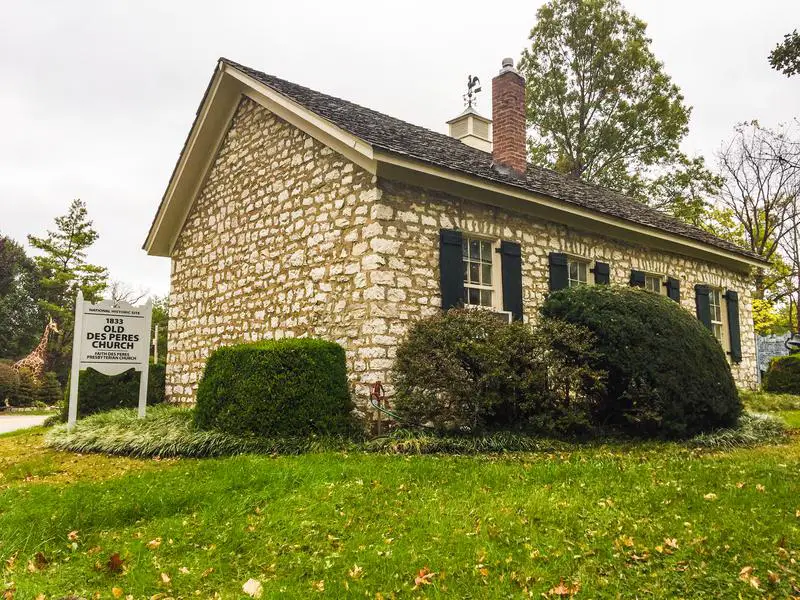
Average Age: 42.8
% Married: 50.0%
More on Des Peres: Data | Crime | Cost Of Living | Movers

/10
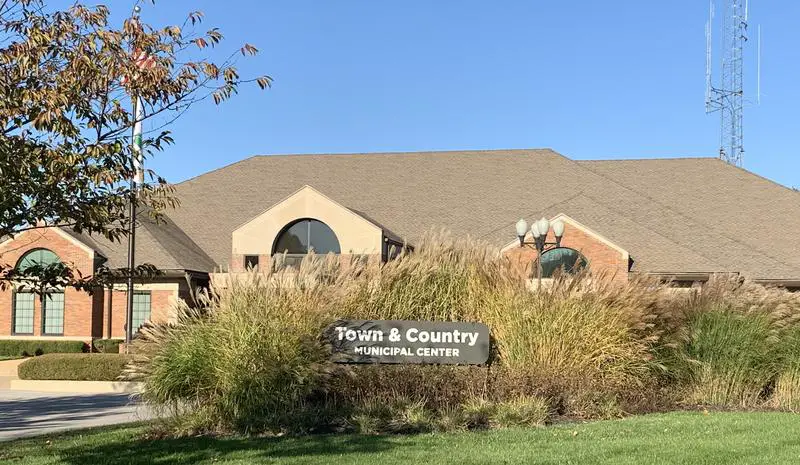
Average Age: 48.7
% Married: 28.0%
More on Town And Country: Data | Crime | Cost Of Living | Movers
Methodology: How we determined the boring cities in the Show Me State
You would present the following case to your friends if you were argueing with them at a bar about the most boring place to live in Missouri. And that’s why we call it Saturday Night Science.
Because our data speaks more truth than feelings.
To figure out how boring a place is, we factored in things we generally think make people exciting, and then we figure out which cities have the least number of those exciting people.
We used the U.S. American Community Census data to gather the information presented here. HSome of the things people tend to think of as making a city’s population boring include:
- % of Population Over 25 (higher is more boring)
- % of Married Household (higher is more boring)
- Average Age (higher is more boring)
- % of Households With Kids (higher is more boring)
- Population density (lower is more boring)
Then, our algorithm generates a ranking for each place in these categories. After crunching the numbers, all of the cities ranked from most boring to most exciting.
For this ranking, we used every Missouri city with at least 5,000 residents. This keeps us from prejudicing our rankings by including very small pockets of retired people.
Grab your rocker and hold on.
We updated this article for 2026, and it’s our eleventh time ranking the most boring cities in Missouri.
There You Have It – Now That You’re Asleep
On a ranking like this, there are usually no winners, but since Missouri isn’t necessarily the most boring state in the United States, the cities on this ranking can at least take solace that there are, in fact, more boring cities in the country.
The most boring cities in Missouri are Ladue, Weldon Spring, Wildwood, Herculaneum, Sunset Hills, Macon, Kearney, Ste. Genevieve, Des Peres, and Town and Country.
If you’re also curious enough, here are the most exciting places in Missouri, according to science:
- Maryville
- Clayton
- Warrensburg
For more Missouri reading, check out:
- Best Places To Live In Missouri
- Cheapest Places To Live In Missouri
- Most Dangerous Cities in Missouri
- Richest Cities In Missouri
- Safest Places In Missouri
- Worst Places To Live In Missouri
- Most Expensive Places To Live In Missouri
Detailed List Of The Most Boring Cities In Missouri For 2026
| Rank | City | Population | Average Age | % Married | % Kids |
|---|---|---|---|---|---|
| 1 | Ladue, MO | 8,940 | 50.1 | 37.0% | 34.9% |
| 2 | Weldon Spring, MO | 5,310 | 52.2 | 45.0% | 28.3% |
| 3 | Wildwood, MO | 35,133 | 45.7 | 32.0% | 34.2% |
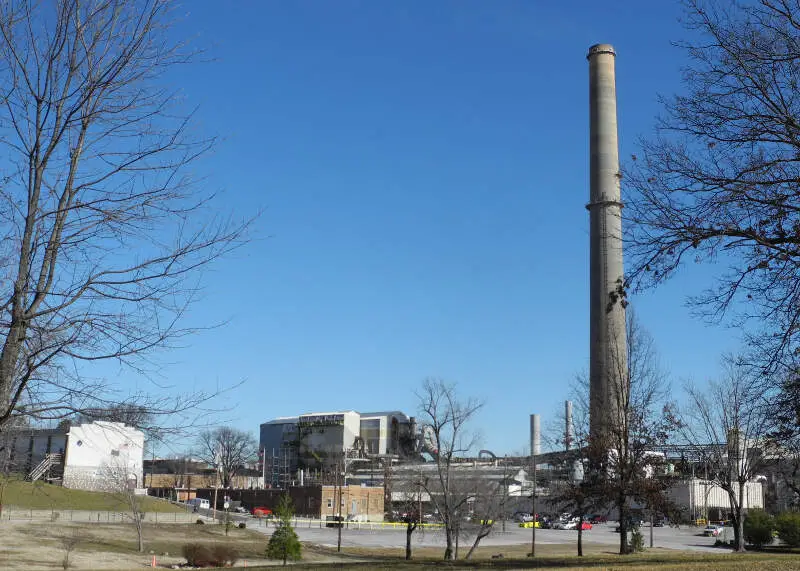
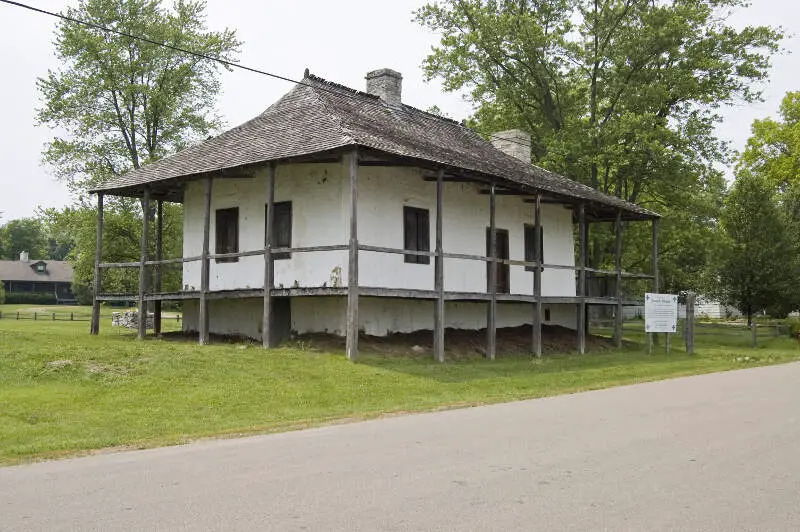
| 4 | Herculaneum, MO | 5,071 | 40.4 | 39.0% | 34.6% |
| 5 | Sunset Hills, MO | 9,112 | 51.1 | 39.0% | 27.6% |
| 6 | Macon, MO | 5,466 | 46.1 | 31.0% | 30.8% |
| 7 | Kearney, MO | 10,885 | 39.3 | 32.0% | 34.9% |
| 8 | Ste. Genevieve, MO | 5,010 | 44.6 | 35.0% | 27.0% |
| 9 | Des Peres, MO | 9,170 | 42.8 | 50.0% | 43.2% |
| 10 | Town And Country, MO | 11,607 | 48.7 | 28.0% | 29.7% |
| 11 | Bridgeton, MO | 11,369 | 40.9 | 26.0% | 34.3% |
| 12 | Washington, MO | 15,130 | 43.1 | 37.0% | 29.1% |
| 13 | Arnold, MO | 20,956 | 39.7 | 35.0% | 33.9% |
| 14 | Dardenne Prairie, MO | 13,503 | 42.9 | 37.0% | 40.3% |
| 15 | Raymore, MO | 24,526 | 41.1 | 31.0% | 34.5% |
| 16 | Clinton, MO | 9,065 | 44.2 | 29.0% | 28.5% |
| 17 | Richmond, MO | 5,959 | 40.1 | 30.0% | 29.6% |
| 18 | Smithville, MO | 10,705 | 37.4 | 30.0% | 40.3% |
| 19 | Parkville, MO | 8,366 | 39.4 | 29.0% | 40.7% |
| 20 | Moberly, MO | 13,526 | 39.4 | 29.0% | 33.9% |
| 21 | Crestwood, MO | 12,295 | 42.4 | 41.0% | 28.8% |
| 22 | Boonville, MO | 7,689 | 39.1 | 32.0% | 31.3% |
| 23 | Cottleville, MO | 5,937 | 41.1 | 35.0% | 29.7% |
| 24 | Sullivan, MO | 6,310 | 39.4 | 27.0% | 31.7% |
| 25 | Trenton, MO | 5,536 | 41.8 | 39.0% | 22.6% |
| 26 | Chesterfield, MO | 49,574 | 47.2 | 26.0% | 29.0% |
| 27 | Greenwood, MO | 6,013 | 41.2 | 26.0% | 34.2% |
| 28 | Eureka, MO | 13,081 | 37.5 | 31.0% | 40.2% |
| 29 | Black Jack, MO | 6,589 | 42.7 | 27.0% | 36.2% |
| 30 | Odessa, MO | 5,620 | 40.0 | 48.0% | 29.8% |
| 31 | Savannah, MO | 5,053 | 39.0 | 39.0% | 30.0% |
| 32 | Pacific, MO | 7,475 | 39.7 | 31.0% | 21.7% |
| 33 | Chillicothe, MO | 8,923 | 38.2 | 28.0% | 32.7% |
| 34 | Kirkwood, MO | 29,363 | 41.8 | 33.0% | 33.1% |
| 35 | O’fallon, MO | 93,801 | 38.4 | 33.0% | 36.8% |
| 36 | Lee’s Summit, MO | 103,656 | 38.8 | 30.0% | 34.7% |
| 37 | Aurora, MO | 7,397 | 43.2 | 27.0% | 26.6% |
| 38 | Lake St. Louis, MO | 18,066 | 42.7 | 32.0% | 28.4% |
| 39 | Ballwin, MO | 31,279 | 42.6 | 30.0% | 31.7% |
| 40 | Sikeston, MO | 16,320 | 38.2 | 30.0% | 31.5% |
| 41 | Battlefield, MO | 6,165 | 41.8 | 32.0% | 31.2% |
| 42 | Jackson, MO | 15,659 | 37.1 | 37.0% | 32.0% |
| 43 | Farmington, MO | 18,282 | 38.5 | 27.0% | 33.1% |
| 44 | Perryville, MO | 8,536 | 38.6 | 30.0% | 31.3% |
| 45 | Wentzville, MO | 47,061 | 36.5 | 36.0% | 44.6% |
| 46 | Ellisville, MO | 10,002 | 45.2 | 28.0% | 27.2% |
| 47 | St. Peters, MO | 59,092 | 41.0 | 34.0% | 26.8% |
| 48 | Harrisonville, MO | 9,970 | 37.2 | 28.0% | 34.4% |
| 49 | Cameron, MO | 8,519 | 40.1 | 24.0% | 28.6% |
| 50 | Troy, MO | 13,947 | 35.2 | 37.0% | 38.6% |
| 51 | Willard, MO | 6,488 | 32.2 | 33.0% | 42.6% |
| 52 | Festus, MO | 13,201 | 36.7 | 40.0% | 38.8% |
| 53 | Mexico, MO | 11,477 | 37.3 | 29.0% | 26.7% |
| 54 | Liberty, MO | 30,689 | 37.8 | 27.0% | 34.4% |
| 55 | Bonne Terre, MO | 6,683 | 39.0 | 30.0% | 22.4% |
| 56 | Shrewsbury, MO | 6,316 | 46.4 | 31.0% | 18.3% |
| 57 | Pleasant Hill, MO | 8,847 | 34.7 | 33.0% | 33.4% |
| 58 | Park Hills, MO | 8,678 | 33.0 | 32.0% | 32.0% |
| 59 | Excelsior Springs, MO | 10,484 | 35.9 | 29.0% | 32.2% |
| 60 | Union, MO | 12,781 | 33.3 | 31.0% | 36.5% |
| 61 | Belton, MO | 25,008 | 36.8 | 25.0% | 34.9% |
| 62 | Manchester, MO | 18,160 | 38.2 | 28.0% | 36.2% |
| 63 | Olivette, MO | 8,645 | 41.3 | 23.0% | 40.0% |
| 64 | Marshfield, MO | 7,696 | 36.0 | 36.0% | 32.8% |
| 65 | Blue Springs, MO | 59,965 | 37.2 | 31.0% | 36.8% |
| 66 | Warrenton, MO | 9,066 | 33.7 | 30.0% | 27.6% |
| 67 | Republic, MO | 19,829 | 33.2 | 30.0% | 35.1% |
| 68 | Glendale, MO | 6,114 | 38.8 | 36.0% | 39.5% |
| 69 | Dexter, MO | 7,891 | 38.5 | 28.0% | 30.8% |
| 70 | Oak Grove, MO | 8,538 | 32.6 | 36.0% | 32.5% |
| 71 | Pevely, MO | 6,055 | 33.2 | 35.0% | 34.5% |
| 72 | Nevada, MO | 7,925 | 39.1 | 23.0% | 23.4% |
| 73 | Kennett, MO | 10,196 | 41.4 | 24.0% | 28.4% |
| 74 | Bellefontaine Neighbors, MO | 10,498 | 41.9 | 24.0% | 32.5% |
| 75 | Waynesville, MO | 5,442 | 32.4 | 14.0% | 36.8% |
| 76 | Lebanon, MO | 15,270 | 37.4 | 19.0% | 33.3% |
| 77 | Peculiar, MO | 5,958 | 32.1 | 22.0% | 49.1% |
| 78 | Gladstone, MO | 27,207 | 41.9 | 22.0% | 26.6% |
| 79 | Creve Coeur, MO | 18,643 | 41.5 | 21.0% | 22.0% |
| 80 | Hannibal, MO | 16,771 | 38.5 | 26.0% | 28.3% |
| 81 | Nixa, MO | 24,836 | 37.3 | 26.0% | 41.8% |
| 82 | Valley Park, MO | 6,795 | 39.5 | 26.0% | 19.6% |
| 83 | Webster Groves, MO | 23,712 | 40.3 | 29.0% | 30.8% |
| 84 | West Plains, MO | 12,441 | 36.3 | 25.0% | 29.6% |
| 85 | Carl Junction, MO | 8,339 | 35.9 | 25.0% | 40.5% |
| 86 | Grain Valley, MO | 16,271 | 35.2 | 32.0% | 38.9% |
| 87 | Branson, MO | 12,817 | 39.3 | 14.0% | 20.1% |
| 88 | St. John, MO | 6,527 | 36.0 | 25.0% | 31.2% |
| 89 | Independence, MO | 121,740 | 39.0 | 23.0% | 26.4% |
| 90 | Poplar Bluff, MO | 16,254 | 37.3 | 24.0% | 27.2% |
| 91 | Monett, MO | 9,873 | 34.0 | 20.0% | 35.6% |
| 92 | Raytown, MO | 29,445 | 40.9 | 20.0% | 26.1% |
| 93 | St. Charles, MO | 71,508 | 38.6 | 27.0% | 24.9% |
| 94 | Neosho, MO | 13,224 | 33.0 | 18.0% | 34.3% |
| 95 | Ozark, MO | 22,417 | 33.8 | 21.0% | 45.8% |
| 96 | Maryland Heights, MO | 27,880 | 35.6 | 19.0% | 25.6% |
| 97 | De Soto, MO | 6,470 | 31.2 | 28.0% | 35.3% |
| 98 | Sedalia, MO | 22,003 | 37.3 | 25.0% | 29.2% |
| 99 | St. Robert, MO | 5,356 | 32.8 | 5.0% | 32.6% |
| 100 | Fulton, MO | 12,617 | 34.9 | 23.0% | 30.2% |
Your story is is bad, and you should feel bad.
How is Festus not number one? The heck?
My town didn’t show up on any of the list…..the 3 closest towns around me wasn’t on any of the list either…….
your algorithm is flawed, Branson is an entire town made for amusement and that’s pretty much all there is and Maryville is a tiny old boring town. Living in Springfield, I can tell you that we do not deserve 122, there’s nothing to do.
How is Maryville more interesting than Kansas City?