
There’s no denying it: there are plenty of places in New York that are downright beautiful and full of excitement.
Unfortunately, not all towns and cities in Empire State are so lucky.
Just like in all U.S. States, there are definitely some boring places within New York’s’ borders. You know the places where everyone has an AARP card and the most exciting thing they do all day is post a picture of their grandchild on Facebook.
Like East Aurora, for instance. In our latest analysis, we found that this city was the most boring city in all of Oklahoma according to Saturday Night Science. But don’t feel bad if you’re a resident of East Aurora. There are plenty of other boring, lackluster places in New York as well.
Here they are. Try not to jump out of your seat with excitement.
Table Of Contents: Top Ten | Methodology | Summary | Table
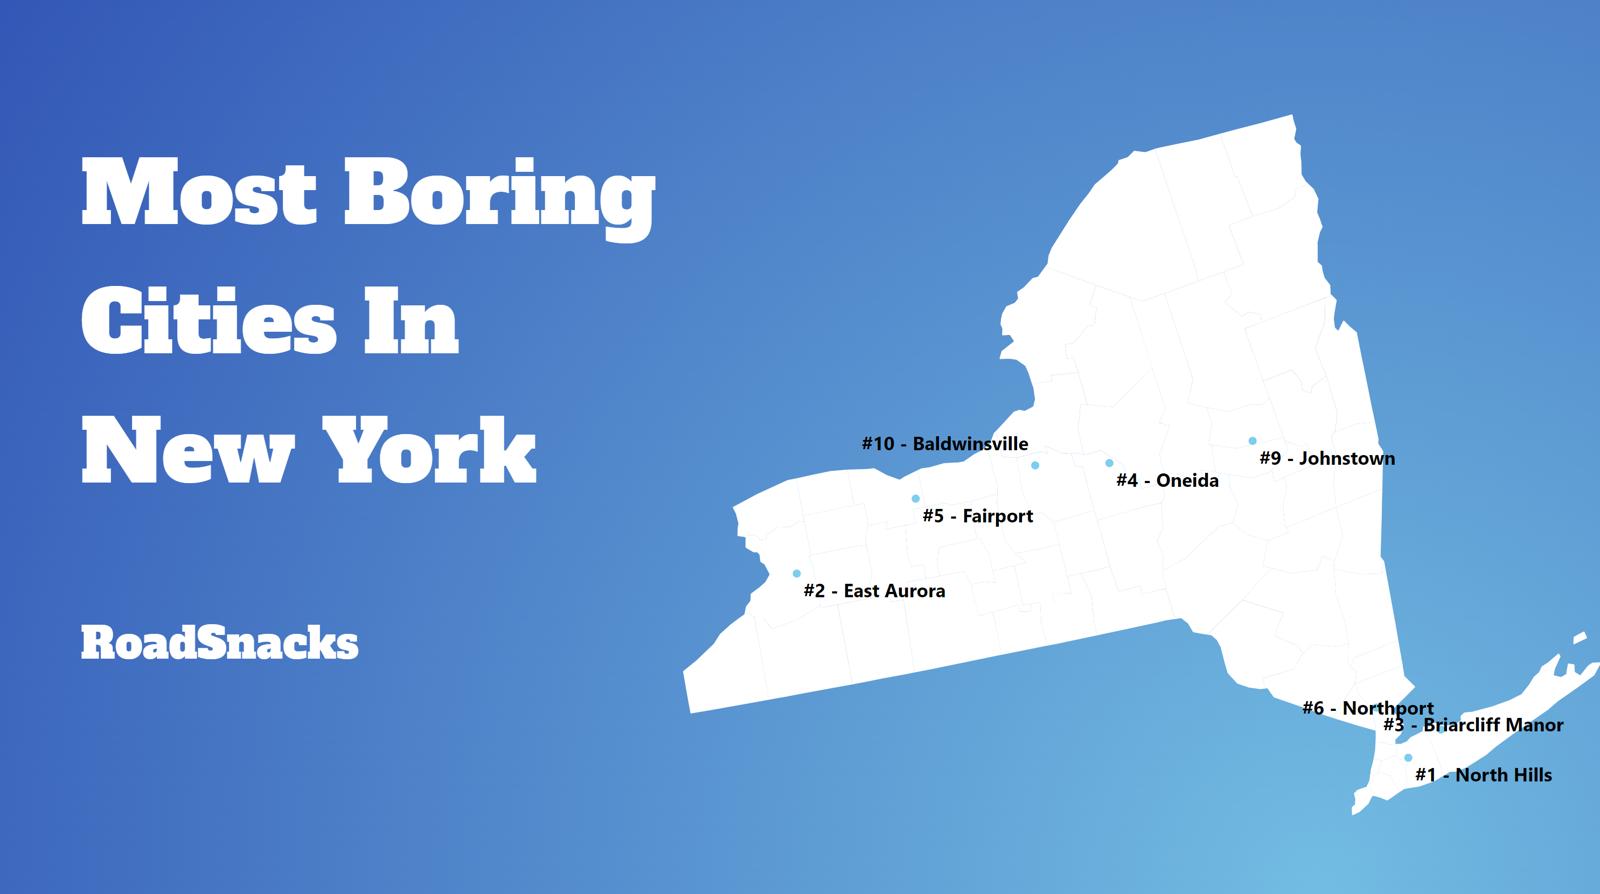
The 10 Most Boring Places In New York
Don’t freak out, in fact, believe it not, a boring city is actually one a lot of people would like to call home.
Before you get all upset if your city’s name is on the list, rest assured that we didn’t use personal opinion when it comes to what classifies a city or town as “boring” or “exciting”. We crunched actual numbers to figure out which towns are statistically more boring.
Showing this data to you is the kind of thing that a real estate agent knows, but would never share.
For more New York reading, check out:
The 10 Most Boring Places In New York For 2026

/10
Average Age: 50.4
% Married: 41.0%
More on East Aurora: Data | Cost Of Living | Movers
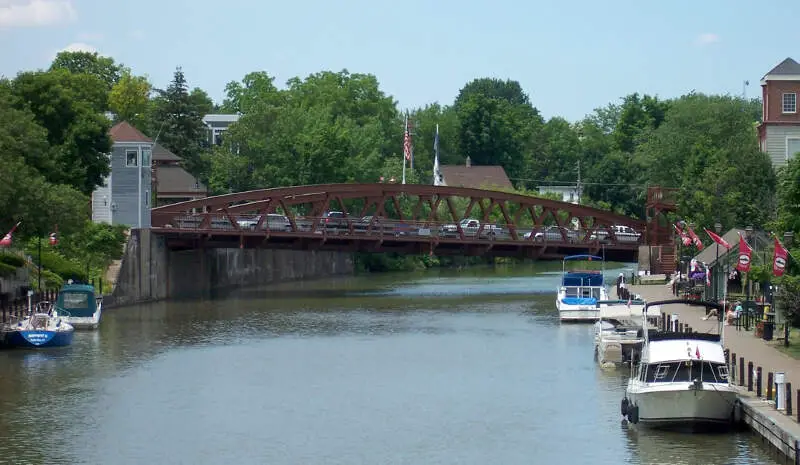
/10
Average Age: 45.5
% Married: 39.0%
More on Fairport: Data | Crime | Cost Of Living | Movers

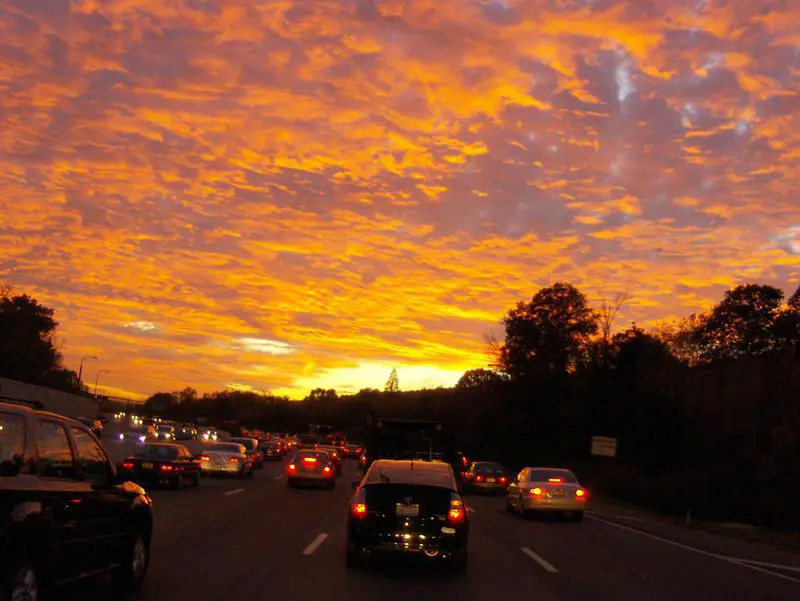
/10
Average Age: 61.3
% Married: 40.0%
More on North Hills: Data | Cost Of Living | Movers

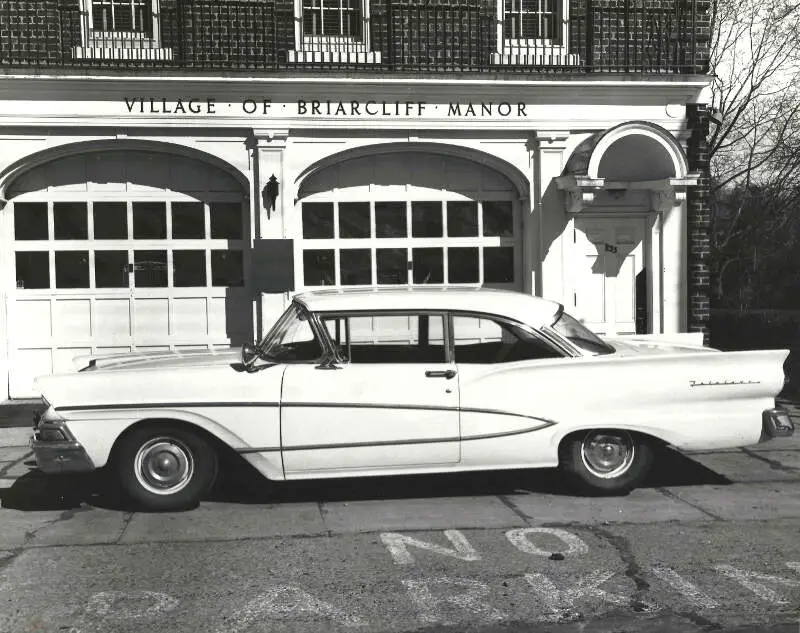
/10
Average Age: 47.7
% Married: 33.0%
More on Briarcliff Manor: Data | Crime | Cost Of Living | Movers

/10
Average Age: 47.0
% Married: 37.0%
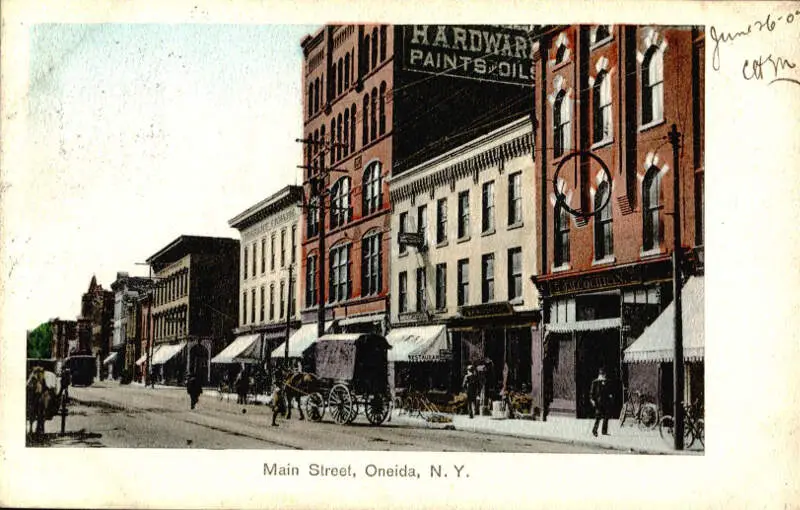
More on Oneida: Data | Crime | Cost Of Living | Movers

/10
Average Age: 51.9
% Married: 48.0%
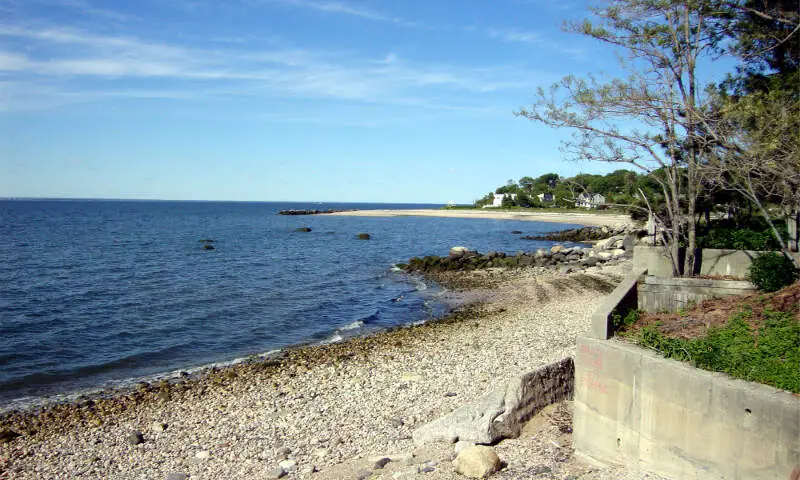
More on Bayville: Data | Cost Of Living | Movers

/10
Average Age: 42.5
% Married: 29.0%
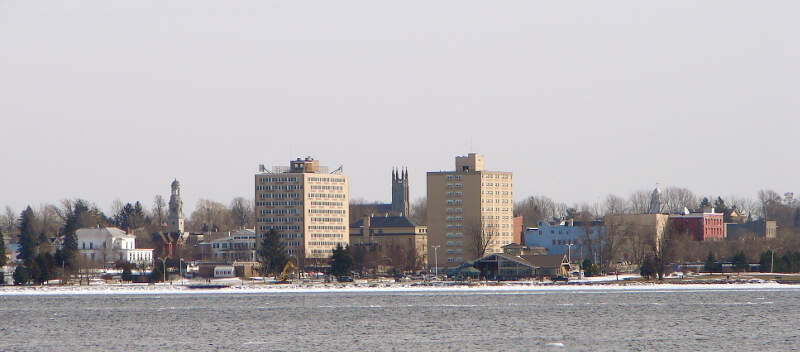
More on Ogdensburg: Data | Crime | Cost Of Living | Movers

/10
Average Age: 46.8
% Married: 27.0%
More on Goshen: Data | Crime | Cost Of Living | Movers

/10
Average Age: 43.4
% Married: 32.0%
More on Malone: Data | Crime | Cost Of Living | Movers

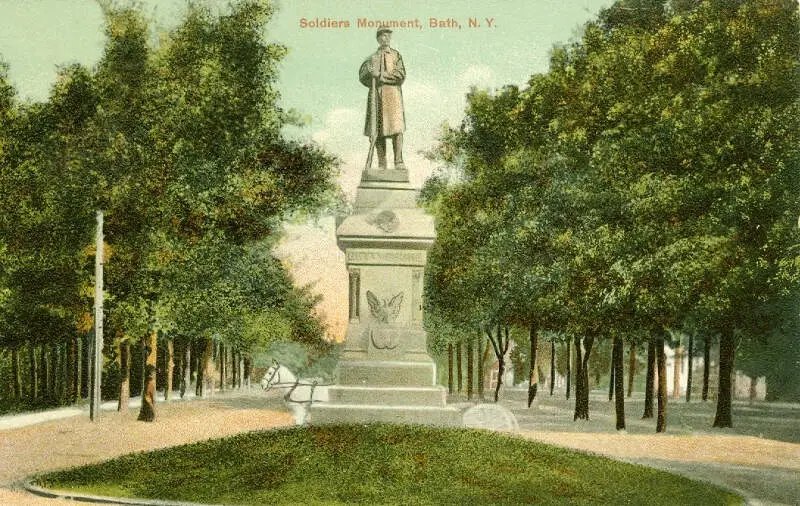
/10
Average Age: 49.6
% Married: 34.0%
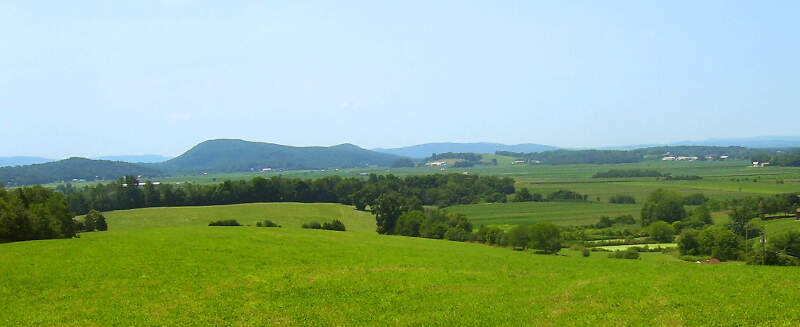
More on Bath: Data | Crime | Cost Of Living | Movers
Methodology: How we determined the boring cities in the Empire State
You would present the following case to your friends if you were argueing with them at a bar about the most boring place to live in New York. And that’s why we call it Saturday Night Science.
Because our data speaks more truth than feelings.
To figure out how boring a place is, we factored in things we generally think make people exciting, and then we figure out which cities have the least number of those exciting people.
We used the U.S. American Community Census data to gather the information presented here. HSome of the things people tend to think of as making a city’s population boring include:
- % of Population Over 25 (higher is more boring)
- % of Married Household (higher is more boring)
- Average Age (higher is more boring)
- % of Households With Kids (higher is more boring)
- Population density (lower is more boring)
Then, our algorithm generates a ranking for each place in these categories. After crunching the numbers, all of the cities ranked from most boring to most exciting.
For this ranking, we used every New York city with at least 5,000 residents. This keeps us from prejudicing our rankings by including very small pockets of retired people.
Grab your rocker and hold on.
We updated this article for 2026, and it’s our eleventh time ranking the most boring cities in New York.
There You Have It – Now That You’re Asleep
On a ranking like this, there are usually no winners, but since New York isn’t necessarily the most boring state in the United States, the cities on this ranking can at least take solace that there are, in fact, more boring cities in the country.
The most boring cities in New York are East Aurora, Fairport, North Hills, Briarcliff Manor, Oneida, Bayville, Ogdensburg, Goshen, Malone, and Bath.
If you’re also curious enough, here are the most exciting places in New York, according to science:
- Ithaca
- New Paltz
- Albany
For more New York reading, check out:
- Best Places To Live In New York
- Cheapest Places To Live In New York
- Most Dangerous Places In New York
- Richest Cities In New York
- Safest Places In New York According To Science
- Worst Places To Live In New York State
- Most Expensive Places To Live In New York
Detailed List Of The Most Boring Cities In New York For 2026
| Rank | City | Population | Average Age | % Married | % Kids |
|---|---|---|---|---|---|
| 1 | East Aurora, NY | 5,993 | 50.4 | 41.0% | 27.9% |
| 2 | Fairport, NY | 5,403 | 45.5 | 39.0% | 34.5% |
| 3 | North Hills, NY | 5,415 | 61.3 | 40.0% | 22.0% |
| 4 | Briarcliff Manor, NY | 7,519 | 47.7 | 33.0% | 36.8% |
| 5 | Oneida, NY | 10,171 | 47.0 | 37.0% | 23.4% |
| 6 | Bayville, NY | 6,744 | 51.9 | 48.0% | 26.3% |
| 7 | Ogdensburg, NY | 9,455 | 42.5 | 29.0% | 31.2% |
| 8 | Goshen, NY | 5,773 | 46.8 | 27.0% | 29.5% |
| 9 | Malone, NY | 5,429 | 43.4 | 32.0% | 26.0% |
| 10 | Bath, NY | 5,560 | 49.6 | 34.0% | 18.3% |
| 11 | Northport, NY | 7,322 | 51.6 | 38.0% | 21.7% |
| 12 | Croton-On-Hudson, NY | 8,202 | 46.3 | 29.0% | 34.0% |
| 13 | Baldwinsville, NY | 7,715 | 46.8 | 38.0% | 18.2% |
| 14 | Irvington, NY | 6,531 | 44.1 | 30.0% | 40.7% |
| 15 | Herkimer, NY | 7,566 | 45.4 | 39.0% | 24.1% |
| 16 | Warwick, NY | 6,585 | 51.4 | 33.0% | 21.8% |
| 17 | Hudson Falls, NY | 7,395 | 46.2 | 34.0% | 26.2% |
| 18 | North Tonawanda, NY | 30,198 | 43.1 | 39.0% | 22.4% |
| 19 | Babylon, NY | 12,185 | 45.5 | 43.0% | 27.3% |
| 20 | Washingtonville, NY | 5,707 | 41.2 | 36.0% | 31.6% |
| 21 | Malverne, NY | 8,477 | 45.3 | 45.0% | 28.8% |
| 22 | Williamsville, NY | 5,469 | 49.2 | 34.0% | 22.8% |
| 23 | Ballston Spa, NY | 5,027 | 42.7 | 38.0% | 27.8% |
| 24 | Johnstown, NY | 8,111 | 44.0 | 30.0% | 28.2% |
| 25 | Hamburg, NY | 9,792 | 44.3 | 41.0% | 23.9% |
| 26 | East Hills, NY | 7,257 | 40.7 | 53.0% | 47.7% |
| 27 | Lancaster, NY | 10,113 | 45.1 | 40.0% | 22.5% |
| 28 | Depew, NY | 15,000 | 43.4 | 38.0% | 21.6% |
| 29 | Massapequa Park, NY | 16,963 | 43.9 | 53.0% | 29.5% |
| 30 | Rye Brook, NY | 9,900 | 42.9 | 31.0% | 43.4% |
| 31 | Medina, NY | 5,770 | 39.2 | 32.0% | 29.3% |
| 32 | Horseheads, NY | 6,449 | 44.6 | 31.0% | 21.2% |
| 33 | Newark, NY | 8,991 | 41.1 | 36.0% | 24.0% |
| 34 | Rome, NY | 31,795 | 40.7 | 30.0% | 25.5% |
| 35 | Farmingdale, NY | 8,474 | 43.5 | 38.0% | 26.9% |
| 36 | Hastings-On-Hudson, NY | 8,434 | 46.3 | 30.0% | 30.9% |
| 37 | Saratoga Springs, NY | 28,631 | 42.4 | 29.0% | 21.1% |
| 38 | Beacon, NY | 14,834 | 42.0 | 24.0% | 29.3% |
| 39 | Massena, NY | 10,238 | 42.6 | 28.0% | 22.8% |
| 40 | Port Jefferson, NY | 8,091 | 45.0 | 28.0% | 22.6% |
| 41 | Rockville Centre, NY | 25,765 | 42.9 | 44.0% | 35.4% |
| 42 | Dunkirk, NY | 12,549 | 43.7 | 25.0% | 28.7% |
| 43 | Amityville, NY | 9,588 | 52.1 | 33.0% | 16.6% |
| 44 | Rye, NY | 16,428 | 42.5 | 25.0% | 46.1% |
| 45 | Pelham Manor, NY | 5,644 | 42.4 | 34.0% | 42.0% |
| 46 | Colonie, NY | 7,702 | 43.4 | 29.0% | 24.8% |
| 47 | Scarsdale, NY | 18,010 | 41.5 | 28.0% | 55.9% |
| 48 | Norwich, NY | 6,782 | 42.3 | 29.0% | 25.4% |
| 49 | Lynbrook, NY | 20,325 | 42.3 | 36.0% | 34.6% |
| 50 | Ilion, NY | 7,593 | 44.9 | 37.0% | 17.2% |
| 51 | Floral Park, NY | 16,169 | 43.5 | 38.0% | 35.5% |
| 52 | Westbury, NY | 15,808 | 44.5 | 25.0% | 35.2% |
| 53 | Sea Cliff, NY | 5,033 | 40.5 | 39.0% | 37.6% |
| 54 | Canandaigua, NY | 10,514 | 45.5 | 27.0% | 18.1% |
| 55 | Hornell, NY | 8,152 | 40.8 | 32.0% | 25.3% |
| 56 | Batavia, NY | 15,097 | 42.9 | 30.0% | 18.2% |
| 57 | Mount Kisco, NY | 10,737 | 40.9 | 26.0% | 29.1% |
| 58 | Chestnut Ridge, NY | 10,557 | 26.9 | 34.0% | 47.4% |
| 59 | Webster, NY | 5,718 | 38.4 | 29.0% | 21.0% |
| 60 | Glen Cove, NY | 28,112 | 44.0 | 23.0% | 24.9% |
| 61 | Scotia, NY | 7,264 | 39.1 | 33.0% | 31.8% |
| 62 | Auburn, NY | 26,285 | 41.1 | 27.0% | 25.3% |
| 63 | New Hyde Park, NY | 10,220 | 43.2 | 27.0% | 32.8% |
| 64 | Harrison, NY | 29,961 | 37.2 | 28.0% | 43.2% |
| 65 | Salamanca, NY | 5,846 | 38.8 | 25.0% | 33.5% |
| 66 | East Rockaway, NY | 10,077 | 41.5 | 38.0% | 31.5% |
| 67 | Wesley Hills, NY | 6,196 | 34.0 | 30.0% | 44.6% |
| 68 | Airmont, NY | 10,205 | 24.3 | 36.0% | 48.6% |
| 69 | Lake Grove, NY | 11,061 | 40.1 | 32.0% | 31.9% |
| 70 | Olean, NY | 13,738 | 39.0 | 26.0% | 29.4% |
| 71 | Mineola, NY | 21,211 | 41.6 | 28.0% | 28.2% |
| 72 | Lawrence, NY | 6,778 | 34.9 | 32.0% | 36.7% |
| 73 | Lockport, NY | 20,610 | 36.8 | 31.0% | 28.6% |
| 74 | Albion, NY | 5,506 | 41.4 | 23.0% | 23.9% |
| 75 | North Syracuse, NY | 6,693 | 39.6 | 29.0% | 22.0% |
| 76 | Hilton, NY | 5,968 | 35.4 | 38.0% | 38.0% |
| 77 | Long Beach, NY | 34,756 | 43.5 | 32.0% | 19.5% |
| 78 | Williston Park, NY | 7,542 | 40.5 | 36.0% | 37.3% |
| 79 | Solvay, NY | 6,544 | 38.9 | 29.0% | 27.1% |
| 80 | Dobbs Ferry, NY | 11,443 | 41.5 | 21.0% | 39.9% |
| 81 | Walden, NY | 6,868 | 37.0 | 32.0% | 33.1% |
| 82 | Wappingers Falls, NY | 5,761 | 49.8 | 22.0% | 21.4% |
| 83 | New Hempstead, NY | 5,472 | 32.0 | 28.0% | 41.5% |
| 84 | Lindenhurst, NY | 27,142 | 38.1 | 36.0% | 33.0% |
| 85 | Liberty, NY | 5,142 | 34.2 | 20.0% | 54.0% |
| 86 | Hudson, NY | 5,865 | 41.2 | 16.0% | 20.5% |
| 87 | Oswego, NY | 17,033 | 35.7 | 31.0% | 28.0% |
| 88 | Niagara Falls, NY | 47,987 | 40.8 | 26.0% | 25.3% |
| 89 | Larchmont, NY | 6,567 | 38.7 | 29.0% | 31.4% |
| 90 | East Rochester, NY | 6,218 | 40.1 | 33.0% | 17.9% |
| 91 | White Plains, NY | 60,666 | 41.5 | 20.0% | 25.7% |
| 92 | Sleepy Hollow, NY | 10,887 | 41.9 | 11.0% | 35.8% |
| 93 | Great Neck Plaza, NY | 7,593 | 46.8 | 19.0% | 22.2% |
| 94 | Patchogue, NY | 12,396 | 39.5 | 28.0% | 20.0% |
| 95 | Amsterdam, NY | 18,166 | 39.5 | 27.0% | 24.4% |
| 96 | Rensselaer, NY | 9,287 | 36.7 | 29.0% | 20.6% |
| 97 | Gloversville, NY | 14,962 | 38.0 | 29.0% | 25.5% |
| 98 | Pleasantville, NY | 7,371 | 38.7 | 26.0% | 36.0% |
| 99 | Kingston, NY | 23,911 | 37.2 | 21.0% | 27.8% |
| 100 | Valley Stream, NY | 40,315 | 40.9 | 18.0% | 37.2% |
So you’d rather live in Ithaca (#169) than the towns in Westchester that were at the top of the list? The “science” of this survey is in deep need of a gut check. None of the Westchester and Long Island towns themselves have enough to be exciting, but they all have something exciting (restaurants, culture, etc.) and all are minutes from one another and 30 minutes from Manhattan, both by rail and car. I’d rather be shot than live in Ithaca, which is essentially the North Pole without anything pretty to look at, and its 30 minutes from . . . nothing. Not too sure about the methodology here, but interesting enough for a very short-lived blog post, I guess. . . .
Briarcliff Manor is #1 and I would leave it at that. But if you prefer not to be part of a community, where everyone is on a first name basis, with a mix of old and young, where if you had an issue, the town would do its best to help you, in a place where all the parents are hands-on and very involved with their children – both generous of their time and with their money to give back, and your children go to nationwide top schools, then Briarcliff Manor is not for you…
I live in Croton and I completely agree that we should be on this list (I was surprised we weren’t #1), but that is a god awful picture! There are much nicer looking places (while still being boring) here, like the three way stop light in town or near the library or…pretty much most other streets.
I’d like to give Hastings on Hudson it’s due. Your algorithms are lacking in that they don’t take into account, mediocre, self centered, entitled, p.c. correct zombies, who’s entire existence revolves around their coddled children. The only thing thriving in Hastings’ ghostly downtown are it’s nail salons, perhaps the reason we slipped out of the top 5. The Mayor of Hastings Peter Swiderski, who’s visage and voice is a uninspiring as it gets, has put the entire village on a suicide watch. That’s no joke. It so mind numbling boring, they are fencing their iconic view from the Warburton bridge, to guard against suicides.
Can Briarcliff say that? I think not. Hastings was robbed!
Having lived in Yonkers, Dobbs Ferry, Tarrytown, Sleepy Hollow and now, Briarcliff Manor (in yo FACE, Hastings man!) I guess it was a good thing I skipped over Hastings, LOL.
The authors have obviously not spent time in Hastings on Hudson. As for boring, they clear Briarcliff in street shoes.
You also have to remember that those “least boring” places on the list are where significant number of colleges are located. Of course your going to find a higher percentage of young, single folks in these areas. They should have also excluded those areas that had bias towards population densities of young people who were college bound.
If you definition of boring is lowered likelihood of contracting an STD then I must concur with your findings.
Wow what an ignorant, self-centered, agist and small-minded way to define boring.
So the most interesting places to live are in SUNY college dorms? I imagine this criteria was created by a college student… or some millenial who doesn’t want to ever see anyone over 35 or under 18, and whose idea of interest is probably getting bombed every weekend.
The fact that this article is scientifically flawed in the most fundamental of manners (by using characteristics that have nothing to do with how boring a place is) is evident in the fact that Kiryas Joel, a Hasidic Jewish enclave in Monroe is less boring than White Plains. Smh
New York City is #147, beaten by Ithaca and New Paltz? Really? Methinks the logic in this list is completely flawed.
Albany is the LEAST boring town on the list. ‘Nuff said.
Love this. Grew up in Briarcliff Manor, moved to Irvington after college and marriage. Had major “culture shock” after being transferred to REALLY boring town in the central part of ,Virginia. Literally in the midst of no where, we are an hour away from any other town of any size. Four hours from DC, 6 hours from VA Beach, no interstate close by……but like Briarcliff, a great place to raise a family and have neighbors who care. Schools are good and all of my children have graduated from major Universities. Boring isn’t all that bad.
Can we get data for the other towns in NY? I would love to see the breakdown for all the places we’re considering moving to.
Thanks!
I was looking at the list of worse places to live in NY! How Utica didn’t make #1 is beyond me! It is the armpit of the universe! ( I could use some other words to describe Utica, but they are probably not printable on this site! Utica has NB absolutely nothing to offer to anyone in any way!!!
I’ve lived in Yonkers for 25 years and I have to agree it is plenty boring. It has delicious pizza and really good delis and food spots but it is pathetically boring. The police force is great at least that’s one thing going for us but the city itself is as dull as a bitter knife