
There’s no denying it: there are plenty of places in Oregon that are downright beautiful and full of excitement.
Unfortunately, not all towns and cities in Beaver State are so lucky.
Just like in all U.S. States, there are definitely some boring places within Oregon’s’ borders. You know the places where everyone has an AARP card and the most exciting thing they do all day is post a picture of their grandchild on Facebook.
Like Veneta, for instance. In our latest analysis, we found that this city was the most boring city in all of Oklahoma according to Saturday Night Science. But don’t feel bad if you’re a resident of Veneta. There are plenty of other boring, lackluster places in Oregon as well.
Here they are. Try not to jump out of your seat with excitement.
Table Of Contents: Top Ten | Methodology | Summary | Table
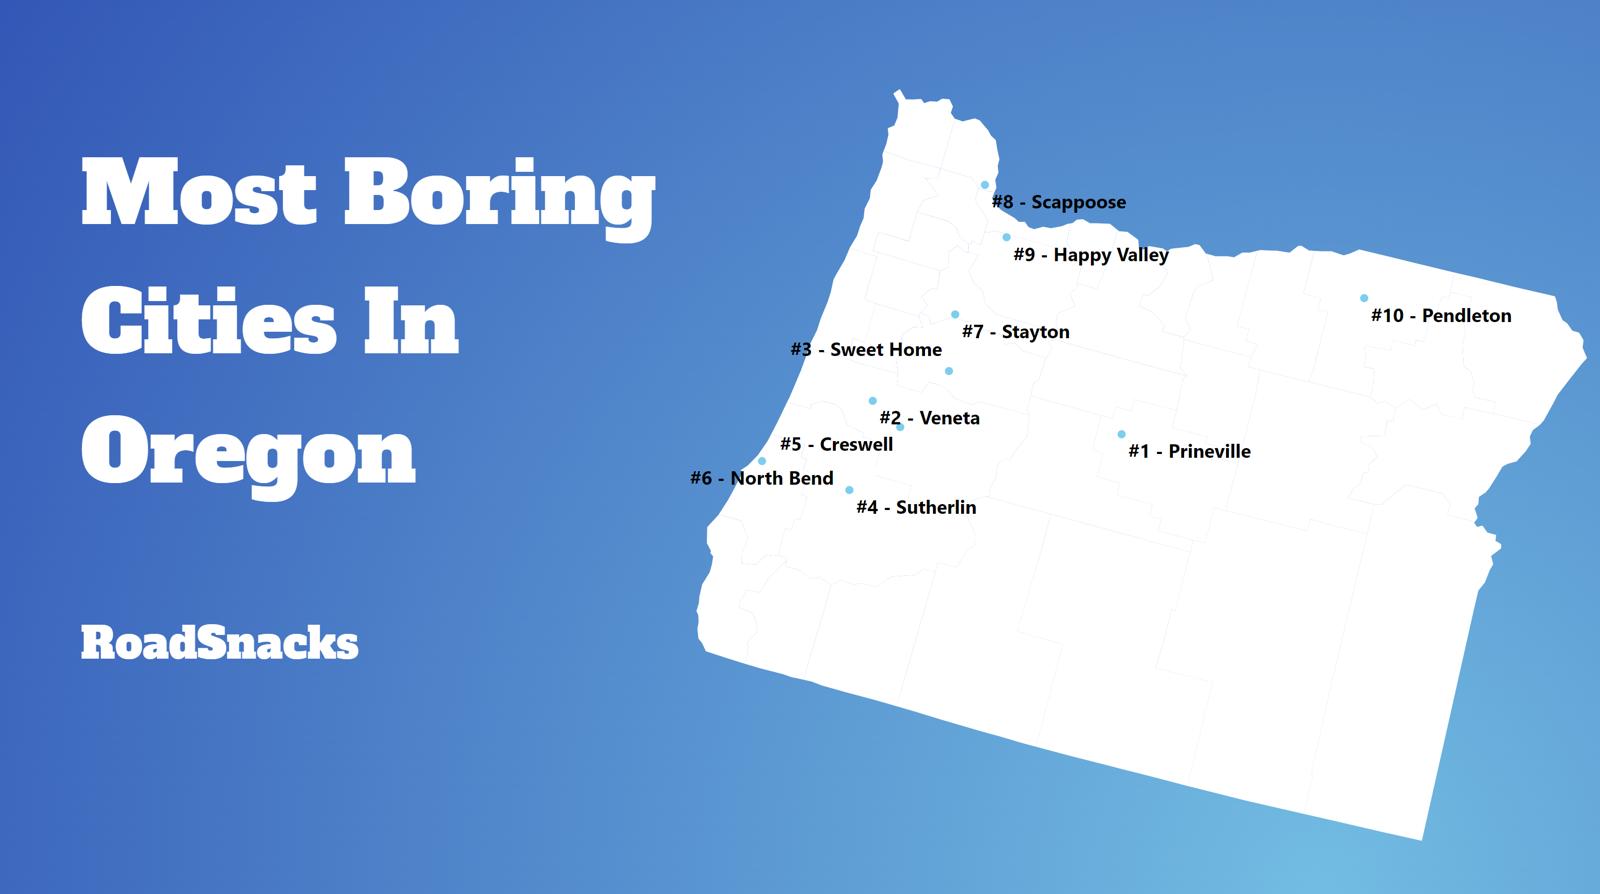
The 10 Most Boring Places In Oregon
Don’t freak out, in fact, believe it not, a boring city is actually one a lot of people would like to call home.
Before you get all upset if your city’s name is on the list, rest assured that we didn’t use personal opinion when it comes to what classifies a city or town as “boring” or “exciting”. We crunched actual numbers to figure out which towns are statistically more boring.
Showing this data to you is the kind of thing that a real estate agent knows, but would never share.
For more Oregon reading, check out:
The 10 Most Boring Places In Oregon For 2026
/10

/10
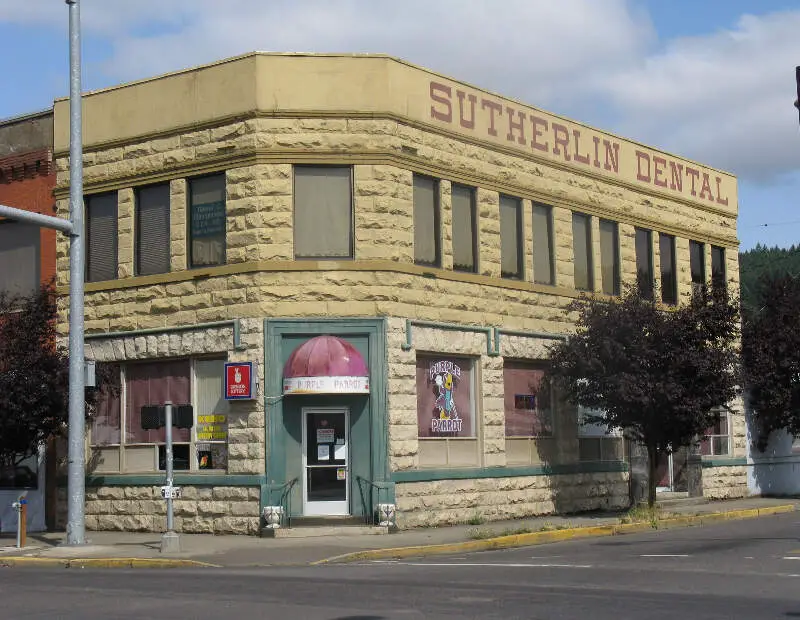
Average Age: 47.4
% Married: 21.0%
More on Sutherlin: Data | Crime | Cost Of Living | Movers

/10
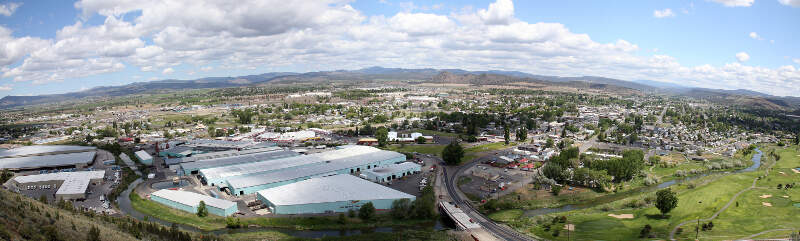
Average Age: 38.4
% Married: 22.0%
More on Prineville: Data | Crime | Cost Of Living | Movers

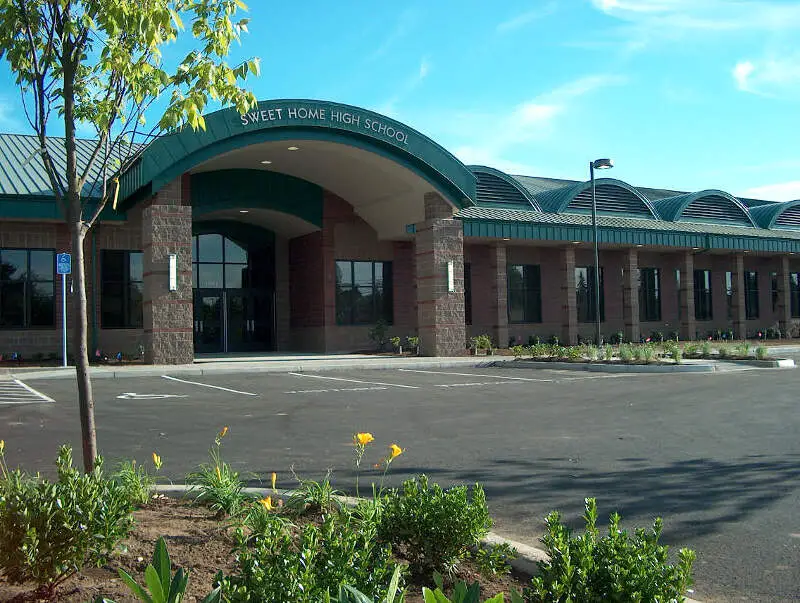
/10
Average Age: 42.4
% Married: 23.0%
More on Sweet Home: Data | Crime | Cost Of Living | Movers
/10

/10
Average Age: 39.8
% Married: 20.0%
More on St. Helens: Data | Crime | Cost Of Living | Movers


/10
Average Age: 38.3
% Married: 30.0%
More on Stayton: Data | Crime | Cost Of Living | Movers

/10
Average Age: 40.3
% Married: 33.0%
More on Scappoose: Data | Crime | Cost Of Living | Movers
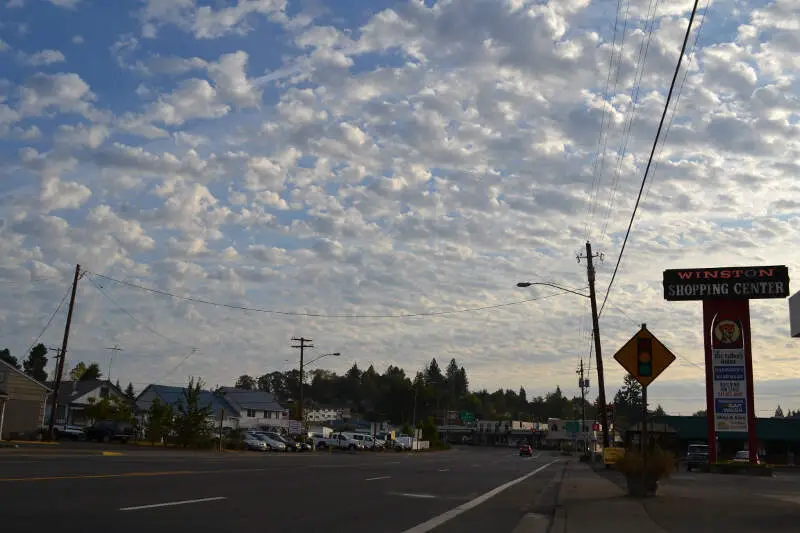
/10
Average Age: 46.4
% Married: 18.0%
More on Winston: Data | Crime | Cost Of Living | Movers
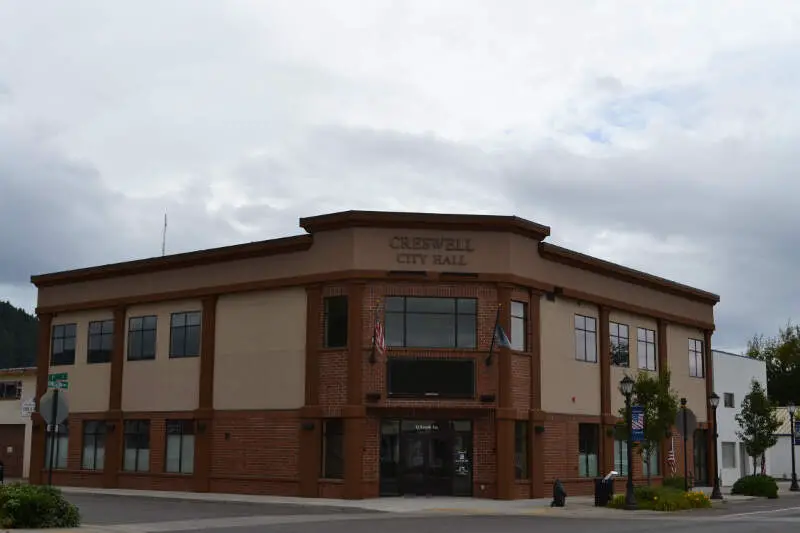
/10
Average Age: 37.2
% Married: 31.0%
More on Creswell: Data | Cost Of Living | Movers
Methodology: How we determined the boring cities in the Beaver State
You would present the following case to your friends if you were argueing with them at a bar about the most boring place to live in Oregon. And that’s why we call it Saturday Night Science.
Because our data speaks more truth than feelings.
To figure out how boring a place is, we factored in things we generally think make people exciting, and then we figure out which cities have the least number of those exciting people.
We used the U.S. American Community Census data to gather the information presented here. HSome of the things people tend to think of as making a city’s population boring include:
- % of Population Over 25 (higher is more boring)
- % of Married Household (higher is more boring)
- Average Age (higher is more boring)
- % of Households With Kids (higher is more boring)
- Population density (lower is more boring)
Then, our algorithm generates a ranking for each place in these categories. After crunching the numbers, all of the cities ranked from most boring to most exciting.
For this ranking, we used every Oregon city with at least 5,000 residents. This keeps us from prejudicing our rankings by including very small pockets of retired people.
Grab your rocker and hold on.
We updated this article for 2026, and it’s our eleventh time ranking the most boring cities in Oregon.
There You Have It – Now That You’re Asleep
On a ranking like this, there are usually no winners, but since Oregon isn’t necessarily the most boring state in the United States, the cities on this ranking can at least take solace that there are, in fact, more boring cities in the country.
The most boring cities in Oregon are Veneta, Sutherlin, Prineville, Sweet Home, Estacada, St. Helens, Stayton, Scappoose, Winston, and Creswell.
If you’re also curious enough, here are the most exciting places in Oregon, according to science:
- Corvallis
- Monmouth
- Eugene
For more Oregon reading, check out:
- Best Places To Live In Oregon
- Cheapest Places To Live In Oregon
- Most Dangerous Cities In Oregon
- Richest Cities In Oregon
- Safest Places In Oregon
- Worst Places To Live In Oregon
- Most Expensive Places To Live In Oregon
Detailed List Of The Most Boring Cities In Oregon For 2026
| Rank | City | Population | Average Age | % Married | % Kids |
|---|---|---|---|---|---|
| 1 | Veneta, OR | 5,200 | 41.0 | 22.0% | 36.9% |
| 2 | Sutherlin, OR | 8,599 | 47.4 | 21.0% | 20.9% |
| 3 | Prineville, OR | 11,470 | 38.4 | 22.0% | 34.1% |
| 4 | Sweet Home, OR | 10,078 | 42.4 | 23.0% | 24.8% |
| 5 | Estacada, OR | 5,152 | 36.8 | 29.0% | 32.2% |
| 6 | St. Helens, OR | 14,258 | 39.8 | 20.0% | 35.6% |
| 7 | Stayton, OR | 8,292 | 38.3 | 30.0% | 38.0% |
| 8 | Scappoose, OR | 8,179 | 40.3 | 33.0% | 30.0% |
| 9 | Winston, OR | 5,690 | 46.4 | 18.0% | 26.4% |
| 10 | Creswell, OR | 5,621 | 37.2 | 31.0% | 41.0% |
| 11 | Warrenton, OR | 6,327 | 39.3 | 18.0% | 27.7% |
| 12 | Canby, OR | 18,134 | 43.0 | 27.0% | 31.5% |
| 13 | Brookings, OR | 6,703 | 50.6 | 6.0% | 28.6% |
| 14 | Happy Valley, OR | 26,738 | 39.0 | 17.0% | 39.9% |
| 15 | North Bend, OR | 10,171 | 43.4 | 17.0% | 28.3% |
| 16 | Silverton, OR | 10,456 | 38.5 | 21.0% | 36.9% |
| 17 | West Linn, OR | 26,935 | 43.3 | 16.0% | 37.0% |
| 18 | Seaside, OR | 7,192 | 51.2 | 13.0% | 15.1% |
| 19 | Florence, OR | 9,482 | 60.8 | 11.0% | 14.5% |
| 20 | Newport, OR | 10,583 | 51.3 | 9.0% | 18.8% |
| 21 | Pendleton, OR | 16,950 | 36.9 | 20.0% | 36.1% |
| 22 | Coos Bay, OR | 15,925 | 44.1 | 14.0% | 20.9% |
| 23 | Central Point, OR | 19,216 | 41.7 | 20.0% | 31.9% |
| 24 | Roseburg, OR | 23,778 | 39.6 | 15.0% | 28.6% |
| 25 | Lake Oswego, OR | 40,381 | 46.7 | 14.0% | 30.7% |
| 26 | Redmond, OR | 36,092 | 36.2 | 19.0% | 33.0% |
| 27 | Troutdale, OR | 15,923 | 38.1 | 21.0% | 33.2% |
| 28 | Dallas, OR | 17,531 | 40.9 | 22.0% | 28.6% |
| 29 | Eagle Point, OR | 9,839 | 37.7 | 22.0% | 31.6% |
| 30 | Astoria, OR | 10,109 | 40.3 | 13.0% | 20.0% |
| 31 | Gladstone, OR | 11,977 | 44.8 | 21.0% | 23.4% |
| 32 | Grants Pass, OR | 39,311 | 40.8 | 14.0% | 34.4% |
| 33 | Milwaukie, OR | 21,392 | 41.3 | 19.0% | 25.1% |
| 34 | Cottage Grove, OR | 10,698 | 38.9 | 19.0% | 31.9% |
| 35 | Albany, OR | 56,839 | 37.7 | 21.0% | 32.2% |
| 36 | Bend, OR | 103,390 | 40.9 | 11.0% | 26.9% |
| 37 | Tigard, OR | 56,011 | 39.4 | 17.0% | 30.6% |
| 38 | Sandy, OR | 12,854 | 34.8 | 27.0% | 39.2% |
| 39 | Lebanon, OR | 19,344 | 37.2 | 20.0% | 24.9% |
| 40 | Umatilla, OR | 7,508 | 35.6 | 10.0% | 38.3% |
| 41 | Wilsonville, OR | 26,974 | 37.7 | 15.0% | 29.0% |
| 42 | Sheridan, OR | 6,339 | 39.6 | 13.0% | 26.8% |
| 43 | Medford, OR | 86,315 | 38.9 | 15.0% | 30.6% |
| 44 | Madras, OR | 7,676 | 32.6 | 15.0% | 44.4% |
| 45 | The Dalles, OR | 15,917 | 38.5 | 16.0% | 24.1% |
| 46 | Molalla, OR | 10,186 | 32.2 | 28.0% | 42.3% |
| 47 | Hood River, OR | 8,361 | 38.2 | 11.0% | 30.7% |
| 48 | Keizer, OR | 39,082 | 37.4 | 22.0% | 32.1% |
| 49 | Ashland, OR | 21,259 | 47.7 | 6.0% | 15.2% |
| 50 | Tualatin, OR | 27,763 | 37.4 | 15.0% | 31.0% |
| 51 | Tillamook, OR | 5,218 | 37.0 | 16.0% | 34.7% |
| 52 | Fairview, OR | 10,735 | 37.4 | 14.0% | 23.0% |
| 53 | Sherwood, OR | 20,307 | 36.7 | 19.0% | 45.4% |
| 54 | Klamath Falls, OR | 22,115 | 35.2 | 15.0% | 28.9% |
| 55 | Mcminnville, OR | 34,596 | 38.9 | 15.0% | 29.9% |
| 56 | Springfield, OR | 61,499 | 37.4 | 17.0% | 30.6% |
| 57 | Hermiston, OR | 19,546 | 30.9 | 13.0% | 48.1% |
| 58 | Philomath, OR | 5,642 | 37.3 | 16.0% | 22.6% |
| 59 | Gresham, OR | 112,378 | 37.0 | 17.0% | 32.6% |
| 60 | Salem, OR | 178,865 | 36.0 | 15.0% | 31.8% |
| 61 | Ontario, OR | 11,842 | 35.2 | 14.0% | 30.9% |
| 62 | Portland, OR | 641,165 | 38.8 | 9.0% | 22.0% |
| 63 | Independence, OR | 10,199 | 30.7 | 17.0% | 33.3% |
| 64 | La Grande, OR | 13,058 | 32.9 | 22.0% | 23.1% |
| 65 | Beaverton, OR | 97,812 | 37.8 | 11.0% | 27.5% |
| 66 | Talent, OR | 6,254 | 41.3 | 10.0% | 19.5% |
| 67 | Forest Grove, OR | 26,529 | 34.0 | 16.0% | 33.9% |
| 68 | Woodburn, OR | 27,875 | 38.6 | 9.0% | 32.3% |
| 69 | Hillsboro, OR | 108,231 | 35.0 | 11.0% | 29.5% |
| 70 | Milton-Freewater, OR | 7,036 | 32.9 | 6.0% | 40.9% |
| 71 | Newberg, OR | 26,066 | 34.8 | 16.0% | 30.6% |
| 72 | Cornelius, OR | 14,255 | 35.1 | 11.0% | 33.1% |
| 73 | Eugene, OR | 179,591 | 35.2 | 11.0% | 21.1% |
| 74 | Monmouth, OR | 11,428 | 27.1 | 13.0% | 29.0% |
| 75 | Corvallis, OR | 59,960 | 27.9 | 7.0% | 19.6% |
I have lived in many cities and have not found any as boring as Roseburg! Many businesses have a four day week including doctors.
I prefer “boring” any day over places full of illegal aliens, protesters, drunk college “kids” and noise. Give me Oakridge any time..or any of the 10 most “boring” you list.
Knappa oregon is boring as heck man.