
There’s no denying it: there are plenty of places in Tennessee that are downright beautiful and full of excitement.
Unfortunately, not all towns and cities in Volunteer State are so lucky.
Just like in all U.S. States, there are definitely some boring places within Tennessee’s’ borders. You know the places where everyone has an AARP card and the most exciting thing they do all day is post a picture of their grandchild on Facebook.
Like Pleasant View, for instance. In our latest analysis, we found that this city was the most boring city in all of Oklahoma according to Saturday Night Science. But don’t feel bad if you’re a resident of Pleasant View. There are plenty of other boring, lackluster places in Tennessee as well.
Here they are. Try not to jump out of your seat with excitement.
Table Of Contents: Top Ten | Methodology | Summary | Table
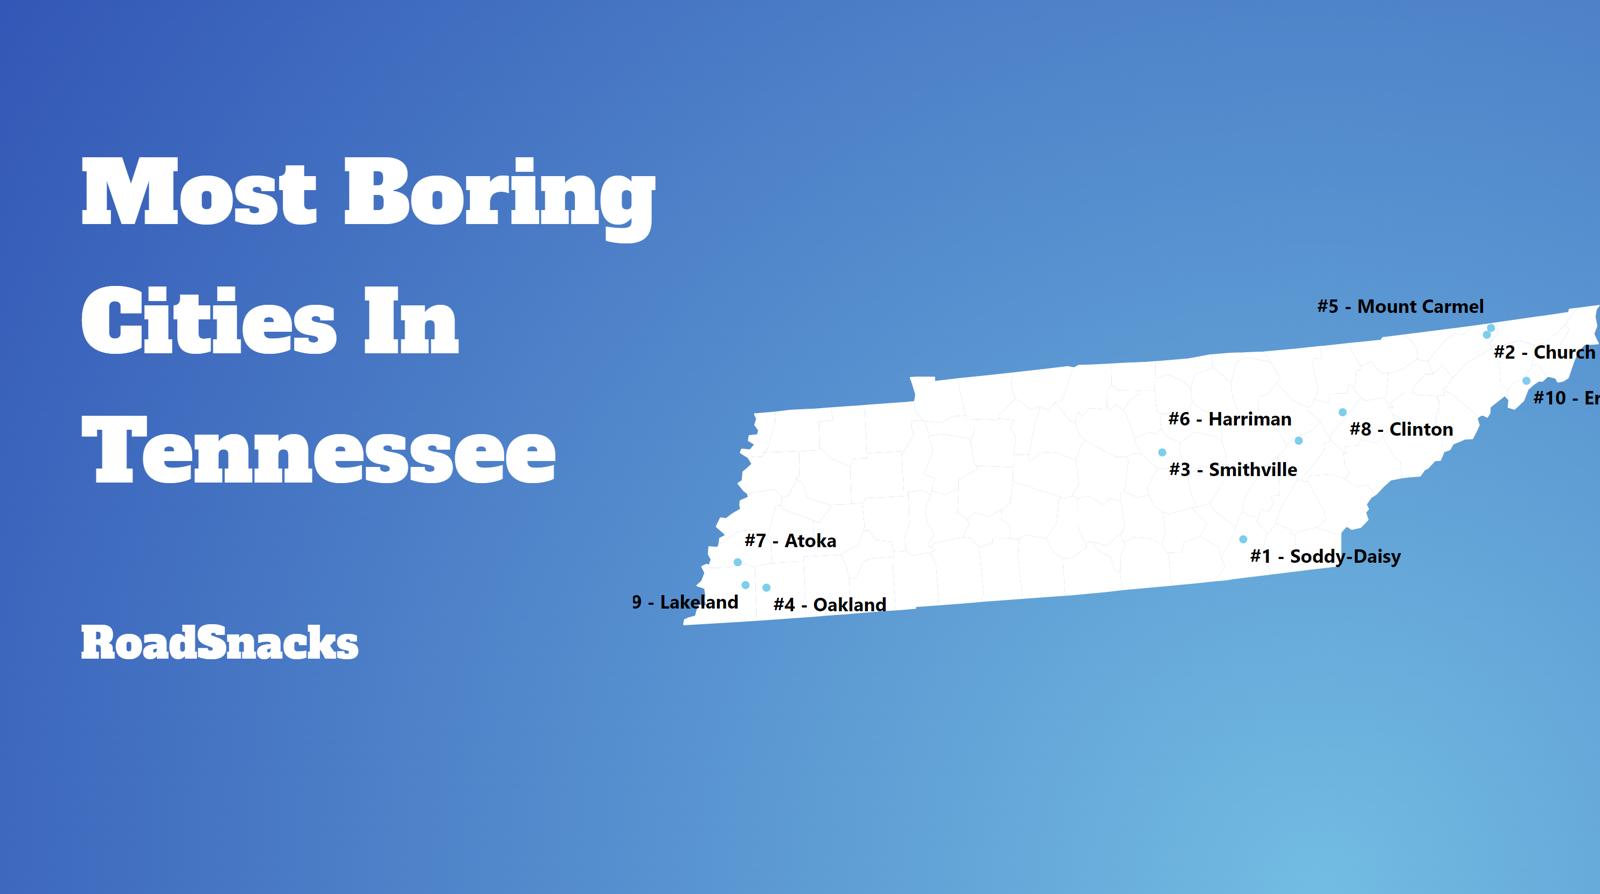
The 10 Most Boring Places In Tennessee
Don’t freak out, in fact, believe it not, a boring city is actually one a lot of people would like to call home.
Before you get all upset if your city’s name is on the list, rest assured that we didn’t use personal opinion when it comes to what classifies a city or town as “boring” or “exciting”. We crunched actual numbers to figure out which towns are statistically more boring.
Showing this data to you is the kind of thing that a real estate agent knows, but would never share.
For more Tennessee reading, check out:
The 10 Most Boring Places In Tennessee For 2026
/10

/10
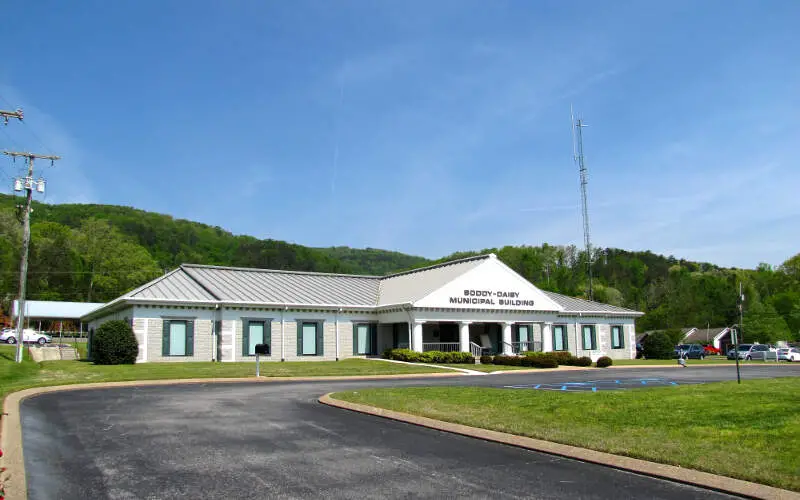
Average Age: 45.6
% Married: 31.0%
More on Soddy-Daisy: Data | Crime | Cost Of Living | Movers

/10
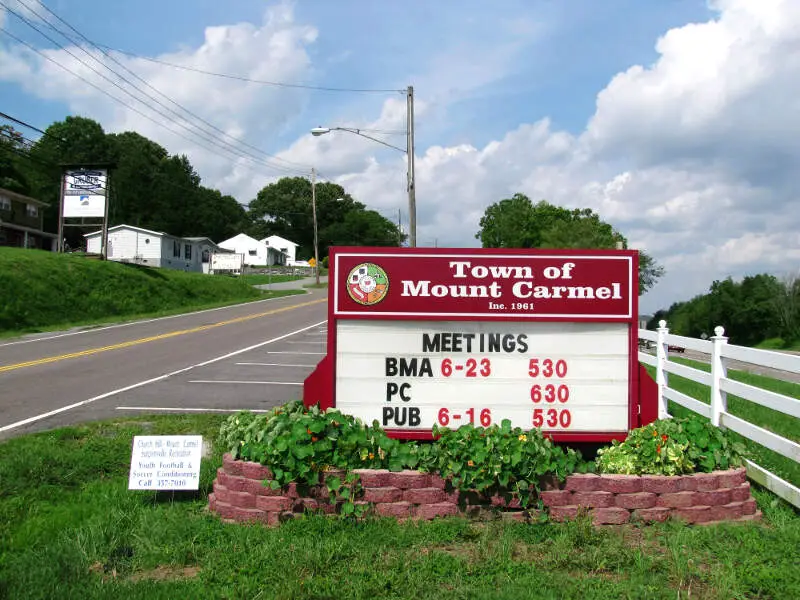
Average Age: 47.2
% Married: 36.0%
More on Mount Carmel: Data | Crime | Cost Of Living | Movers

/10
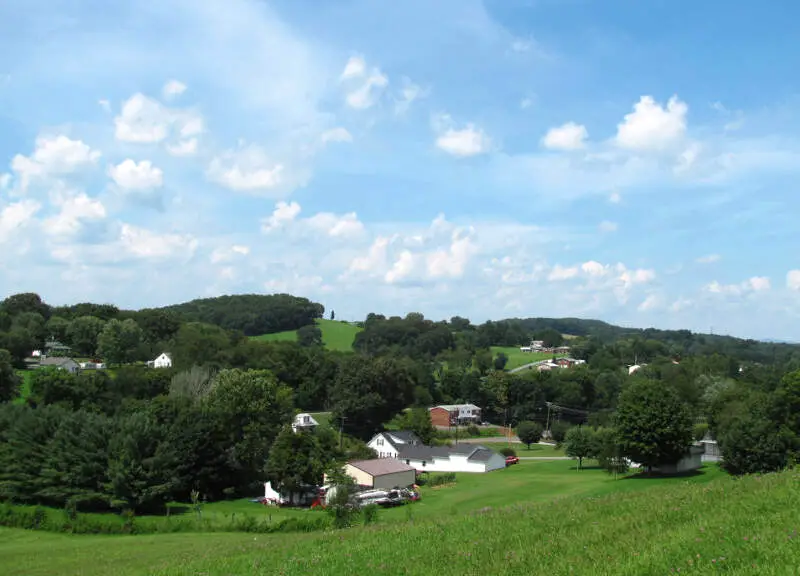
Average Age: 44.6
% Married: 38.0%
More on Church Hill: Data | Crime | Cost Of Living | Movers

/10
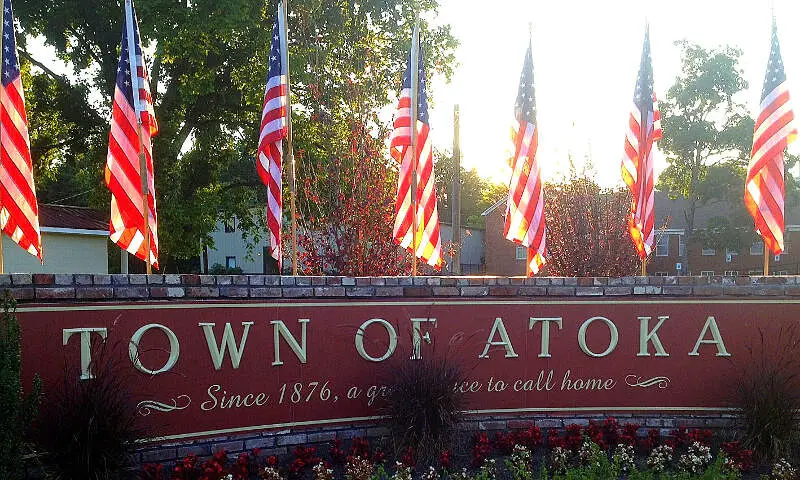
Average Age: 39.1
% Married: 29.0%
More on Atoka: Data | Crime | Cost Of Living | Movers
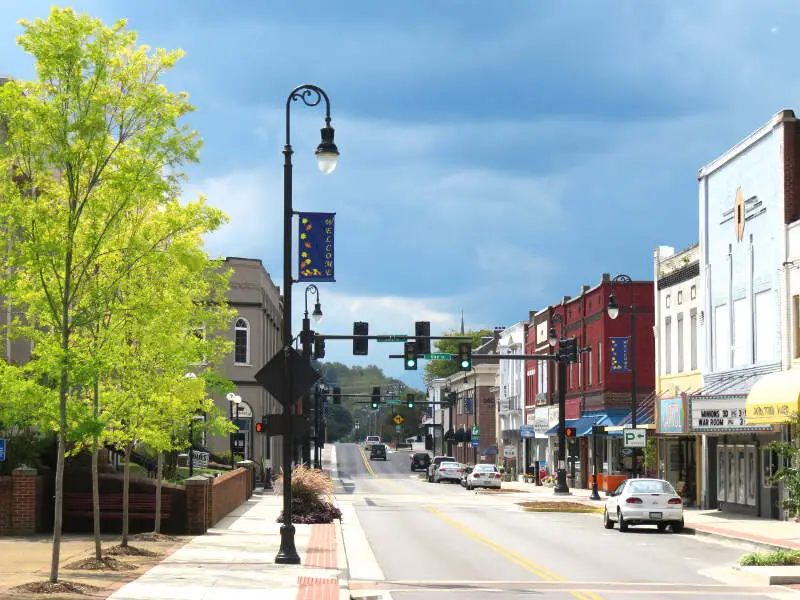
6. Smithville
/10


/10
Average Age: 40.3
% Married: 25.0%
More on Oakland: Data | Crime | Cost Of Living | Movers

/10
Average Age: 40.8
% Married: 24.0%
More on Millersville: Data | Crime | Cost Of Living | Movers

/10
Average Age: 44.3
% Married: 32.0%
More on Erwin: Data | Crime | Cost Of Living | Movers

/10
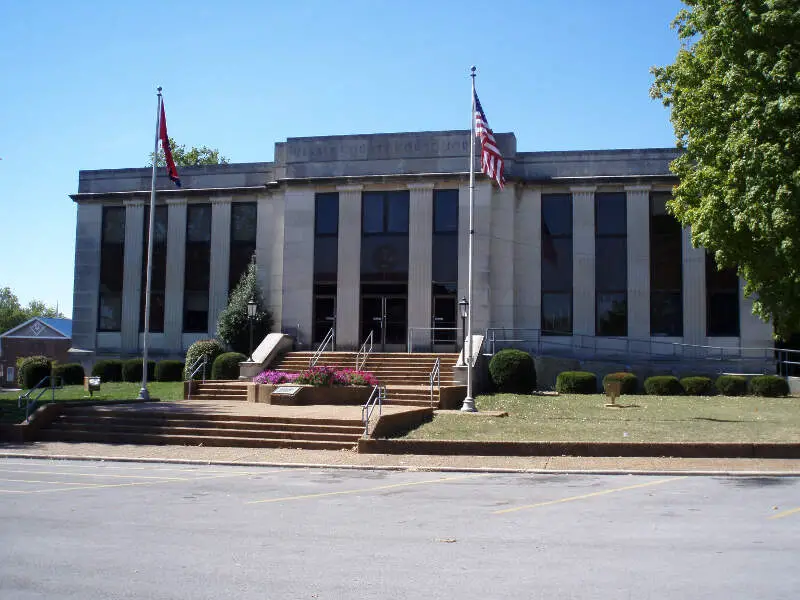
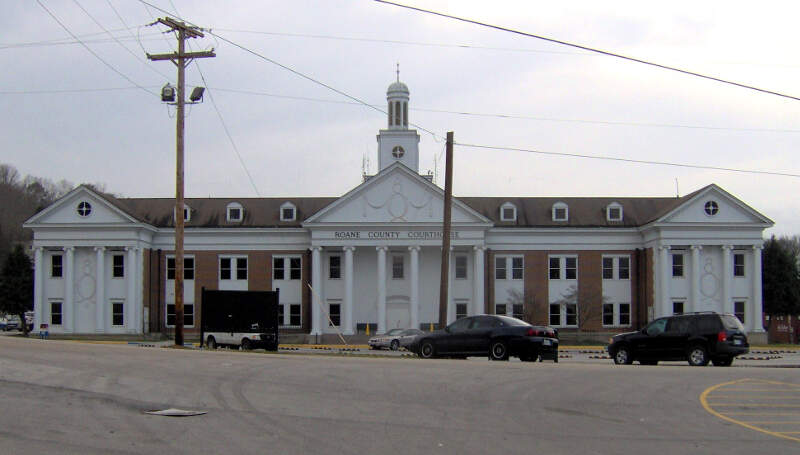
Average Age: 44.7
% Married: 26.0%
More on Kingston: Data | Crime | Cost Of Living | Movers
Methodology: How we determined the boring cities in the Volunteer State
You would present the following case to your friends if you were argueing with them at a bar about the most boring place to live in Tennessee. And that’s why we call it Saturday Night Science.
Because our data speaks more truth than feelings.
To figure out how boring a place is, we factored in things we generally think make people exciting, and then we figure out which cities have the least number of those exciting people.
We used the U.S. American Community Census data to gather the information presented here. HSome of the things people tend to think of as making a city’s population boring include:
- % of Population Over 25 (higher is more boring)
- % of Married Household (higher is more boring)
- Average Age (higher is more boring)
- % of Households With Kids (higher is more boring)
- Population density (lower is more boring)
Then, our algorithm generates a ranking for each place in these categories. After crunching the numbers, all of the cities ranked from most boring to most exciting.
For this ranking, we used every Tennessee city with at least 5,000 residents. This keeps us from prejudicing our rankings by including very small pockets of retired people.
Grab your rocker and hold on.
We updated this article for 2026, and it’s our eleventh time ranking the most boring cities in Tennessee.
There You Have It – Now That You’re Asleep
On a ranking like this, there are usually no winners, but since Tennessee isn’t necessarily the most boring state in the United States, the cities on this ranking can at least take solace that there are, in fact, more boring cities in the country.
The most boring cities in Tennessee are Pleasant View, Soddy-Daisy, Mount Carmel, Church Hill, Atoka, Smithville, Oakland, Millersville, Erwin, and Kingston.
If you’re also curious enough, here are the most exciting places in Tennessee, according to science:
- Knoxville
- Martin
- Memphis
For more Tennessee reading, check out:
- Best Places To Live In Tennessee
- Cheapest Places To Live In Tennessee
- Most Dangerous Cities In Tennessee
- Richest Cities In Tennessee
- Safest Places In Tennessee
- Worst Places To Live In Tennessee
- Most Expensive Places To Live In Tennessee
Detailed List Of The Most Boring Cities In Tennessee For 2026
| Rank | City | Population | Average Age | % Married | % Kids |
|---|---|---|---|---|---|
| 1 | Pleasant View, TN | 5,276 | 40.0 | 33.0% | 36.8% |
| 2 | Soddy-Daisy, TN | 13,231 | 45.6 | 31.0% | 29.9% |
| 3 | Mount Carmel, TN | 5,472 | 47.2 | 36.0% | 30.3% |
| 4 | Church Hill, TN | 7,139 | 44.6 | 38.0% | 31.3% |
| 5 | Atoka, TN | 10,385 | 39.1 | 29.0% | 40.6% |
| 6 | Smithville, TN | 5,288 | 42.2 | 36.0% | 33.5% |
| 7 | Oakland, TN | 9,979 | 40.3 | 25.0% | 31.6% |
| 8 | Millersville, TN | 5,836 | 40.8 | 24.0% | 31.2% |
| 9 | Erwin, TN | 5,988 | 44.3 | 32.0% | 32.5% |
| 10 | Kingston, TN | 6,224 | 44.7 | 26.0% | 30.7% |
| 11 | Dunlap, TN | 5,678 | 41.2 | 29.0% | 26.7% |
| 12 | Clinton, TN | 10,239 | 43.3 | 30.0% | 26.9% |
| 13 | Lakeland, TN | 14,192 | 41.0 | 23.0% | 39.9% |
| 14 | Lexington, TN | 7,962 | 36.9 | 30.0% | 35.3% |
| 15 | Arlington, TN | 15,205 | 36.7 | 29.0% | 49.6% |
| 16 | Greenbrier, TN | 6,971 | 36.8 | 32.0% | 40.7% |
| 17 | Humboldt, TN | 7,787 | 42.8 | 30.0% | 23.6% |
| 18 | Lawrenceburg, TN | 11,844 | 41.3 | 25.0% | 28.3% |
| 19 | Sweetwater, TN | 6,532 | 40.8 | 22.0% | 31.9% |
| 20 | Harriman, TN | 6,090 | 39.9 | 26.0% | 25.0% |
| 21 | Signal Mountain, TN | 8,860 | 44.3 | 20.0% | 35.9% |
| 22 | Tullahoma, TN | 21,103 | 38.3 | 25.0% | 32.3% |
| 23 | Alcoa, TN | 12,222 | 35.6 | 25.0% | 26.6% |
| 24 | Jonesborough, TN | 6,232 | 42.6 | 22.0% | 26.4% |
| 25 | Winchester, TN | 9,799 | 45.2 | 21.0% | 21.8% |
| 26 | Germantown, TN | 40,673 | 44.3 | 26.0% | 34.5% |
| 27 | Rockwood, TN | 5,566 | 47.2 | 18.0% | 21.2% |
| 28 | Madisonville, TN | 5,241 | 41.9 | 19.0% | 26.0% |
| 29 | Kingsport, TN | 56,262 | 43.0 | 23.0% | 26.2% |
| 30 | Greeneville, TN | 15,646 | 42.2 | 22.0% | 23.8% |
| 31 | Covington, TN | 8,587 | 40.3 | 35.0% | 24.1% |
| 32 | Farragut, TN | 24,634 | 45.6 | 20.0% | 32.0% |
| 33 | Oak Ridge, TN | 32,693 | 39.3 | 16.0% | 29.1% |
| 34 | Bristol, TN | 27,636 | 41.1 | 19.0% | 27.4% |
| 35 | Crossville, TN | 12,428 | 39.4 | 17.0% | 27.2% |
| 36 | Portland, TN | 13,449 | 34.8 | 26.0% | 41.0% |
| 37 | Brentwood, TN | 45,556 | 44.9 | 16.0% | 39.9% |
| 38 | Bartlett, TN | 56,876 | 41.2 | 27.0% | 31.1% |
| 39 | Thompson’s Station, TN | 8,294 | 38.5 | 14.0% | 44.6% |
| 40 | White House, TN | 14,631 | 34.8 | 23.0% | 39.2% |
| 41 | Dickson, TN | 16,424 | 33.8 | 22.0% | 36.4% |
| 42 | Millington, TN | 11,289 | 37.6 | 20.0% | 27.6% |
| 43 | Lewisburg, TN | 12,861 | 35.7 | 24.0% | 32.7% |
| 44 | Maryville, TN | 32,392 | 40.8 | 24.0% | 33.5% |
| 45 | Medina, TN | 5,407 | 34.9 | 40.0% | 51.6% |
| 46 | Dyersburg, TN | 15,979 | 41.5 | 22.0% | 31.1% |
| 47 | Collierville, TN | 51,515 | 41.0 | 20.0% | 40.1% |
| 48 | Elizabethton, TN | 14,374 | 40.9 | 23.0% | 26.7% |
| 49 | Newport, TN | 6,881 | 43.9 | 24.0% | 27.4% |
| 50 | Fairview, TN | 10,009 | 32.7 | 21.0% | 40.0% |
| 51 | Dayton, TN | 7,625 | 40.3 | 29.0% | 23.8% |
| 52 | Hendersonville, TN | 63,091 | 40.3 | 20.0% | 32.0% |
| 53 | Munford, TN | 6,588 | 32.1 | 25.0% | 36.8% |
| 54 | Bolivar, TN | 5,144 | 34.5 | 31.0% | 24.7% |
| 55 | Sevierville, TN | 18,397 | 39.6 | 16.0% | 24.5% |
| 56 | Nolensville, TN | 15,074 | 37.3 | 17.0% | 53.6% |
| 57 | Milan, TN | 8,244 | 36.4 | 29.0% | 31.5% |
| 58 | Lebanon, TN | 44,788 | 35.0 | 20.0% | 31.5% |
| 59 | Brownsville, TN | 9,622 | 40.4 | 19.0% | 32.1% |
| 60 | La Follette, TN | 7,273 | 38.2 | 19.0% | 35.4% |
| 61 | Athens, TN | 14,471 | 39.0 | 19.0% | 32.9% |
| 62 | Goodlettsville, TN | 17,597 | 38.5 | 21.0% | 25.5% |
| 63 | Ripley, TN | 7,658 | 33.3 | 23.0% | 33.5% |
| 64 | Paris, TN | 10,338 | 38.5 | 20.0% | 24.1% |
| 65 | Lafayette, TN | 5,727 | 32.3 | 32.0% | 38.8% |
| 66 | Mount Juliet, TN | 42,073 | 39.3 | 15.0% | 42.1% |
| 67 | Fayetteville, TN | 7,057 | 34.4 | 16.0% | 34.0% |
| 68 | Gallatin, TN | 48,532 | 36.6 | 20.0% | 28.4% |
| 69 | Mcminnville, TN | 13,844 | 37.0 | 20.0% | 30.3% |
| 70 | Morristown, TN | 31,527 | 36.3 | 20.0% | 35.8% |
| 71 | East Ridge, TN | 22,070 | 37.6 | 20.0% | 24.7% |
| 72 | Manchester, TN | 12,944 | 32.6 | 21.0% | 30.8% |
| 73 | Jackson, TN | 68,435 | 35.5 | 22.0% | 32.1% |
| 74 | Red Bank, TN | 12,010 | 37.9 | 18.0% | 19.1% |
| 75 | Spring Hill, TN | 55,765 | 36.1 | 12.0% | 41.0% |
| 76 | Franklin, TN | 87,133 | 38.6 | 12.0% | 32.7% |
| 77 | Savannah, TN | 7,412 | 35.3 | 17.0% | 34.6% |
| 78 | Henderson, TN | 6,411 | 28.1 | 17.0% | 39.6% |
| 79 | Pigeon Forge, TN | 6,375 | 32.5 | 7.0% | 32.2% |
| 80 | Columbia, TN | 45,441 | 35.5 | 17.0% | 31.7% |
| 81 | Pulaski, TN | 8,285 | 37.2 | 18.0% | 22.8% |
| 82 | Mckenzie, TN | 5,631 | 32.9 | 21.0% | 25.9% |
| 83 | Smyrna, TN | 56,692 | 34.1 | 14.0% | 38.7% |
| 84 | Springfield, TN | 19,255 | 34.5 | 16.0% | 34.8% |
| 85 | La Vergne, TN | 40,243 | 33.6 | 15.0% | 41.6% |
| 86 | Chattanooga, TN | 185,783 | 36.3 | 16.0% | 23.7% |
| 87 | Shelbyville, TN | 24,661 | 31.8 | 16.0% | 34.3% |
| 88 | Collegedale, TN | 11,330 | 36.4 | 12.0% | 14.1% |
| 89 | Cleveland, TN | 48,829 | 36.4 | 17.0% | 26.4% |
| 90 | Clarksville, TN | 176,456 | 31.0 | 11.0% | 35.0% |
| 91 | Cookeville, TN | 36,088 | 29.8 | 18.0% | 24.5% |
| 92 | Murfreesboro, TN | 161,445 | 31.6 | 16.0% | 33.1% |
| 93 | Memphis, TN | 618,980 | 34.2 | 15.0% | 28.3% |
| 94 | Martin, TN | 10,915 | 24.5 | 18.0% | 21.6% |
| 95 | Knoxville, TN | 195,185 | 33.5 | 16.0% | 21.4% |
Johnson City isn’t number 1?? You put Johnson City as one of the last ones??? WHAT???????????? Since the day ive been born here in JC my whole life I have either gone to school/work then come home to either stare at a tv, stare at a wall, or go to sleep. You really dont have another option. Ive never really connected with anyone here. Everyone’s always been on that “keep it short and sweet even if you have to fake it till they walk away” kind of shit. Or they’re just weird or on drugs. Most are on drugs here.
But Johnson City is one of the last on the list?? Is tennessee really this bad.. Get me out of here I want to live in Colorado myself.