
There’s no denying it: there are plenty of places in Texas that are downright beautiful and full of excitement.
Unfortunately, not all towns and cities in Lone Star State are so lucky.
Just like in all U.S. States, there are definitely some boring places within Texas’s’ borders. You know the places where everyone has an AARP card and the most exciting thing they do all day is post a picture of their grandchild on Facebook.
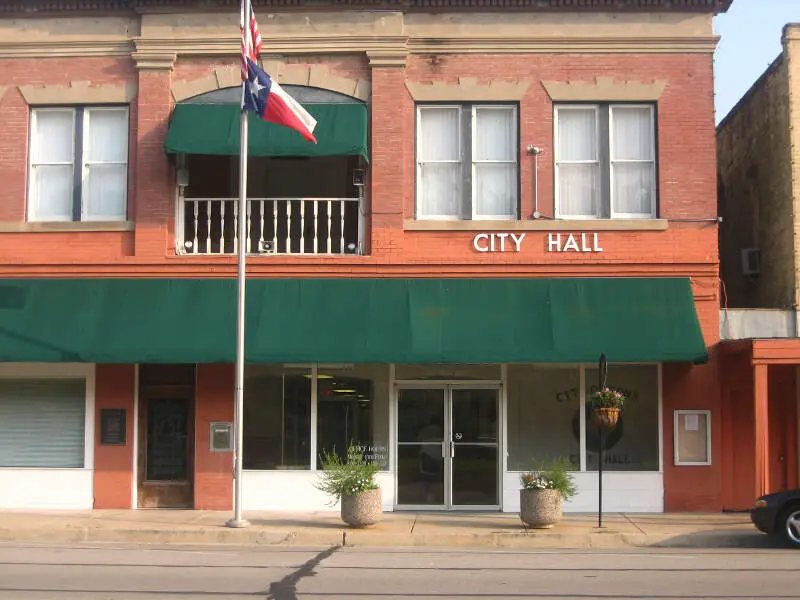
Like Willow Park, for instance. In our latest analysis, we found that this city was the most boring city in all of Oklahoma according to Saturday Night Science. But don’t feel bad if you’re a resident of Willow Park. There are plenty of other boring, lackluster places in Texas as well.
Here they are. Try not to jump out of your seat with excitement.
Table Of Contents: Top Ten | Methodology | Summary | Table
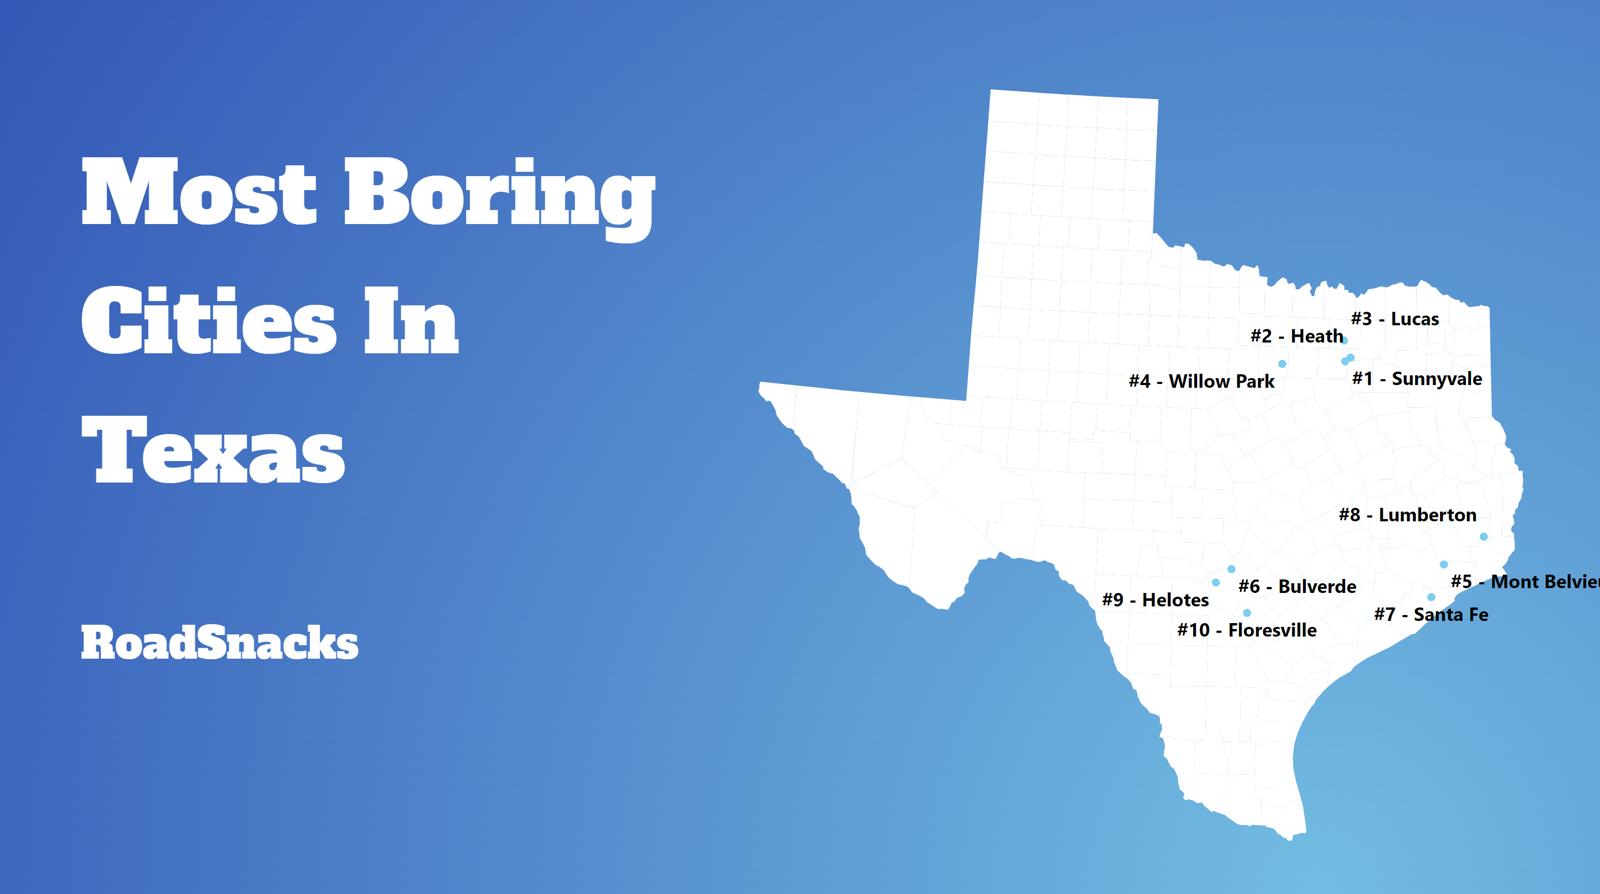
The 10 Most Boring Places In Texas
- Willow Park
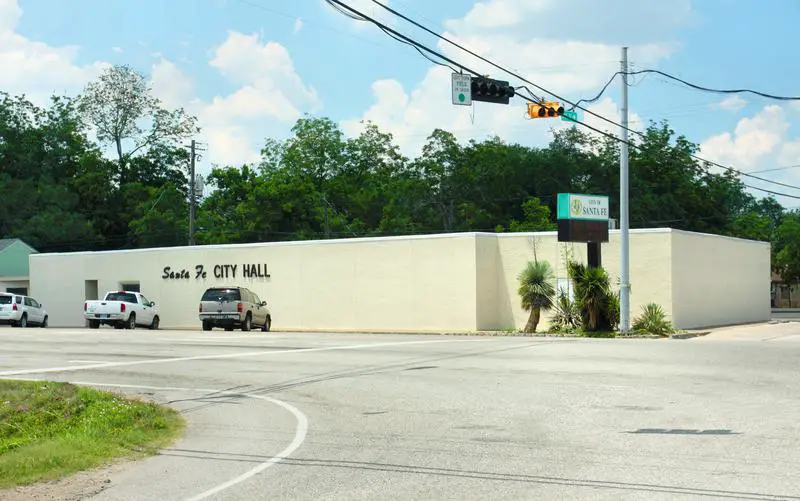
- Santa Fe
- Heath
- Edna
- Lindale
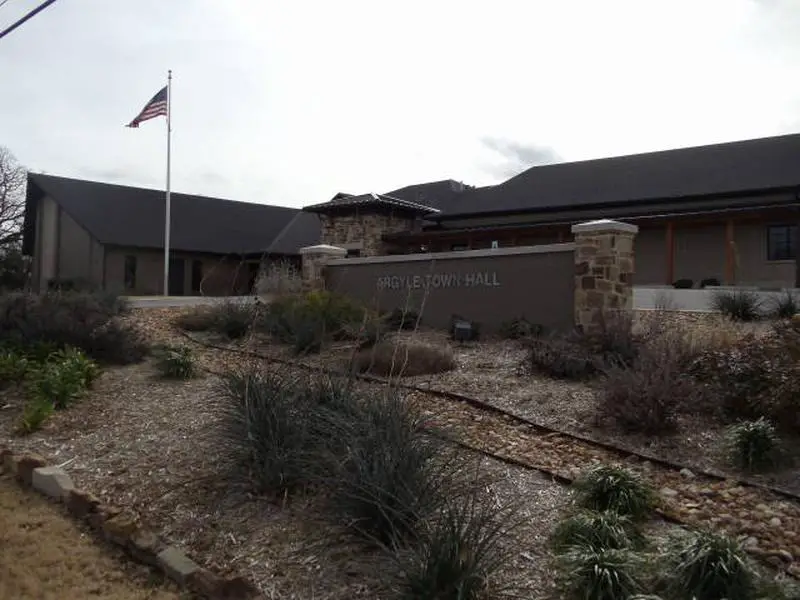
- Argyle
- Lucas
- Bulverde
- Giddings
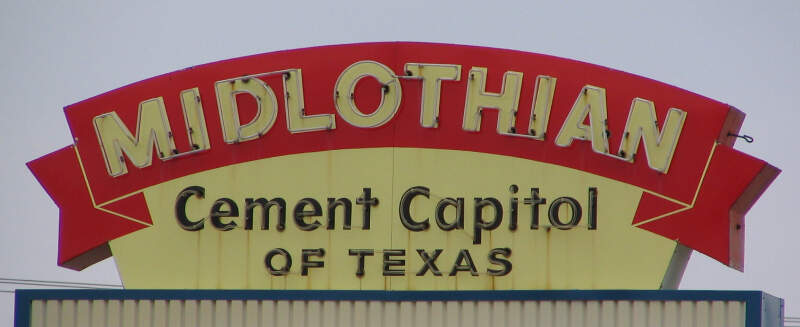
- Midlothian
Don’t freak out, in fact, believe it not, a boring city is actually one a lot of people would like to call home.
Before you get all upset if your city’s name is on the list, rest assured that we didn’t use personal opinion when it comes to what classifies a city or town as “boring” or “exciting”. We crunched actual numbers to figure out which towns are statistically more boring.
Showing this data to you is the kind of thing that a real estate agent knows, but would never share.
For more Texas reading, check out:
The 10 Most Boring Places In Texas For 2026
/10
Average Age: 45.8
% Married: 35.0%
More on Willow Park: Data | Crime | Cost Of Living | Movers

/10
Average Age: 43.0
% Married: 38.0%
More on Santa Fe: Data | Crime | Cost Of Living | Movers

/10
Average Age: 43.5
% Married: 33.0%
More on Heath: Data | Crime | Cost Of Living | Movers

/10
Average Age: 39.5
% Married: 41.0%
More on Edna: Data | Crime | Cost Of Living | Movers

/10
Average Age: 39.1
% Married: 35.0%
More on Lindale: Data | Crime | Cost Of Living | Movers
/10

/10
/10
Average Age: 50.2
% Married: 34.0%
More on Bulverde: Data | Crime | Cost Of Living | Movers
9. Giddings

/10
Average Age: 43.9
% Married: 29.0%
More on Giddings: Crime | Cost Of Living | Movers

/10
Average Age: 36.7
% Married: 34.0%
More on Midlothian: Data | Crime | Cost Of Living | Movers
Methodology: How we determined the boring cities in the Lone Star State
You would present the following case to your friends if you were argueing with them at a bar about the most boring place to live in Texas. And that’s why we call it Saturday Night Science.
Because our data speaks more truth than feelings.
To figure out how boring a place is, we factored in things we generally think make people exciting, and then we figure out which cities have the least number of those exciting people.
We used the U.S. American Community Census data to gather the information presented here. HSome of the things people tend to think of as making a city’s population boring include:
- % of Population Over 25 (higher is more boring)
- % of Married Household (higher is more boring)
- Average Age (higher is more boring)
- % of Households With Kids (higher is more boring)
- Population density (lower is more boring)
Then, our algorithm generates a ranking for each place in these categories. After crunching the numbers, all of the cities ranked from most boring to most exciting.
For this ranking, we used every Texas city with at least 5,000 residents. This keeps us from prejudicing our rankings by including very small pockets of retired people.
Grab your rocker and hold on.
We updated this article for 2026, and it’s our eleventh time ranking the most boring cities in Texas.
There You Have It – Now That You’re Asleep
On a ranking like this, there are usually no winners, but since Texas isn’t necessarily the most boring state in the United States, the cities on this ranking can at least take solace that there are, in fact, more boring cities in the country.
The most boring cities in Texas are Willow Park, Santa Fe, Heath, Edna, Lindale, Argyle, Lucas, Bulverde, Giddings, and Midlothian.
If you’re also curious enough, here are the most exciting places in Texas, according to science:
- College Station
- San Marcos
- Prairie View
For more Texas reading, check out:
- Best Places To Live In Texas
- Cheapest Places To Live In Texas
- Most Dangerous Places In Texas
- Richest Cities In Texas
- Safest Places In Texas
- Worst Places To Live In Texas
- Most Expensive Places To Live In Texas
Detailed List Of The Most Boring Cities In Texas For 2026
| Rank | City | Population | Average Age | % Married | % Kids |
|---|---|---|---|---|---|
| 1 | Willow Park, TX | 5,874 | 45.8 | 35.0% | 42.5% |
| 2 | Santa Fe, TX | 12,901 | 43.0 | 38.0% | 35.0% |
| 3 | Heath, TX | 10,777 | 43.5 | 33.0% | 40.1% |
| 4 | Edna, TX | 6,027 | 39.5 | 41.0% | 46.0% |
| 5 | Lindale, TX | 6,644 | 39.1 | 35.0% | 41.6% |
| 6 | Argyle, TX | 5,371 | 44.9 | 21.0% | 44.5% |
| 7 | Lucas, TX | 8,351 | 45.7 | 30.0% | 36.8% |
| 8 | Bulverde, TX | 6,486 | 50.2 | 34.0% | 26.4% |
| 9 | Giddings, TX | 5,151 | 43.9 | 29.0% | 36.3% |
| 10 | Midlothian, TX | 39,356 | 36.7 | 34.0% | 45.6% |
| 11 | Lumberton, TX | 13,963 | 42.8 | 46.0% | 30.9% |
| 12 | Granbury, TX | 12,136 | 51.0 | 32.0% | 23.0% |
| 13 | Sunnyvale, TX | 8,336 | 43.3 | 27.0% | 38.5% |
| 14 | Floresville, TX | 8,007 | 39.9 | 40.0% | 37.1% |
| 15 | Helotes, TX | 9,630 | 42.8 | 30.0% | 36.8% |
| 16 | Atlanta, TX | 5,439 | 43.4 | 27.0% | 31.0% |
| 17 | Rockport, TX | 10,683 | 51.2 | 33.0% | 16.3% |
| 18 | Vidor, TX | 9,708 | 40.4 | 36.0% | 29.9% |
| 19 | Burnet, TX | 6,732 | 40.4 | 32.0% | 31.4% |
| 20 | Rusk, TX | 5,477 | 39.0 | 20.0% | 42.0% |
| 21 | Woodway, TX | 9,570 | 43.6 | 40.0% | 31.5% |
| 22 | Parker, TX | 5,999 | 44.1 | 16.0% | 58.5% |
| 23 | Manvel, TX | 14,758 | 36.5 | 24.0% | 48.2% |
| 24 | Fair Oaks Ranch, TX | 10,728 | 46.1 | 27.0% | 33.5% |
| 25 | Roanoke, TX | 10,286 | 41.5 | 22.0% | 42.0% |
| 26 | White Oak, TX | 6,235 | 32.5 | 37.0% | 44.4% |
| 27 | Port Neches, TX | 13,664 | 41.1 | 38.0% | 33.2% |
| 28 | Fredericksburg, TX | 11,419 | 48.5 | 33.0% | 26.2% |
| 29 | Taylor, TX | 17,136 | 41.1 | 30.0% | 26.8% |
| 30 | Robinson, TX | 12,800 | 35.1 | 35.0% | 41.8% |
| 31 | Ingleside, TX | 9,997 | 37.4 | 30.0% | 33.9% |
| 32 | Bonham, TX | 10,697 | 36.7 | 21.0% | 42.3% |
| 33 | Lampasas, TX | 7,671 | 39.5 | 32.0% | 30.5% |
| 34 | Brady, TX | 5,230 | 39.6 | 30.0% | 28.4% |
| 35 | Joshua, TX | 8,550 | 36.7 | 36.0% | 34.9% |
| 36 | Aransas Pass, TX | 8,972 | 42.7 | 25.0% | 22.9% |
| 37 | Buda, TX | 15,859 | 37.2 | 29.0% | 43.3% |
| 38 | Robstown, TX | 10,236 | 42.2 | 29.0% | 29.0% |
| 39 | Justin, TX | 5,447 | 35.2 | 35.0% | 50.3% |
| 40 | Cuero, TX | 8,165 | 39.4 | 33.0% | 33.7% |
| 41 | Lockhart, TX | 15,326 | 39.0 | 29.0% | 28.4% |
| 42 | Luling, TX | 5,531 | 48.7 | 26.0% | 21.3% |
| 43 | Monahans, TX | 7,452 | 33.3 | 35.0% | 37.8% |
| 44 | Lakeway, TX | 19,307 | 49.8 | 22.0% | 34.0% |
| 45 | Melissa, TX | 20,136 | 36.3 | 23.0% | 57.5% |
| 46 | Marble Falls, TX | 7,752 | 35.5 | 24.0% | 39.6% |
| 47 | Van Alstyne, TX | 5,952 | 36.4 | 23.0% | 43.6% |
| 48 | Burkburnett, TX | 11,059 | 40.9 | 27.0% | 29.1% |
| 49 | Krum, TX | 6,189 | 35.9 | 30.0% | 48.0% |
| 50 | La Marque, TX | 19,268 | 39.0 | 26.0% | 35.2% |
| 51 | Carthage, TX | 6,601 | 39.9 | 25.0% | 34.4% |
| 52 | Alpine, TX | 6,014 | 39.5 | 34.0% | 21.3% |
| 53 | Livingston, TX | 5,718 | 35.9 | 24.0% | 34.6% |
| 54 | Hitchcock, TX | 7,563 | 34.2 | 31.0% | 43.3% |
| 55 | Childress, TX | 5,834 | 35.6 | 21.0% | 38.1% |
| 56 | Dripping Springs, TX | 7,405 | 38.5 | 21.0% | 42.8% |
| 57 | Iowa Colony, TX | 12,891 | 34.7 | 28.0% | 45.8% |
| 58 | Aledo, TX | 5,825 | 34.6 | 38.0% | 49.6% |
| 59 | Rockwall, TX | 51,168 | 39.5 | 26.0% | 37.5% |
| 60 | Bridgeport, TX | 6,331 | 33.6 | 29.0% | 36.7% |
| 61 | Decatur, TX | 7,426 | 40.5 | 22.0% | 29.9% |
| 62 | Oak Point, TX | 5,887 | 34.5 | 24.0% | 38.8% |
| 63 | Tomball, TX | 13,655 | 37.7 | 23.0% | 36.0% |
| 64 | Mont Belvieu, TX | 9,020 | 33.6 | 39.0% | 41.5% |
| 65 | Colleyville, TX | 26,012 | 46.4 | 23.0% | 36.6% |
| 66 | Bastrop, TX | 11,156 | 40.2 | 25.0% | 24.1% |
| 67 | Sulphur Springs, TX | 16,401 | 36.5 | 33.0% | 33.6% |
| 68 | Cameron, TX | 5,416 | 34.9 | 33.0% | 42.9% |
| 69 | Josephine, TX | 5,842 | 33.8 | 30.0% | 48.3% |
| 70 | Brownfield, TX | 8,738 | 37.9 | 27.0% | 38.5% |
| 71 | Graham, TX | 8,792 | 37.9 | 35.0% | 35.3% |
| 72 | Weatherford, TX | 35,788 | 38.0 | 28.0% | 31.0% |
| 73 | Fairview, TX | 10,783 | 49.1 | 22.0% | 25.2% |
| 74 | Granite Shoals, TX | 5,328 | 41.9 | 22.0% | 36.3% |
| 75 | Mabank, TX | 5,187 | 33.1 | 38.0% | 41.2% |
| 76 | Angleton, TX | 19,972 | 37.3 | 37.0% | 34.5% |
| 77 | Terrell Hills, TX | 5,070 | 42.7 | 35.0% | 36.2% |
| 78 | Azle, TX | 14,126 | 35.6 | 28.0% | 36.9% |
| 79 | Mineral Wells, TX | 15,244 | 38.0 | 31.0% | 29.4% |
| 80 | Trophy Club, TX | 13,733 | 43.1 | 22.0% | 42.5% |
| 81 | Northlake, TX | 8,283 | 32.6 | 26.0% | 43.7% |
| 82 | Schertz, TX | 44,050 | 38.6 | 22.0% | 37.0% |
| 83 | Seguin, TX | 33,754 | 37.1 | 25.0% | 32.3% |
| 84 | Boerne, TX | 20,518 | 38.7 | 22.0% | 39.7% |
| 85 | Kerrville, TX | 24,755 | 41.7 | 27.0% | 22.7% |
| 86 | Big Spring, TX | 23,975 | 36.4 | 28.0% | 35.3% |
| 87 | Mineola, TX | 5,068 | 41.3 | 23.0% | 25.8% |
| 88 | Silsbee, TX | 6,842 | 40.3 | 31.0% | 29.2% |
| 89 | Dayton, TX | 9,058 | 31.4 | 30.0% | 38.3% |
| 90 | Palestine, TX | 19,136 | 35.7 | 24.0% | 38.8% |
| 91 | Kennedale, TX | 9,439 | 38.6 | 24.0% | 31.3% |
| 92 | Red Oak, TX | 17,077 | 34.0 | 29.0% | 46.3% |
| 93 | Rockdale, TX | 5,523 | 39.1 | 32.0% | 25.0% |
| 94 | Denison, TX | 25,778 | 40.4 | 23.0% | 32.3% |
| 95 | Cleburne, TX | 34,344 | 35.0 | 33.0% | 37.0% |
| 96 | Leander, TX | 74,067 | 36.3 | 21.0% | 45.4% |
| 97 | Hewitt, TX | 16,432 | 38.0 | 32.0% | 36.2% |
| 98 | Celina, TX | 34,268 | 34.7 | 19.0% | 57.5% |
| 99 | Southlake, TX | 31,137 | 43.1 | 18.0% | 50.0% |
| 100 | Prosper, TX | 37,869 | 37.6 | 15.0% | 60.1% |
Guys, you are out of your collective minds. You can’t compare Rockport to these other places because it’s not some ‘bedroom community’–it’s a RESORT area. Many of the residents, me included, are part-timers. We come here to go boating, fishing, shopping, art hunting and eating at our great local restaurants–the ones with freshly caught seafood. We’re not Fair Oaks Ranch, get it? Our favorite pastime is not mowing our front lawns, it’s living the life at the beach! You should probably learn the limitations of statistics.
Try living here full-time and tell me what you think. Ever heard of too much of a good thing? It’s real.
Is it a rich community. Or do y’all rent when you go? No matter….. Do you want to adopt another mom? Lol
My family never likes fun. Been married 30 years this next June and never had a vacation or a honeymoon.
Sorry. #1: Bogota (say BO GO ta )
Who writes this stuff?! Do they actually get paid for this?! This has got to be a click bait article. Hahaha!!!!!!
“We crunched actual numbers to figure out which towns are statistically more boring.” Your numbers are incorrect, so your rankings are not trustworthy.
Hi Kristan,
They are directly from the US Census. What’s inaccurate about the data?
Rockport is far from boring! Obviously they didn’t drive through Nixon or Smiley. This is a bunch of crap!
I like that Richmond and Rosenberg are like 30 places apart on the list when they are basically the same city.
Rockport has numerous parks, Aransas Pathways birding sites, Tule Hike & Bike Trails, Memorial Park which includes, Pavilion, 4 Soccer Fields, basketball court, Peewee, little league, softball & Senior league baseball fields, picnic areas with bbq pits, kid playground, exercise area, doggy stations, fenced Doggy Parks for big & small dogs, 2 ponds, wildlife, birds, turtles, ducks & fish, Natural wooded mulch trails with plenty of deer roaming in town as well as trails, Aquatic pool, skate park, Bay Education Center, Zachry Taylor Park & Pavilion, Compass Rose Park & Pavilion, Spencer Park, Mathis Park, Magnolia Park, McDonald Park, Observation Decks at Tule East & Tule West next to Walmart & across street from Walmart.
Vidor is less boring than New Braunfels? What is your definition of boring?
Fredrickburg is the 27th most boring town in Texas?? It’s only the second biggest wine destination in the entire country behind Napa Valley!
Huntsville being the 10th least boring town in Texas is also a joke
Forgot Ingram
College Station?… I’ve lived here for 40 years. You are delusional if you think College Station is the most exciting place to live in Texas. There is nothing to do here but drink, eat at chain restaurants and go to church. That’s it. This place is the f’n pits. It couldn’t be more culturally stunted if it tried.