
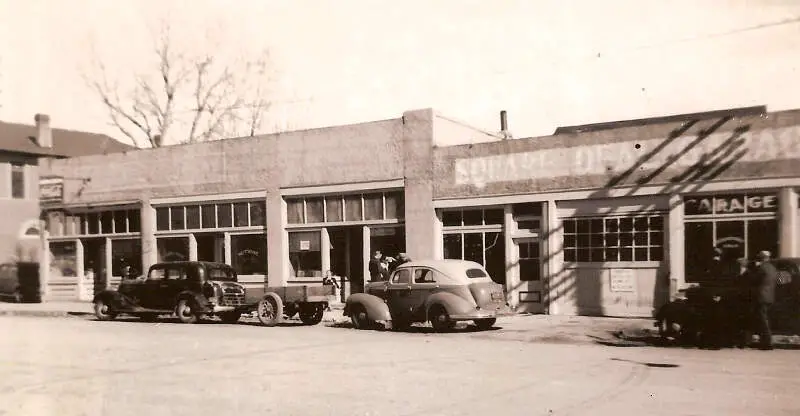
Do you live in one of the most miserable places in Colorado?
Only a third of Coloradans say they are truly happy. That’s too bad, considering that folks in Colorado don’t really have it too bad in the grand scheme of things.
But, we were curious – which Colorado cities might be the most miserable? We’re about to find out, using Saturday Night Science and data.
After analyzing the 78 largest cities, we sadly present the most miserable cities in the Centennial State.
Table Of Contents: Top Ten | Methodology | Summary | Table
The 10 Most Miserable Places In Colorado
Read on below to see how we crunched the numbers and how your town ranked. If you have a smile on your face, you probably don’t live in one of these cities.
Oh, and by the way, Durango is the happiest place in Colorado.
For more Colorado reading, check out:
The 10 Most Miserable Places In Colorado For 2023
/10
Population: 29,495
Poverty Level: 7.9%
Median Home Price $284,900
Married Households 9.0%
Households With Kids 42.44%
More on Fountain: Data | Crime | Cost Of Living
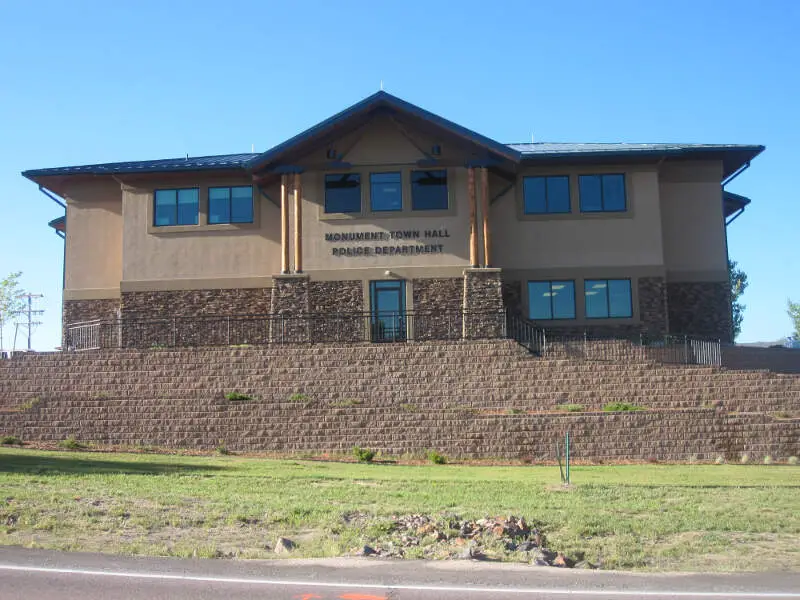
/10
Population: 10,026
Poverty Level: 3.2%
Median Home Price $417,900
Married Households 8.0%
Households With Kids 32.8%
More on Monument: Data | Crime | Cost Of Living
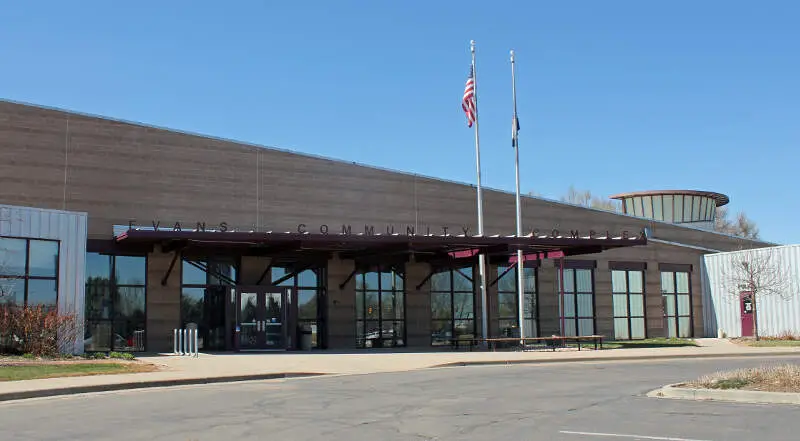
/10
Population: 21,727
Poverty Level: 17.7%
Median Home Price $259,000
Married Households 16.0%
Households With Kids 48.34%
More on Evans: Data | Crime | Cost Of Living
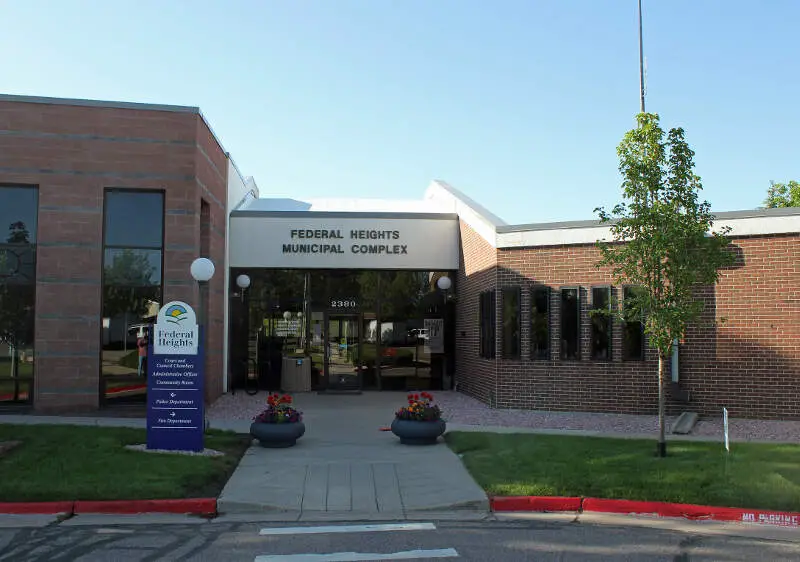
/10
Population: 14,111
Poverty Level: 20.1%
Median Home Price $74,600
Married Households 10.0%
Households With Kids 38.4%
More on Federal Heights: Data | Cost Of Living
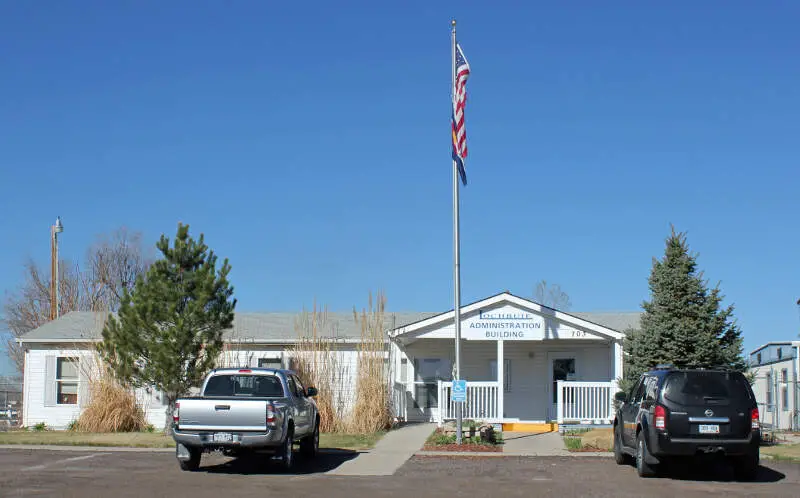
/10
Population: 7,730
Poverty Level: 3.7%
Median Home Price $293,500
Married Households 22.0%
Households With Kids 41.57%
More on Lochbuie: Data | Cost Of Living
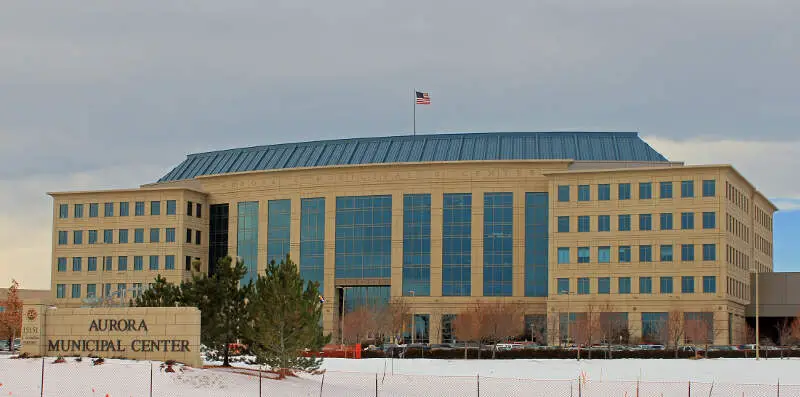
/10
Population: 383,496
Poverty Level: 10.2%
Median Home Price $350,200
Married Households 10.0%
Households With Kids 34.11%
More on Aurora: Data | Crime | Cost Of Living
/10
Population: 7,854
Poverty Level: 7.1%
Median Home Price $356,300
Married Households 7.0%
Households With Kids 26.97%
More on Woodland Park: Data | Crime | Cost Of Living
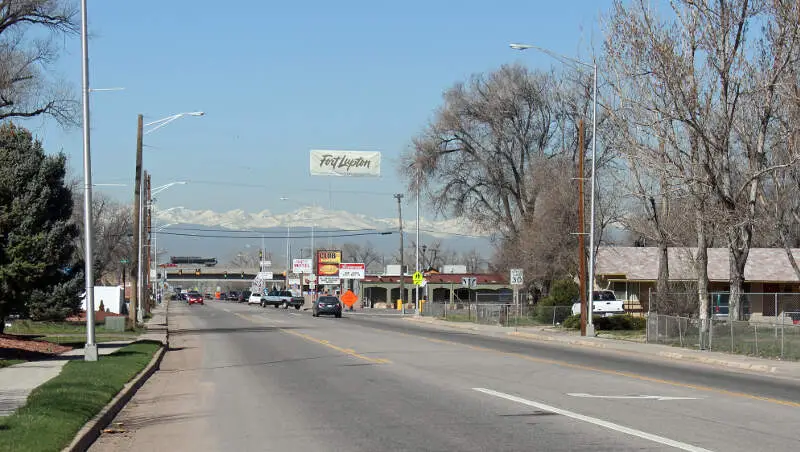
/10
Population: 7,947
Poverty Level: 9.6%
Median Home Price $306,100
Married Households 20.0%
Households With Kids 31.38%
More on Fort Lupton: Data | Crime | Cost Of Living
/10
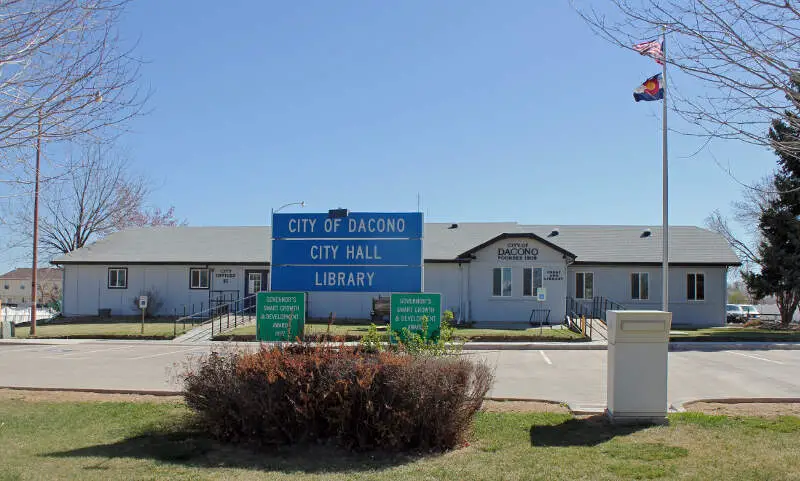
Population: 6,084
Poverty Level: 6.5%
Median Home Price $347,500
Married Households 22.0%
Households With Kids 44.49%
More on Dacono: Data | Crime | Cost Of Living
/10
Population: 10,325
Poverty Level: 7.0%
Median Home Price $301,100
Married Households 24.0%
Households With Kids 43.04%
More on Rifle: Data | Crime | Cost Of Living
Methodology: How We Measured The Most Miserable Cities In The Centennial State
To rank the unhappiest places in Colorado, we had to determine what criteria make people happy. It isn’t a stretch to assume that happy people earn great salaries, are relatively stress-free, and have a stable home life.
So we went to the Census’s American Community Survey 2017-2021 report for the happy criteria, flipped the list with Saturday Night Science, and it spit out the answer.
Like magic.
Here are the criteria we used to measure misery:
- Percentage of residents with a college degree
- Average commute times
- Unemployment rates
- Cost of living
- % of married couples
- % of families with kids
- Poverty rate
After we decided on the criteria, we gathered the data for the 78 places in Colorado with over 5,000 people.
We then ranked each place from one to 78 for each of the seven criteria, with a score of one being the most miserable (Any ties were given to the larger place).
Next, we averaged the seven rankings into a Miserable Index for each place with the lowest overall Miserable Index “earning” the title “Most Miserable City In Colorado.”
If you’d like to see the complete list of states, most miserable to happiest, scroll to the bottom of this post to see the unabridged chart.
We updated this article for 2023, and it’s our tenth time ranking the most miserable cities in Colorado.
There You Have It – The Least Happy Cities In Colorado
As we said earlier, trying to determine the most miserable cities in Colorado is usually a subjective matter.
But if you’re analyzing cities where people are not stable, where you’re stuck in traffic, and no one spent the time to go to college, then this is an accurate list.
If you’re curious enough, here are the happiest cities in Colorado, according to science:
- Durango
- Steamboat Springs
- Boulder
For more Colorado reading, check out:
- Best Places To Live In Colorado
- Cheapest Places To Live In Colorado
- Most Dangerous Cities In Colorado
- Richest Cities In Colorado
- Safest Places In Colorado
- Worst Places To Live In Colorado
- Most Expensive Places To Live In Colorado
Miserable Cities In Colorado For 2023
| Rank | City | Population | Poverty Level | Median Home Value | % Married | % Kids |
|---|---|---|---|---|---|---|
| 1 | Fountain, CO | 29,495 | 7.9% | $284,900 | 9.0% | 42.44% |
| 2 | Monument, CO | 10,026 | 3.2% | $417,900 | 8.0% | 32.8% |
| 3 | Evans, CO | 21,727 | 17.7% | $259,000 | 16.0% | 48.34% |
| 4 | Federal Heights, CO | 14,111 | 20.1% | $74,600 | 10.0% | 38.4% |
| 5 | Lochbuie, CO | 7,730 | 3.7% | $293,500 | 22.0% | 41.57% |
| 6 | Aurora, CO | 383,496 | 10.2% | $350,200 | 10.0% | 34.11% |
| 7 | Woodland Park, CO | 7,854 | 7.1% | $356,300 | 7.0% | 26.97% |
| 8 | Fort Lupton, CO | 7,947 | 9.6% | $306,100 | 20.0% | 31.38% |
| 9 | Dacono, CO | 6,084 | 6.5% | $347,500 | 22.0% | 44.49% |
| 10 | Rifle, CO | 10,325 | 7.0% | $301,100 | 24.0% | 43.04% |
| 11 | Brighton, CO | 39,895 | 7.8% | $366,200 | 22.0% | 40.31% |
| 12 | Thornton, CO | 140,538 | 8.2% | $376,900 | 18.0% | 40.78% |
| 13 | Firestone, CO | 15,949 | 3.5% | $399,900 | 19.0% | 41.96% |
| 14 | Frederick, CO | 14,127 | 2.9% | $421,200 | 21.0% | 42.3% |
| 15 | Northglenn, CO | 37,899 | 8.4% | $351,500 | 18.0% | 34.43% |
| 16 | Commerce City, CO | 61,516 | 9.8% | $364,600 | 21.0% | 46.83% |
| 17 | Milliken, CO | 8,122 | 2.7% | $336,000 | 33.0% | 36.16% |
| 18 | Castle Rock, CO | 71,037 | 3.6% | $472,800 | 15.0% | 45.26% |
| 19 | Greeley, CO | 107,014 | 15.3% | $296,300 | 15.0% | 34.28% |
| 20 | Erie, CO | 29,367 | 4.0% | $565,500 | 13.0% | 48.3% |
| 21 | Colorado Springs, CO | 475,282 | 10.9% | $324,100 | 9.0% | 30.14% |
| 22 | Delta, CO | 9,036 | 16.3% | $195,500 | 19.0% | 26.54% |
| 23 | Cortez, CO | 8,742 | 15.8% | $174,800 | 14.0% | 31.27% |
| 24 | Berthoud, CO | 10,188 | 2.9% | $399,000 | 18.0% | 31.23% |
| 25 | Wellington, CO | 10,769 | 11.4% | $351,000 | 24.0% | 39.68% |
| 26 | Brush, CO | 5,323 | 13.9% | $205,200 | 34.0% | 45.81% |
| 27 | John, CO | 16,596 | 7.3% | $407,900 | 28.0% | 37.5% |
| 28 | Parker, CO | 57,311 | 3.0% | $475,400 | 14.0% | 44.98% |
| 29 | Fort Morgan, CO | 11,483 | 13.6% | $215,100 | 21.0% | 41.58% |
| 30 | Glenwood Springs, CO | 10,017 | 9.0% | $465,600 | 10.0% | 28.31% |
| 31 | La Junta, CO | 7,282 | 25.4% | $98,100 | 19.0% | 24.95% |
| 32 | Windsor, CO | 31,972 | 3.5% | $452,000 | 19.0% | 36.71% |
| 33 | Westminster, CO | 115,535 | 6.6% | $388,300 | 16.0% | 28.14% |
| 34 | Sheridan, CO | 6,090 | 13.1% | $280,700 | 17.0% | 24.74% |
| 35 | Avon, CO | 6,209 | 15.8% | $531,600 | 4.0% | 31.84% |
| 36 | Severance, CO | 7,691 | 0.7% | $404,600 | 30.0% | 47.69% |
| 37 | Fruita, CO | 13,296 | 7.8% | $259,300 | 26.0% | 40.29% |
| 38 | Lamar, CO | 7,636 | 20.3% | $105,700 | 19.0% | 35.64% |
| 39 | Alamosa, CO | 9,704 | 19.9% | $154,500 | 17.0% | 28.31% |
| 40 | Loveland, CO | 75,938 | 8.0% | $359,400 | 15.0% | 24.86% |
| 41 | Superior, CO | 13,283 | 3.4% | $660,000 | 8.0% | 47.41% |
| 42 | Pueblo, CO | 111,424 | 21.0% | $163,400 | 22.0% | 28.85% |
| 43 | Craig, CO | 9,026 | 17.3% | $182,100 | 17.0% | 33.72% |
| 44 | Longmont, CO | 98,789 | 8.2% | $423,300 | 11.0% | 28.78% |
| 45 | Eagle, CO | 7,420 | 5.9% | $614,400 | 10.0% | 50.07% |
| 46 | Trinidad, CO | 8,318 | 22.4% | $158,700 | 20.0% | 24.44% |
| 47 | Gypsum, CO | 8,047 | 9.2% | $383,600 | 12.0% | 46.12% |
| 48 | Montrose, CO | 20,098 | 12.9% | $261,600 | 17.0% | 23.27% |
| 49 | Eaton, CO | 5,648 | 3.7% | $349,200 | 36.0% | 36.64% |
| 50 | Centennial, CO | 107,972 | 3.3% | $484,500 | 14.0% | 35.33% |
| 51 | Arvada, CO | 122,903 | 6.0% | $456,200 | 20.0% | 29.81% |
| 52 | Grand Junction, CO | 65,067 | 13.1% | $271,100 | 15.0% | 24.04% |
| 53 | Lakewood, CO | 155,608 | 9.2% | $428,800 | 15.0% | 23.28% |
| 54 | Lafayette, CO | 30,307 | 4.4% | $498,400 | 10.0% | 30.35% |
| 55 | Castle Pines, CO | 11,296 | 4.5% | $688,100 | 10.0% | 43.26% |
| 56 | Broomfield, CO | 72,697 | 4.4% | $482,100 | 14.0% | 30.41% |
| 57 | Timnath, CO | 6,289 | 4.2% | $585,000 | 29.0% | 60.52% |
| 58 | Wheat Ridge, CO | 32,340 | 12.1% | $459,500 | 16.0% | 23.44% |
| 59 | Denver, CO | 706,799 | 11.6% | $459,100 | 9.0% | 23.57% |
| 60 | Edgewater, CO | 5,047 | 9.9% | $473,600 | 9.0% | 19.74% |
| 61 | Littleton, CO | 45,465 | 7.4% | $471,900 | 13.0% | 23.65% |
| 62 | Sterling, CO | 13,976 | 13.0% | $149,700 | 20.0% | 26.38% |
| 63 | Gunnison, CO | 6,459 | 25.2% | $286,400 | 7.0% | 18.55% |
| 64 | Englewood, CO | 33,500 | 8.9% | $409,800 | 14.0% | 18.39% |
| 65 | Fort Collins, CO | 166,788 | 15.7% | $431,300 | 9.0% | 24.32% |
| 66 | Louisville, CO | 21,091 | 5.2% | $677,000 | 10.0% | 33.68% |
| 67 | Golden, CO | 20,041 | 11.4% | $579,800 | 10.0% | 26.01% |
| 68 | Aspen, CO | 7,019 | 3.1% | $0 | 7.0% | 24.16% |
| 69 | Lone Tree, CO | 13,701 | 4.1% | $691,300 | 8.0% | 25.84% |
| 70 | Salida, CO | 5,671 | 17.1% | $377,500 | 15.0% | 32.18% |
| 71 | Estes Park, CO | 5,942 | 10.9% | $463,400 | 10.0% | 10.44% |
| 72 | Breckenridge, CO | 5,086 | 1.3% | $479,400 | 8.0% | 15.35% |
| 73 | Cherry Hills Village, CO | 6,426 | 3.7% | $2,000,001 | 15.0% | 41.45% |
| 74 | Greenwood Village, CO | 15,548 | 5.8% | $984,400 | 11.0% | 29.82% |
| 75 | Carbondale, CO | 6,464 | 12.1% | $638,000 | 12.0% | 27.46% |
| 76 | Boulder, CO | 104,930 | 20.9% | $790,100 | 4.0% | 18.18% |
| 77 | Steamboat Springs, CO | 13,193 | 9.6% | $628,800 | 8.0% | 23.43% |
| 78 | Durango, CO | 18,953 | 10.6% | $497,100 | 10.0% | 21.72% |