
Do you live in one of the most miserable places in Louisiana?
Only a third of Louisianians say they are truly happy. That’s too bad, considering that folks in Louisiana don’t really have it too bad in the grand scheme of things.
But, we were curious – which Louisiana cities might be the most miserable? We’re about to find out, using Saturday Night Science and data.
After analyzing the 60 largest cities, we sadly present the most miserable cities in the Pelican State.
Table Of Contents: Top Ten | Methodology | Summary | Table
The 10 Most Miserable Places In Louisiana
Read on below to see how we crunched the numbers and how your town ranked. If you have a smile on your face, you probably don’t live in one of these cities.
Oh, and by the way, Ruston is the happiest place in Louisiana.
For more Louisiana reading, check out:
The 10 Most Miserable Places In Louisiana For 2023
/10
Population: 10,921
Poverty Level: 32.3%
Median Home Price $96,500
Married Households 22.0%
Households With Kids 37.06%
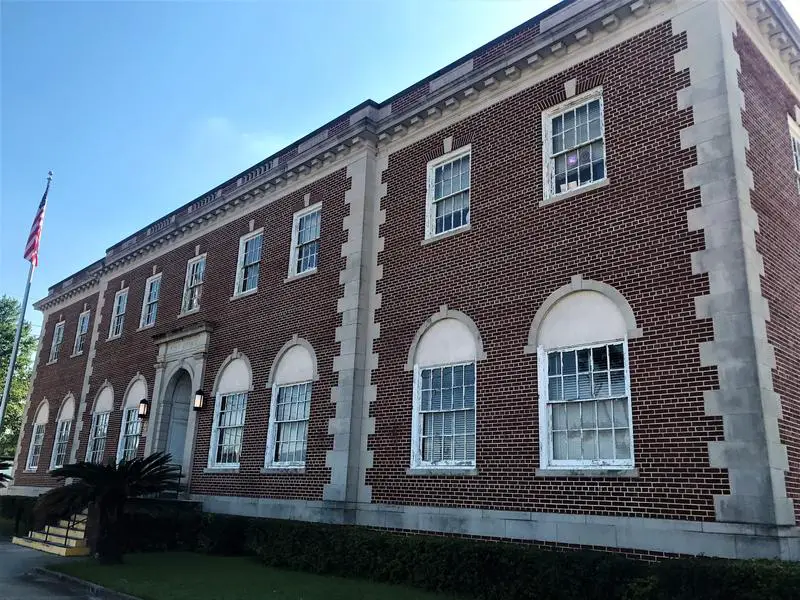
More on Bogalusa: Data | Crime | Cost Of Living
/10
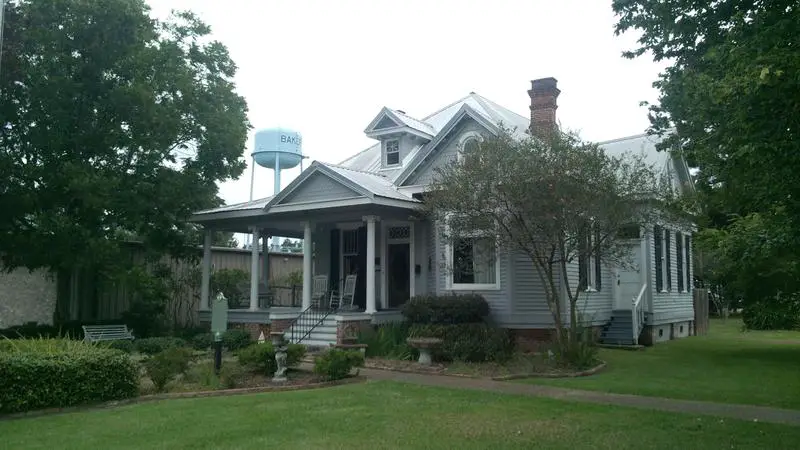
Population: 12,736
Poverty Level: 14.9%
Median Home Price $127,900
Married Households 24.0%
Households With Kids 33.18%
More on Baker: Data | Crime | Cost Of Living
/10
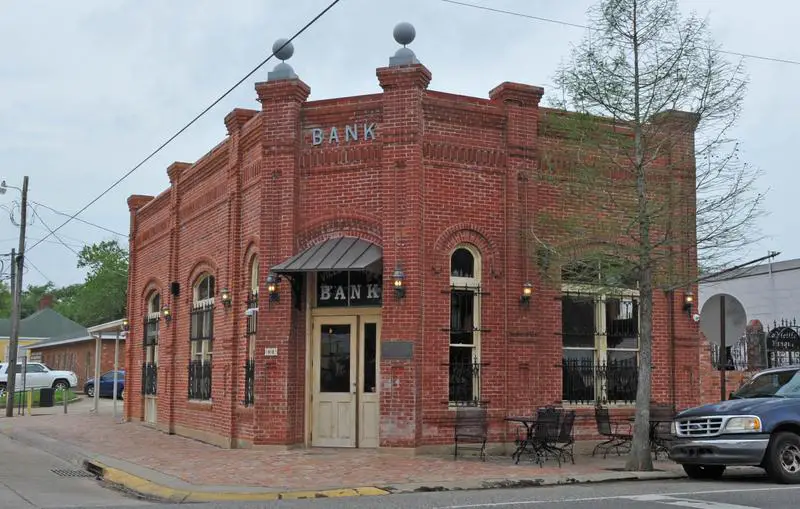
Population: 5,118
Poverty Level: 35.0%
Median Home Price $86,600
Married Households 27.0%
Households With Kids 34.18%
More on Marksville: Data | Crime | Cost Of Living
/10
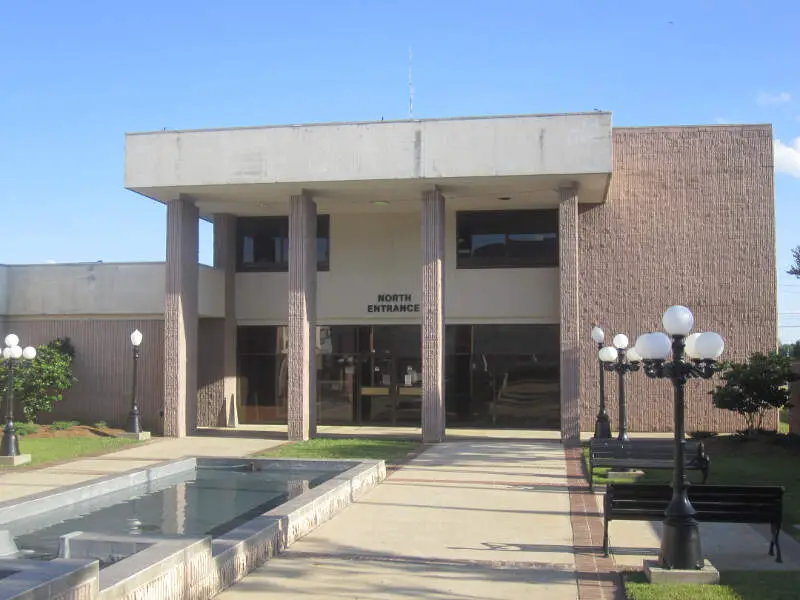
Population: 6,488
Poverty Level: 41.5%
Median Home Price $63,800
Married Households 21.0%
Households With Kids 31.55%
More on Ville Platte: Data | Crime | Cost Of Living
/10
Population: 9,879
Poverty Level: 44.0%
Median Home Price $82,000
Married Households 22.0%
Households With Kids 32.43%
More on Bastrop: Data | Crime | Cost Of Living
/10
Population: 15,884
Poverty Level: 37.2%
Median Home Price $105,700
Married Households 25.0%
Households With Kids 35.88%
More on Opelousas: Data | Crime | Cost Of Living
/10
/10
Population: 7,092
Poverty Level: 24.7%
Median Home Price $94,400
Married Households 25.0%
Households With Kids 27.59%
More on Oakdale: Data | Cost Of Living
/10
Population: 6,834
Poverty Level: 46.9%
Median Home Price $149,700
Married Households 29.0%
Households With Kids 37.91%
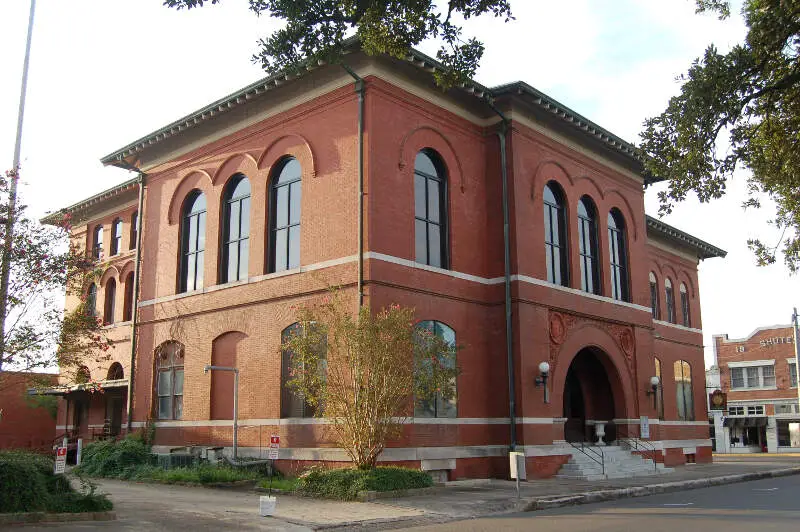
More on Donaldsonville: Data | Cost Of Living
/10
Population: 9,836
Poverty Level: 19.9%
Median Home Price $124,300
Married Households 36.0%
Households With Kids 38.5%
More on Jennings: Data | Crime | Cost Of Living
Methodology: How We Measured The Most Miserable Cities In The Pelican State
To rank the unhappiest places in Louisiana, we had to determine what criteria make people happy. It isn’t a stretch to assume that happy people earn great salaries, are relatively stress-free, and have a stable home life.
So we went to the Census’s American Community Survey 2017-2021 report for the happy criteria, flipped the list with Saturday Night Science, and it spit out the answer.
Like magic.
Here are the criteria we used to measure misery:
- Percentage of residents with a college degree
- Average commute times
- Unemployment rates
- Cost of living
- % of married couples
- % of families with kids
- Poverty rate
After we decided on the criteria, we gathered the data for the 60 places in Louisiana with over 5,000 people.
We then ranked each place from one to 60 for each of the seven criteria, with a score of one being the most miserable (Any ties were given to the larger place).
Next, we averaged the seven rankings into a Miserable Index for each place with the lowest overall Miserable Index “earning” the title “Most Miserable City In Louisiana.”
If you’d like to see the complete list of states, most miserable to happiest, scroll to the bottom of this post to see the unabridged chart.
We updated this article for 2023, and it’s our tenth time ranking the most miserable cities in Louisiana.
There You Have It – The Least Happy Cities In Louisiana
As we said earlier, trying to determine the most miserable cities in Louisiana is usually a subjective matter.
But if you’re analyzing cities where people are not stable, where you’re stuck in traffic, and no one spent the time to go to college, then this is an accurate list.
If you’re curious enough, here are the happiest cities in Louisiana, according to science:
- Ruston
- Harahan
- Lafayette
For more Louisiana reading, check out:
- Best Places To Live In Louisiana
- Cheapest Places To Live In Louisiana
- Most Dangerous Places In Louisiana
- Richest Cities In Louisiana
- Safest Places In Louisiana
- Worst Places To Live In Louisiana
- Most Expensive Places To Live In Louisiana
Miserable Cities In Louisiana For 2023
| Rank | City | Population | Poverty Level | Median Home Value | % Married | % Kids |
|---|---|---|---|---|---|---|
| 1 | Bogalusa, LA | 10,921 | 32.3% | $96,500 | 22.0% | 37.06% |
| 2 | Baker, LA | 12,736 | 14.9% | $127,900 | 24.0% | 33.18% |
| 3 | Marksville, LA | 5,118 | 35.0% | $86,600 | 27.0% | 34.18% |
| 4 | Ville Platte, LA | 6,488 | 41.5% | $63,800 | 21.0% | 31.55% |
| 5 | Bastrop, LA | 9,879 | 44.0% | $82,000 | 22.0% | 32.43% |
| 6 | Opelousas, LA | 15,884 | 37.2% | $105,700 | 25.0% | 35.88% |
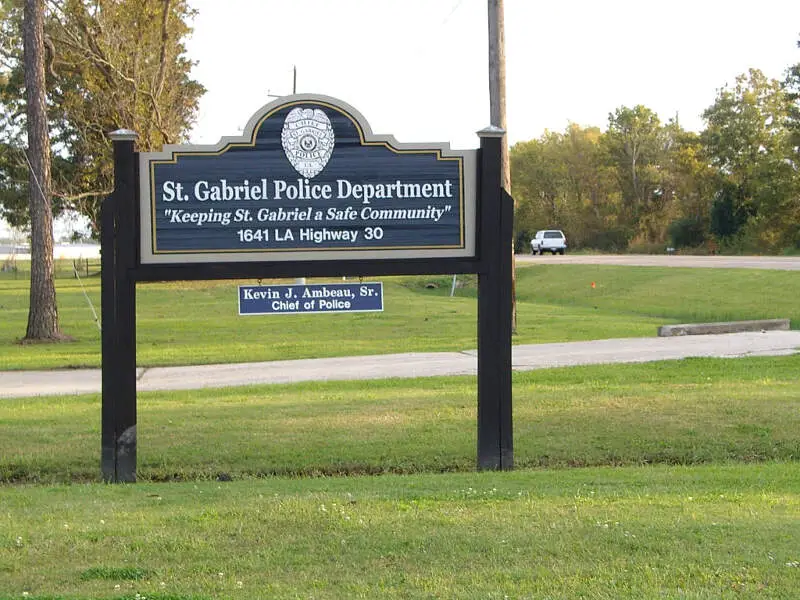
| 7 | St. Gabriel, LA | 7,046 | 11.7% | $184,500 | 16.0% | 36.4% |
| 8 | Oakdale, LA | 7,092 | 24.7% | $94,400 | 25.0% | 27.59% |
| 9 | Donaldsonville, LA | 6,834 | 46.9% | $149,700 | 29.0% | 37.91% |
| 10 | Jennings, LA | 9,836 | 19.9% | $124,300 | 36.0% | 38.5% |
| 11 | St. Martinville, LA | 5,602 | 24.5% | $96,400 | 27.0% | 19.5% |
| 12 | Abbeville, LA | 11,313 | 30.6% | $88,200 | 25.0% | 32.91% |
| 13 | Deridder, LA | 10,060 | 19.0% | $137,200 | 19.0% | 30.55% |
| 14 | Denham Springs, LA | 9,389 | 5.2% | $166,000 | 21.0% | 32.22% |
| 15 | Eunice, LA | 9,589 | 33.8% | $107,500 | 28.0% | 33.11% |
| 16 | Patterson, LA | 5,928 | 18.5% | $114,300 | 39.0% | 31.74% |
| 17 | New Iberia, LA | 28,844 | 27.8% | $123,700 | 32.0% | 35.52% |
| 18 | Tallulah, LA | 6,357 | 42.3% | $72,200 | 15.0% | 31.92% |
| 19 | Franklin, LA | 6,811 | 22.5% | $86,800 | 27.0% | 25.24% |
| 20 | Walker, LA | 6,322 | 8.9% | $170,200 | 27.0% | 36.39% |
| 21 | Leesville, LA | 5,666 | 33.5% | $90,800 | 11.0% | 31.49% |
| 22 | Rayne, LA | 7,332 | 27.1% | $134,600 | 39.0% | 33.22% |
| 23 | Breaux Bridge, LA | 7,711 | 26.0% | $155,200 | 35.0% | 33.91% |
| 24 | Gonzales, LA | 12,080 | 11.2% | $169,900 | 27.0% | 32.11% |
| 25 | Slidell, LA | 28,537 | 14.1% | $169,600 | 27.0% | 34.58% |
| 26 | Morgan City, LA | 11,525 | 21.8% | $130,500 | 29.0% | 30.22% |
| 27 | Plaquemine, LA | 6,187 | 25.6% | $159,700 | 46.0% | 36.9% |
| 28 | Bossier City, LA | 63,168 | 20.1% | $165,600 | 19.0% | 34.53% |
| 29 | Zachary, LA | 19,278 | 5.9% | $226,500 | 46.0% | 47.58% |
| 30 | Scott, LA | 8,200 | 11.8% | $125,500 | 43.0% | 28.37% |
| 31 | Crowley, LA | 11,916 | 42.3% | $130,400 | 34.0% | 31.25% |
| 32 | Alexandria, LA | 45,736 | 27.1% | $157,100 | 24.0% | 32.24% |
| 33 | Pineville, LA | 14,653 | 15.4% | $161,300 | 24.0% | 33.5% |
| 34 | Kenner, LA | 66,411 | 15.6% | $196,300 | 25.0% | 29.52% |
| 35 | Gretna, LA | 17,836 | 23.2% | $205,200 | 20.0% | 26.8% |
| 36 | Westwego, LA | 8,538 | 24.8% | $130,200 | 28.0% | 23.29% |
| 37 | Youngsville, LA | 15,167 | 5.9% | $227,400 | 54.0% | 57.08% |
| 38 | Shreveport, LA | 189,374 | 24.5% | $155,000 | 24.0% | 28.15% |
| 39 | Houma, LA | 33,461 | 19.5% | $169,600 | 36.0% | 34.44% |
| 40 | Central, LA | 29,746 | 5.9% | $247,900 | 43.0% | 35.32% |
| 41 | Carencro, LA | 9,531 | 22.1% | $184,000 | 35.0% | 33.32% |
| 42 | Sulphur, LA | 21,490 | 14.6% | $148,600 | 31.0% | 27.46% |
| 43 | Minden, LA | 12,145 | 31.5% | $106,800 | 28.0% | 28.5% |
| 44 | Monroe, LA | 48,105 | 34.9% | $149,000 | 20.0% | 28.85% |
| 45 | West Monroe, LA | 13,103 | 28.9% | $140,200 | 23.0% | 27.28% |
| 46 | Natchitoches, LA | 18,105 | 37.4% | $163,900 | 18.0% | 24.13% |
| 47 | Ponchatoula, LA | 7,729 | 23.3% | $164,700 | 33.0% | 21.6% |
| 48 | Addis, LA | 6,503 | 8.3% | $209,700 | 46.0% | 35.01% |
| 49 | Baton Rouge, LA | 225,539 | 24.4% | $191,100 | 20.0% | 25.12% |
| 50 | Broussard, LA | 12,960 | 16.9% | $236,500 | 40.0% | 40.83% |
| 51 | Covington, LA | 11,155 | 17.6% | $258,600 | 37.0% | 35.41% |
| 52 | Hammond, LA | 19,374 | 37.0% | $174,400 | 17.0% | 30.74% |
| 53 | New Orleans, LA | 383,974 | 23.8% | $255,500 | 17.0% | 21.25% |
| 54 | Mandeville, LA | 12,985 | 7.6% | $323,200 | 32.0% | 31.51% |
| 55 | Thibodaux, LA | 15,242 | 18.2% | $188,300 | 34.0% | 26.63% |
| 56 | Lake Charles, LA | 83,444 | 20.8% | $169,300 | 29.0% | 25.87% |
| 57 | Grambling, LA | 5,127 | 48.5% | $113,800 | 16.0% | 26.84% |
| 58 | Lafayette, LA | 122,469 | 19.5% | $209,100 | 29.0% | 25.0% |
| 59 | Harahan, LA | 9,137 | 8.2% | $256,700 | 41.0% | 19.01% |
| 60 | Ruston, LA | 22,286 | 35.6% | $195,800 | 15.0% | 23.72% |