
Do you live in one of the most miserable places in Massachusetts?
Only a third of Bay Staters say they are truly happy. That’s too bad, considering that folks in Massachusetts don’t really have it too bad in the grand scheme of things.
But, we were curious – which Massachusetts cities might be the most miserable? We’re about to find out, using Saturday Night Science and data.
After analyzing the 52 largest cities, we sadly present the most miserable cities in the Bay State.
Table Of Contents: Top Ten | Methodology | Summary | Table
The 10 Most Miserable Places In Massachusetts
Read on below to see how we crunched the numbers and how your town ranked. If you have a smile on your face, you probably don’t live in one of these cities.
Oh, and by the way, Cambridge is the happiest place in Massachusetts.
For more Massachusetts reading, check out:
The 10 Most Miserable Places In Massachusetts For 2023
/10
Population: 104,216
Poverty Level: 11.5%
Median Home Price $307,600
Married Households 14.0%
Households With Kids 40.1%
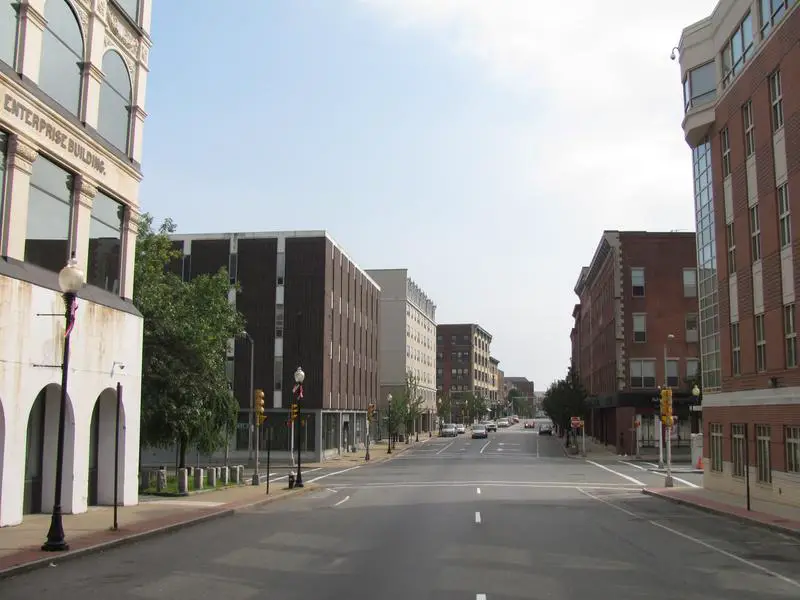
More on Brockton: Data | Crime | Cost Of Living
/10
Population: 40,025
Poverty Level: 22.5%
Median Home Price $383,800
Married Households 5.0%
Households With Kids 33.49%
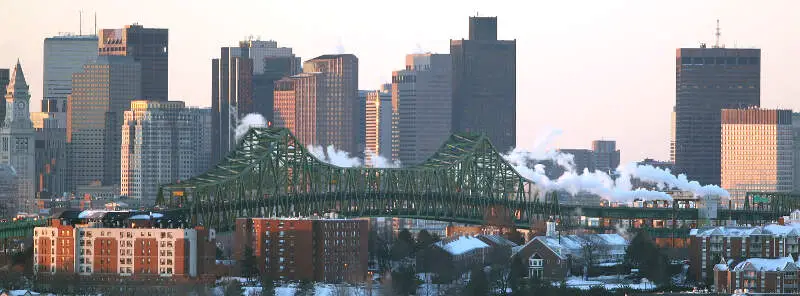
More on Chelsea: Data | Crime | Cost Of Living
/10
Population: 87,798
Poverty Level: 19.2%
Median Home Price $311,500
Married Households 6.0%
Households With Kids 40.87%
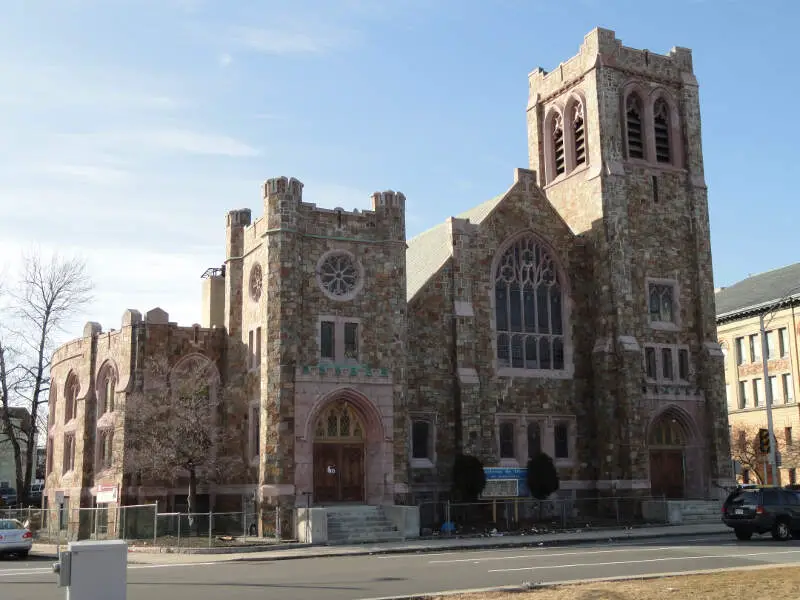
More on Lawrence: Data | Crime | Cost Of Living
/10
Population: 48,368
Poverty Level: 12.8%
Median Home Price $477,100
Married Households 12.0%
Households With Kids 36.4%
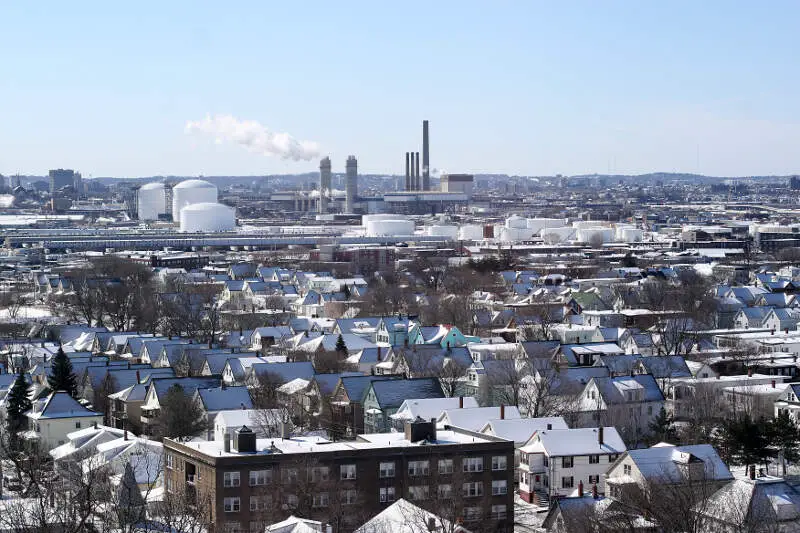
More on Everett: Data | Crime | Cost Of Living
/10
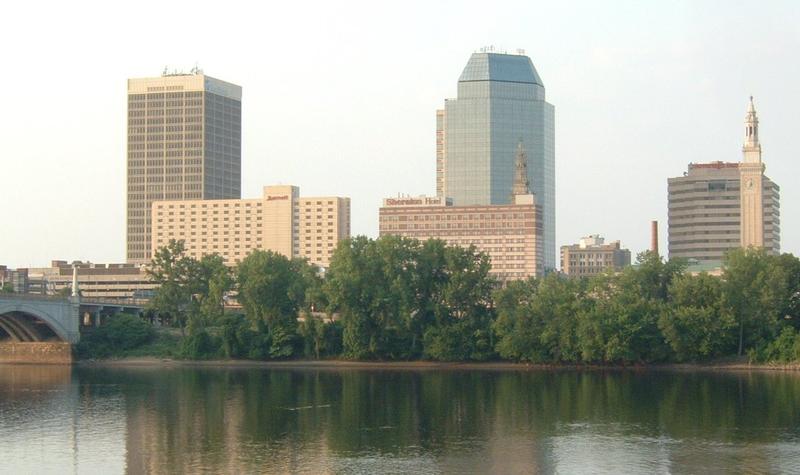
Population: 155,770
Poverty Level: 26.3%
Median Home Price $168,700
Married Households 12.0%
Households With Kids 33.78%
More on Springfield: Data | Crime | Cost Of Living
/10
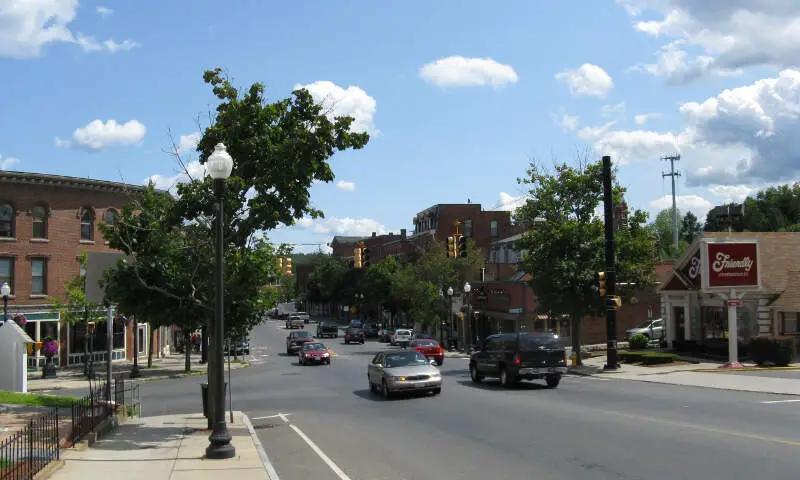
Population: 17,643
Poverty Level: 20.2%
Median Home Price $222,900
Married Households 22.0%
Households With Kids 31.31%
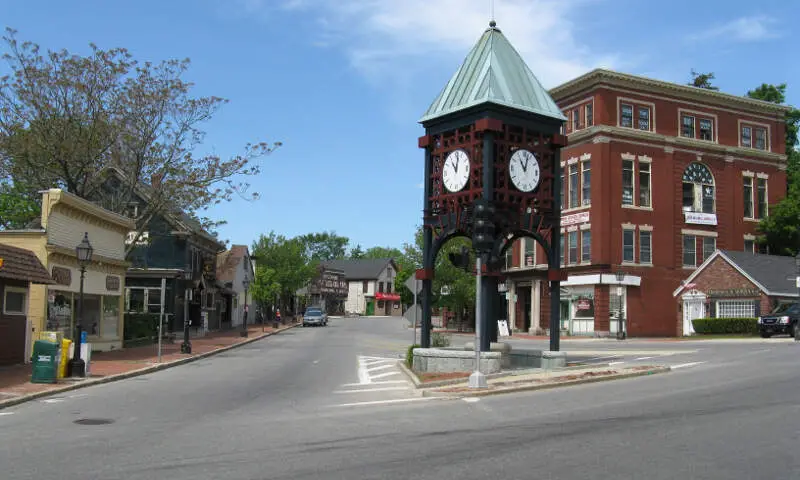
More on Southbridge Town: Data | Cost Of Living
/10
Population: 60,720
Poverty Level: 13.0%
Median Home Price $431,200
Married Households 15.0%
Households With Kids 29.73%
More on Revere: Data | Crime | Cost Of Living
/10
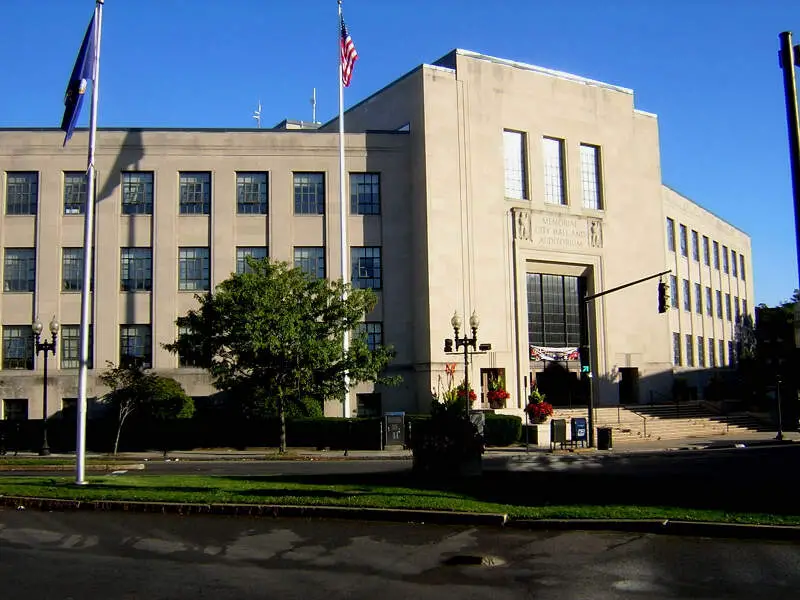
Population: 100,233
Poverty Level: 14.9%
Median Home Price $378,400
Married Households 14.0%
Households With Kids 35.67%
More on Lynn: Data | Crime | Cost Of Living
/10
Population: 100,309
Poverty Level: 18.7%
Median Home Price $258,300
Married Households 18.0%
Households With Kids 30.91%
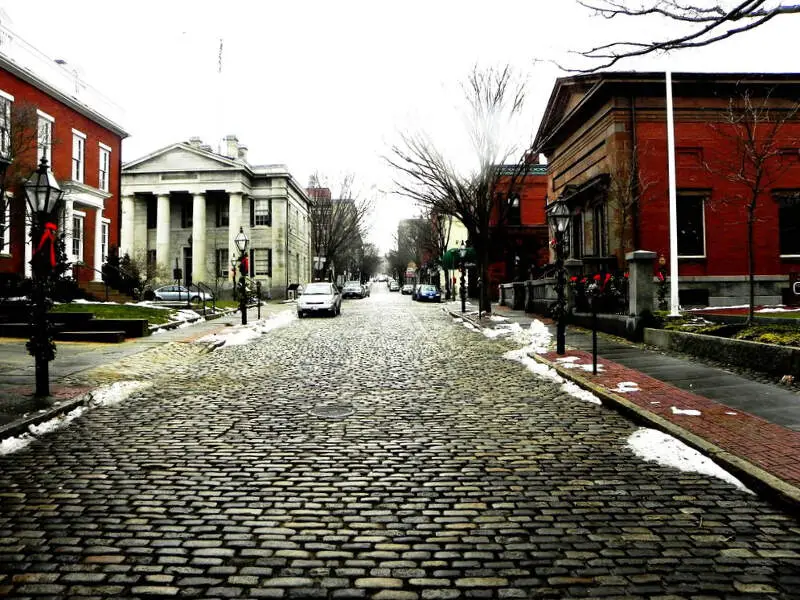
More on New Bedford: Data | Crime | Cost Of Living
/10
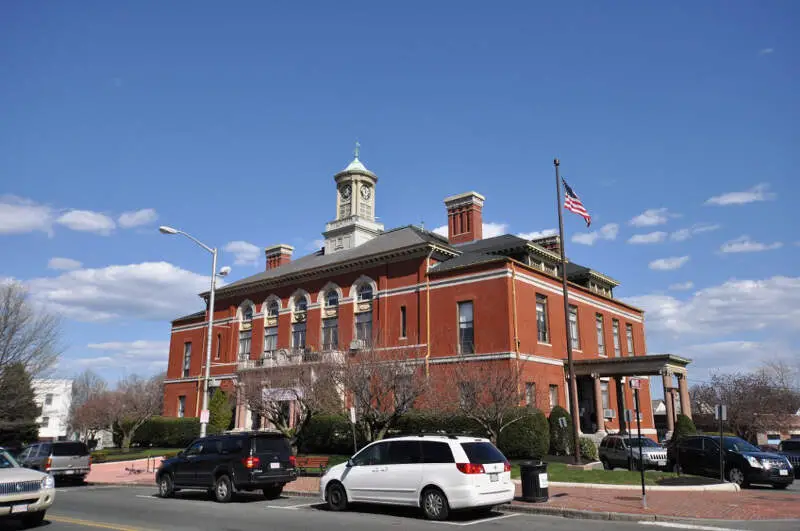
Population: 52,536
Poverty Level: 9.7%
Median Home Price $371,300
Married Households 25.0%
Households With Kids 33.24%
More on Methuen Town: Data | Cost Of Living
Methodology: How We Measured The Most Miserable Cities In The Bay State
To rank the unhappiest places in Massachusetts, we had to determine what criteria make people happy. It isn’t a stretch to assume that happy people earn great salaries, are relatively stress-free, and have a stable home life.
So we went to the Census’s American Community Survey 2017-2021 report for the happy criteria, flipped the list with Saturday Night Science, and it spit out the answer.
Like magic.
Here are the criteria we used to measure misery:
- Percentage of residents with a college degree
- Average commute times
- Unemployment rates
- Cost of living
- % of married couples
- % of families with kids
- Poverty rate
After we decided on the criteria, we gathered the data for the 52 places in Massachusetts with over 12,000 people.
We then ranked each place from one to 52 for each of the seven criteria, with a score of one being the most miserable (Any ties were given to the larger place).
Next, we averaged the seven rankings into a Miserable Index for each place with the lowest overall Miserable Index “earning” the title “Most Miserable City In Massachusetts.”
If you’d like to see the complete list of states, most miserable to happiest, scroll to the bottom of this post to see the unabridged chart.
We updated this article for 2023, and it’s our tenth time ranking the most miserable cities in Massachusetts.
There You Have It – The Least Happy Cities In Massachusetts
As we said earlier, trying to determine the most miserable cities in Massachusetts is usually a subjective matter.
But if you’re analyzing cities where people are not stable, where you’re stuck in traffic, and no one spent the time to go to college, then this is an accurate list.
If you’re curious enough, here are the happiest cities in Massachusetts, according to science:
- Cambridge
- Waltham
- Beverly
For more Massachusetts reading, check out:
- Best Places To Live In Massachusetts
- Cheapest Places To Live In Massachusetts
- Most Dangerous Cities In Massachusetts
- Richest Cities In Massachusetts
- Safest Places In Massachusetts
- Worst Places To Live In Massachusetts
- Most Expensive Places To Live In Massachusetts
Miserable Cities In Massachusetts For 2023
| Rank | City | Population | Poverty Level | Median Home Value | % Married | % Kids |
|---|---|---|---|---|---|---|
| 1 | Brockton, MA | 104,216 | 11.5% | $307,600 | 14.0% | 40.1% |
| 2 | Chelsea, MA | 40,025 | 22.5% | $383,800 | 5.0% | 33.49% |
| 3 | Lawrence, MA | 87,798 | 19.2% | $311,500 | 6.0% | 40.87% |
| 4 | Everett, MA | 48,368 | 12.8% | $477,100 | 12.0% | 36.4% |
| 5 | Springfield, MA | 155,770 | 26.3% | $168,700 | 12.0% | 33.78% |
| 6 | Southbridge Town, MA | 17,643 | 20.2% | $222,900 | 22.0% | 31.31% |
| 7 | Revere, MA | 60,720 | 13.0% | $431,200 | 15.0% | 29.73% |
| 8 | Lynn, MA | 100,233 | 14.9% | $378,400 | 14.0% | 35.67% |
| 9 | New Bedford, MA | 100,309 | 18.7% | $258,300 | 18.0% | 30.91% |
| 10 | Methuen Town, MA | 52,536 | 9.7% | $371,300 | 25.0% | 33.24% |
| 11 | Gardner, MA | 21,183 | 14.1% | $200,300 | 31.0% | 25.62% |
| 12 | Fall River, MA | 93,339 | 19.0% | $282,500 | 18.0% | 29.46% |
| 13 | Fitchburg, MA | 41,796 | 14.6% | $232,400 | 20.0% | 29.25% |
| 14 | Attleboro, MA | 46,146 | 9.1% | $332,100 | 23.0% | 31.93% |
| 15 | Holyoke, MA | 38,480 | 26.5% | $209,900 | 16.0% | 30.36% |
| 16 | Leominster, MA | 43,478 | 7.9% | $275,300 | 26.0% | 29.42% |
| 17 | Malden, MA | 65,602 | 14.7% | $491,300 | 14.0% | 29.74% |
| 18 | Lowell, MA | 114,804 | 17.5% | $312,600 | 14.0% | 30.97% |
| 19 | Haverhill, MA | 67,093 | 10.8% | $347,000 | 27.0% | 32.6% |
| 20 | Taunton, MA | 59,076 | 13.5% | $313,300 | 27.0% | 32.42% |
| 21 | Franklin Town, MA | 33,057 | 5.5% | $450,800 | 33.0% | 36.82% |
| 22 | Palmer Town, MA | 12,434 | 9.6% | $208,500 | 35.0% | 25.27% |
| 23 | Marlborough, MA | 41,505 | 8.3% | $382,900 | 20.0% | 27.86% |
| 24 | Worcester, MA | 203,867 | 19.3% | $259,800 | 13.0% | 27.56% |
| 25 | Quincy, MA | 100,544 | 10.8% | $481,600 | 15.0% | 21.85% |
| 26 | Chicopee, MA | 55,636 | 14.6% | $198,000 | 25.0% | 26.18% |
| 27 | Westfield, MA | 40,922 | 6.9% | $256,300 | 26.0% | 27.48% |
| 28 | Amesbury Town, MA | 17,286 | 5.8% | $379,900 | 31.0% | 30.59% |
| 29 | Weymouth Town, MA | 57,217 | 6.0% | $416,000 | 31.0% | 22.75% |
| 30 | Braintree Town, MA | 38,712 | 4.2% | $524,900 | 28.0% | 33.2% |
| 31 | Pittsfield, MA | 43,890 | 12.7% | $183,600 | 26.0% | 23.31% |
| 32 | West Springfield Town, MA | 28,814 | 9.7% | $251,600 | 25.0% | 25.26% |
| 33 | Newton, MA | 88,647 | 4.2% | $992,800 | 15.0% | 34.22% |
| 34 | Melrose, MA | 29,567 | 3.4% | $638,800 | 27.0% | 29.58% |
| 35 | Woburn, MA | 40,967 | 6.4% | $528,200 | 28.0% | 29.08% |
| 36 | Newburyport, MA | 18,282 | 5.8% | $643,300 | 32.0% | 26.67% |
| 37 | Winthrop Town, MA | 19,088 | 8.3% | $516,700 | 24.0% | 21.9% |
| 38 | Agawam Town, MA | 28,715 | 7.0% | $248,800 | 33.0% | 25.07% |
| 39 | North Adams, MA | 13,024 | 14.2% | $152,200 | 26.0% | 23.97% |
| 40 | Watertown Town, MA | 35,171 | 7.2% | $641,500 | 16.0% | 22.09% |
| 41 | Boston, MA | 672,814 | 17.6% | $610,400 | 9.0% | 21.1% |
| 42 | Easthampton Town, MA | 16,120 | 7.2% | $281,100 | 29.0% | 22.67% |
| 43 | Peabody, MA | 54,200 | 8.1% | $441,100 | 33.0% | 24.43% |
| 44 | Northampton, MA | 29,379 | 11.4% | $341,600 | 15.0% | 23.99% |
| 45 | Salem, MA | 44,452 | 14.9% | $396,700 | 20.0% | 21.47% |
| 46 | Medford, MA | 60,708 | 7.6% | $588,100 | 18.0% | 21.0% |
| 47 | Barnstable Town, MA | 48,556 | 7.9% | $430,100 | 26.0% | 24.32% |
| 48 | Gloucester, MA | 29,814 | 9.3% | $460,400 | 33.0% | 21.64% |
| 49 | Somerville, MA | 80,608 | 10.4% | $739,900 | 9.0% | 15.29% |
| 50 | Beverly, MA | 42,448 | 10.0% | $485,800 | 29.0% | 26.81% |
| 51 | Waltham, MA | 64,655 | 8.8% | $602,200 | 16.0% | 19.92% |
| 52 | Cambridge, MA | 116,892 | 12.3% | $888,000 | 6.0% | 17.62% |