
Do you live in one of the most miserable places in Michigan?
Only a third of Michiganders say they are truly happy. That’s too bad, considering that folks in Michigan don’t really have it too bad in the grand scheme of things.
But, we were curious – which Michigan cities might be the most miserable? We’re about to find out, using Saturday Night Science and data.
After analyzing the 154 largest cities, we sadly present the most miserable cities in the Wolverine State.
Table Of Contents: Top Ten | Methodology | Summary | Table
The 10 Most Miserable Places In Michigan
Read on below to see how we crunched the numbers and how your town ranked. If you have a smile on your face, you probably don’t live in one of these cities.
Oh, and by the way, Ann Arbor is the happiest place in Michigan.
For more Michigan reading, check out:
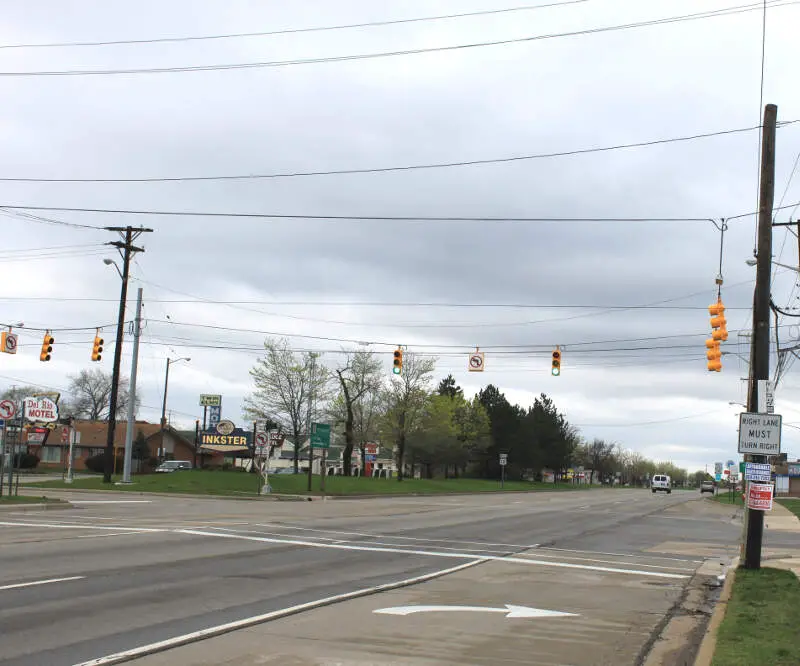
The 10 Most Miserable Places In Michigan For 2023
/10
Population: 25,849
Poverty Level: 37.8%
Median Home Price $59,900
Married Households 18.0%
Households With Kids 35.27%
More on Inkster: Data | Crime | Cost Of Living
/10
Population: 9,328
Poverty Level: 27.8%
Median Home Price $50,400
Married Households 16.0%
Households With Kids 29.81%
More on Ecorse: Data | Crime | Cost Of Living
/10
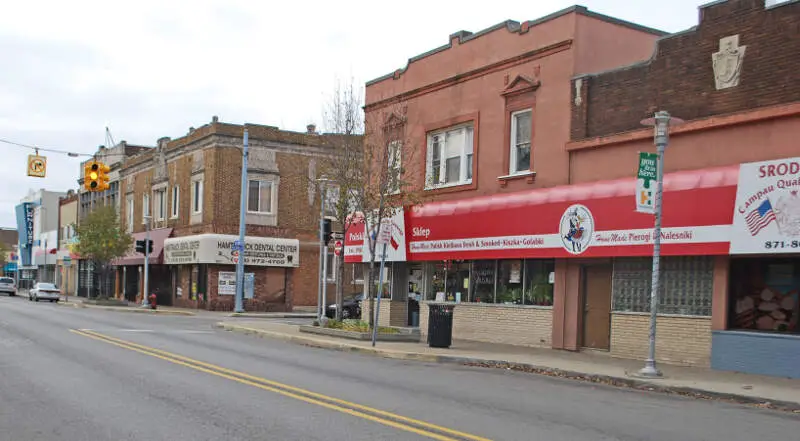
Population: 27,548
Poverty Level: 43.1%
Median Home Price $81,100
Married Households 6.0%
Households With Kids 46.68%
More on Hamtramck: Data | Crime | Cost Of Living
/10
Population: 10,058
Poverty Level: 33.7%
Median Home Price $45,500
Married Households 13.0%
Households With Kids 40.87%
More on Muskegon Heights: Data | Crime | Cost Of Living

/10
Population: 12,534
Poverty Level: 28.0%
Median Home Price $82,500
Married Households 17.0%
Households With Kids 27.54%
More on Melvindale: Data | Crime | Cost Of Living
/10
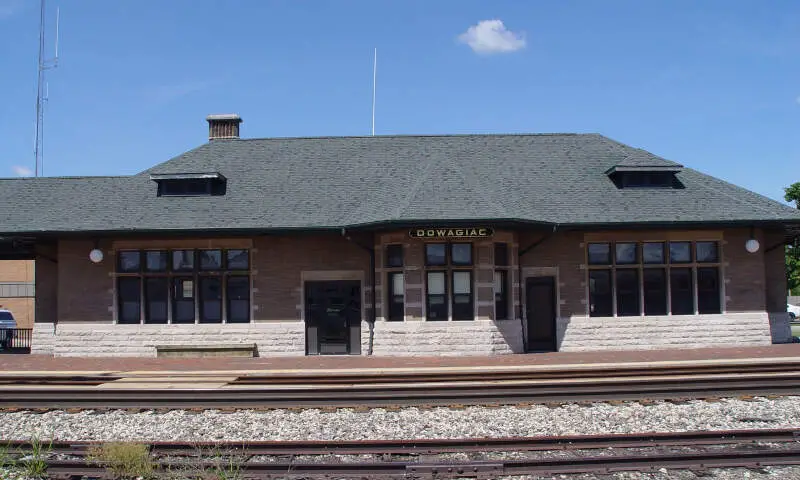
Population: 5,731
Poverty Level: 30.4%
Median Home Price $76,200
Married Households 19.0%
Households With Kids 32.17%
More on Dowagiac: Data | Crime | Cost Of Living
/10
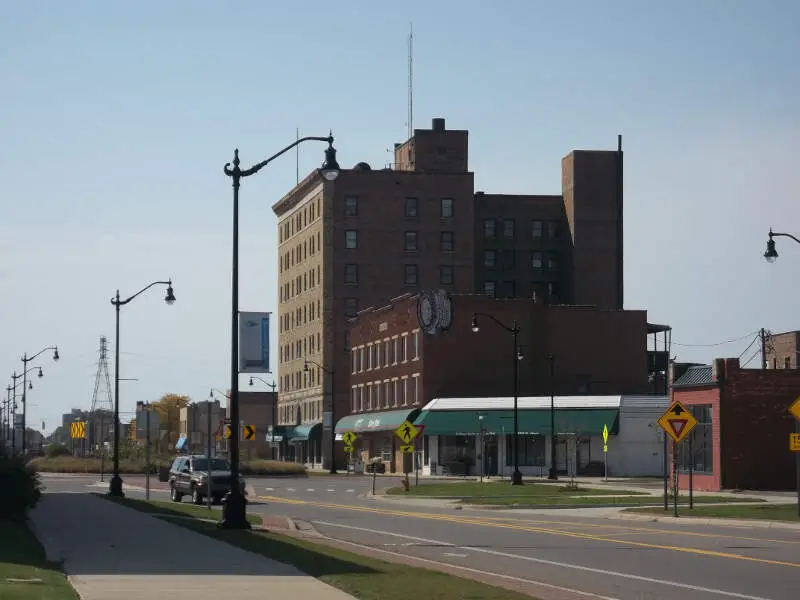
Population: 9,171
Poverty Level: 43.6%
Median Home Price $61,000
Married Households 11.0%
Households With Kids 43.55%
More on Benton Harbor: Data | Crime | Cost Of Living
/10
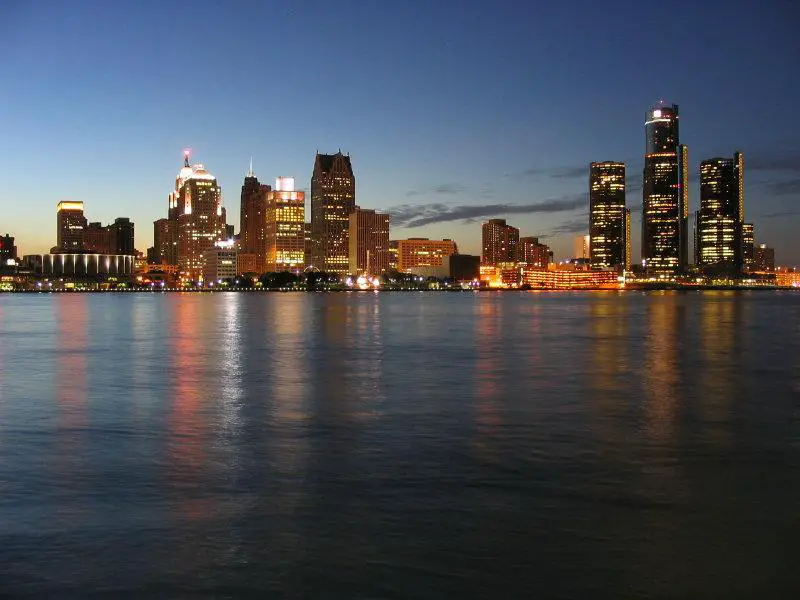
Population: 645,658
Poverty Level: 31.8%
Median Home Price $57,700
Married Households 12.0%
Households With Kids 28.04%
More on Detroit: Data | Crime | Cost Of Living
/10
Population: 34,148
Poverty Level: 17.1%
Median Home Price $93,800
Married Households 25.0%
Households With Kids 28.98%
More on Eastpointe: Data | Crime | Cost Of Living
/10
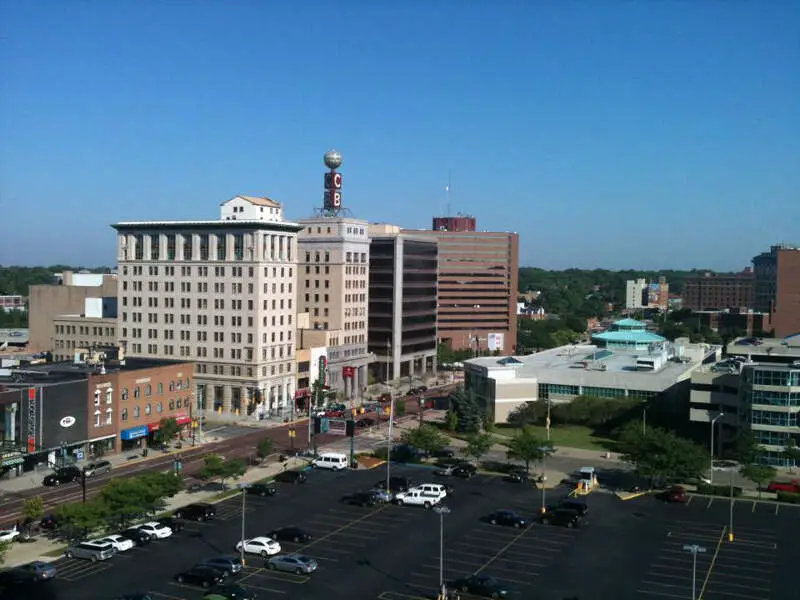
Population: 83,312
Poverty Level: 35.5%
Median Home Price $35,000
Married Households 17.0%
Households With Kids 29.59%
More on Flint: Data | Crime | Cost Of Living
Methodology: How We Measured The Most Miserable Cities In The Wolverine State
To rank the unhappiest places in Michigan, we had to determine what criteria make people happy. It isn’t a stretch to assume that happy people earn great salaries, are relatively stress-free, and have a stable home life.
So we went to the Census’s American Community Survey 2017-2021 report for the happy criteria, flipped the list with Saturday Night Science, and it spit out the answer.
Like magic.
Here are the criteria we used to measure misery:
- Percentage of residents with a college degree
- Average commute times
- Unemployment rates
- Cost of living
- % of married couples
- % of families with kids
- Poverty rate
After we decided on the criteria, we gathered the data for the 154 places in Michigan with over 5,000 people.
We then ranked each place from one to 154 for each of the seven criteria, with a score of one being the most miserable (Any ties were given to the larger place).
Next, we averaged the seven rankings into a Miserable Index for each place with the lowest overall Miserable Index “earning” the title “Most Miserable City In Michigan.”
If you’d like to see the complete list of states, most miserable to happiest, scroll to the bottom of this post to see the unabridged chart.
We updated this article for 2023, and it’s our tenth time ranking the most miserable cities in Michigan.
There You Have It – The Least Happy Cities In Michigan
As we said earlier, trying to determine the most miserable cities in Michigan is usually a subjective matter.
But if you’re analyzing cities where people are not stable, where you’re stuck in traffic, and no one spent the time to go to college, then this is an accurate list.
If you’re curious enough, here are the happiest cities in Michigan, according to science:
- Ann Arbor
- Frankenmuth
- St. Joseph
For more Michigan reading, check out:
- Best Places To Live In Michigan
- Cheapest Places To Live In Michigan
- Most Dangerous Places in Michigan
- Richest Cities In Michigan
- Safest Places In Michigan
- Worst Places To Live In Michigan
- Most Expensive Places To Live In Michigan
Miserable Cities In Michigan For 2023
| Rank | City | Population | Poverty Level | Median Home Value | % Married | % Kids |
|---|---|---|---|---|---|---|
| 1 | Inkster, MI | 25,849 | 37.8% | $59,900 | 18.0% | 35.27% |
| 2 | Ecorse, MI | 9,328 | 27.8% | $50,400 | 16.0% | 29.81% |
| 3 | Hamtramck, MI | 27,548 | 43.1% | $81,100 | 6.0% | 46.68% |
| 4 | Muskegon Heights, MI | 10,058 | 33.7% | $45,500 | 13.0% | 40.87% |
| 5 | Melvindale, MI | 12,534 | 28.0% | $82,500 | 17.0% | 27.54% |
| 6 | Dowagiac, MI | 5,731 | 30.4% | $76,200 | 19.0% | 32.17% |
| 7 | Benton Harbor, MI | 9,171 | 43.6% | $61,000 | 11.0% | 43.55% |
| 8 | Detroit, MI | 645,658 | 31.8% | $57,700 | 12.0% | 28.04% |
| 9 | Eastpointe, MI | 34,148 | 17.1% | $93,800 | 25.0% | 28.98% |
| 10 | Flint, MI | 83,312 | 35.5% | $35,000 | 17.0% | 29.59% |
| 11 | Pontiac, MI | 61,498 | 27.7% | $78,900 | 13.0% | 30.76% |
| 12 | Muskegon, MI | 37,632 | 22.5% | $84,300 | 19.0% | 31.41% |
| 13 | Three Rivers, MI | 7,946 | 14.2% | $87,100 | 20.0% | 33.15% |
| 14 | Belding, MI | 6,070 | 17.7% | $109,200 | 35.0% | 43.13% |
| 15 | Romulus, MI | 24,977 | 12.7% | $118,200 | 32.0% | 34.8% |
| 16 | Ionia, MI | 11,655 | 16.1% | $122,200 | 22.0% | 34.15% |
| 17 | River Rouge, MI | 7,257 | 45.7% | $34,000 | 20.0% | 23.0% |
| 18 | Albion, MI | 8,061 | 28.5% | $65,800 | 20.0% | 31.51% |
| 19 | Saginaw, MI | 44,796 | 35.6% | $43,900 | 21.0% | 29.54% |
| 20 | Roseville, MI | 47,692 | 13.5% | $107,300 | 30.0% | 26.0% |
| 21 | Harper Woods, MI | 15,287 | 21.6% | $111,200 | 23.0% | 31.04% |
| 22 | Tecumseh, MI | 8,645 | 3.9% | $156,800 | 38.0% | 35.32% |
| 23 | Niles, MI | 11,929 | 22.2% | $86,800 | 20.0% | 26.91% |
| 24 | Lincoln Park, MI | 39,741 | 20.9% | $91,400 | 27.0% | 26.87% |
| 25 | Wayne, MI | 17,624 | 19.8% | $108,900 | 29.0% | 26.42% |
| 26 | Charlotte, MI | 9,224 | 11.1% | $115,100 | 31.0% | 34.48% |
| 27 | St. Louis, MI | 7,435 | 13.8% | $85,600 | 23.0% | 29.03% |
| 28 | Highland Park, MI | 9,304 | 40.7% | $51,000 | 10.0% | 18.36% |
| 29 | Coldwater, MI | 13,764 | 15.0% | $99,800 | 20.0% | 34.98% |
| 30 | Dearborn Heights, MI | 62,334 | 20.2% | $134,800 | 22.0% | 33.02% |
| 31 | Flat Rock, MI | 10,439 | 14.4% | $159,000 | 36.0% | 38.15% |
| 32 | Center Line, MI | 8,515 | 11.3% | $110,800 | 29.0% | 25.16% |
| 33 | Sturgis, MI | 11,067 | 20.6% | $93,500 | 25.0% | 33.0% |
| 34 | Greenville, MI | 9,057 | 11.9% | $120,000 | 30.0% | 27.9% |
| 35 | Garden City, MI | 27,268 | 11.0% | $131,300 | 36.0% | 28.28% |
| 36 | Jackson, MI | 31,810 | 23.8% | $76,400 | 25.0% | 28.04% |
| 37 | Warren, MI | 138,996 | 15.3% | $143,600 | 27.0% | 27.48% |
| 38 | Springfield, MI | 5,268 | 22.6% | $78,200 | 24.0% | 28.36% |
| 39 | Taylor, MI | 63,071 | 15.0% | $116,600 | 30.0% | 28.36% |
| 40 | Adrian, MI | 20,674 | 26.0% | $85,700 | 19.0% | 29.98% |
| 41 | St. Clair, MI | 5,489 | 4.7% | $166,700 | 41.0% | 30.18% |
| 42 | Burton, MI | 29,532 | 16.2% | $104,300 | 33.0% | 26.83% |
| 43 | Fraser, MI | 14,703 | 10.9% | $162,600 | 32.0% | 28.88% |
| 44 | Ironwood, MI | 5,147 | 11.9% | $60,000 | 25.0% | 18.92% |
| 45 | New Haven, MI | 6,035 | 21.6% | $158,300 | 36.0% | 49.68% |
| 46 | Battle Creek, MI | 52,434 | 22.0% | $97,600 | 25.0% | 29.64% |
| 47 | Richmond, MI | 5,871 | 19.5% | $192,400 | 31.0% | 29.19% |
| 48 | Mount Clemens, MI | 15,735 | 19.1% | $128,700 | 27.0% | 24.39% |
| 49 | Novi, MI | 65,369 | 4.0% | $336,000 | 25.0% | 35.24% |
| 50 | Milan, MI | 6,156 | 7.1% | $185,600 | 31.0% | 31.5% |
| 51 | Hastings, MI | 7,480 | 11.9% | $120,900 | 33.0% | 27.17% |
| 52 | Wyoming, MI | 76,625 | 11.4% | $150,000 | 31.0% | 36.09% |
| 53 | Dundee, MI | 5,252 | 5.4% | $204,500 | 26.0% | 22.9% |
| 54 | Owosso, MI | 14,708 | 13.4% | $95,600 | 34.0% | 29.05% |
| 55 | Eaton Rapids, MI | 5,211 | 10.2% | $117,000 | 37.0% | 34.54% |
| 56 | Westland, MI | 84,961 | 13.6% | $143,500 | 25.0% | 25.86% |
| 57 | Monroe, MI | 20,344 | 17.0% | $134,100 | 31.0% | 28.69% |
| 58 | Port Huron, MI | 29,009 | 22.0% | $106,200 | 32.0% | 28.06% |
| 59 | Lapeer, MI | 8,911 | 22.5% | $122,500 | 25.0% | 22.99% |
| 60 | Holly, MI | 6,031 | 12.8% | $133,400 | 37.0% | 22.85% |
| 61 | Lansing, MI | 113,592 | 21.8% | $95,400 | 21.0% | 24.7% |
| 62 | Swartz Creek, MI | 5,839 | 7.0% | $125,600 | 39.0% | 28.05% |
| 63 | Ishpeming, MI | 6,223 | 14.4% | $92,900 | 34.0% | 30.7% |
| 64 | Bay City, MI | 32,824 | 23.6% | $71,300 | 31.0% | 26.44% |
| 65 | Dearborn, MI | 107,985 | 24.7% | $162,900 | 19.0% | 36.86% |
| 66 | Hazel Park, MI | 15,213 | 18.3% | $104,800 | 25.0% | 22.94% |
| 67 | Gladstone, MI | 5,210 | 17.7% | $96,000 | 32.0% | 31.28% |
| 68 | Flushing, MI | 8,356 | 9.8% | $139,800 | 41.0% | 30.36% |
| 69 | Sterling Heights, MI | 134,062 | 9.8% | $213,200 | 27.0% | 27.43% |
| 70 | Menominee, MI | 8,449 | 14.1% | $82,100 | 21.0% | 17.35% |
| 71 | Southgate, MI | 29,990 | 10.7% | $133,300 | 33.0% | 25.76% |
| 72 | Alma, MI | 9,426 | 24.2% | $86,000 | 32.0% | 23.74% |
| 73 | Hudsonville, MI | 7,598 | 5.3% | $180,300 | 50.0% | 49.07% |
| 74 | Allegan, MI | 5,165 | 14.1% | $137,900 | 35.0% | 31.87% |
| 75 | Troy, MI | 86,912 | 5.3% | $335,000 | 27.0% | 33.26% |
| 76 | Sault Ste. Marie, MI | 13,523 | 22.0% | $104,100 | 23.0% | 26.04% |
| 77 | Saline, MI | 9,072 | 6.5% | $261,000 | 27.0% | 26.64% |
| 78 | New Baltimore, MI | 12,147 | 6.3% | $245,400 | 45.0% | 34.48% |
| 79 | Marysville, MI | 9,925 | 6.7% | $144,500 | 43.0% | 29.17% |
| 80 | Rockford, MI | 6,131 | 8.2% | $229,600 | 41.0% | 32.45% |
| 81 | Southfield, MI | 76,196 | 11.1% | $176,000 | 22.0% | 23.41% |
| 82 | Davison, MI | 5,103 | 18.8% | $128,100 | 34.0% | 30.1% |
| 83 | Oak Park, MI | 29,677 | 13.0% | $143,700 | 22.0% | 22.99% |
| 84 | Kingsford, MI | 5,159 | 14.5% | $94,800 | 31.0% | 30.51% |
| 85 | Walled Lake, MI | 7,263 | 12.6% | $162,800 | 23.0% | 22.66% |
| 86 | Rochester Hills, MI | 75,990 | 4.3% | $313,900 | 32.0% | 32.28% |
| 87 | Fenton, MI | 11,949 | 9.7% | $168,800 | 40.0% | 27.54% |
| 88 | Alpena, MI | 10,181 | 18.4% | $88,600 | 33.0% | 23.3% |
| 89 | Allen Park, MI | 28,431 | 8.6% | $142,300 | 41.0% | 28.96% |
| 90 | Escanaba, MI | 12,439 | 17.3% | $91,300 | 31.0% | 25.81% |
| 91 | St. Clair Shores, MI | 59,046 | 7.6% | $157,000 | 38.0% | 20.54% |
| 92 | Grand Blanc, MI | 8,055 | 8.3% | $199,900 | 32.0% | 27.52% |
| 93 | Howell, MI | 10,025 | 6.2% | $198,900 | 24.0% | 21.54% |
| 94 | Portage, MI | 48,767 | 7.4% | $187,000 | 33.0% | 30.78% |
| 95 | Utica, MI | 5,188 | 9.3% | $173,600 | 27.0% | 18.33% |
| 96 | Riverview, MI | 12,465 | 8.1% | $166,100 | 36.0% | 26.89% |
| 97 | Kalamazoo, MI | 74,020 | 27.8% | $125,900 | 18.0% | 24.61% |
| 98 | Kentwood, MI | 53,884 | 10.0% | $186,000 | 24.0% | 31.74% |
| 99 | Hillsdale, MI | 8,196 | 22.5% | $108,600 | 19.0% | 29.87% |
| 100 | Plymouth, MI | 9,308 | 3.3% | $362,000 | 30.0% | 29.36% |
Lapeer is above Flint??? What???