
Do you live in one of the most miserable places in Missouri?
Only a third of Missourians say they are truly happy. That’s too bad, considering that folks in Missouri don’t really have it too bad in the grand scheme of things.
But, we were curious – which Missouri cities might be the most miserable? We’re about to find out, using Saturday Night Science and data.
After analyzing the 129 largest cities, we sadly present the most miserable cities in the Show Me State.
Table Of Contents: Top Ten | Methodology | Summary | Table
The 10 Most Miserable Places In Missouri
Read on below to see how we crunched the numbers and how your town ranked. If you have a smile on your face, you probably don’t live in one of these cities.
Oh, and by the way, Ladue is the happiest place in Missouri.
For more Missouri reading, check out:
The 10 Most Miserable Places In Missouri For 2023
/10
Population: 13,129
Poverty Level: 29.2%
Median Home Price $58,000
Married Households 14.0%
Households With Kids 26.78%
More on Jennings: Data | Cost Of Living
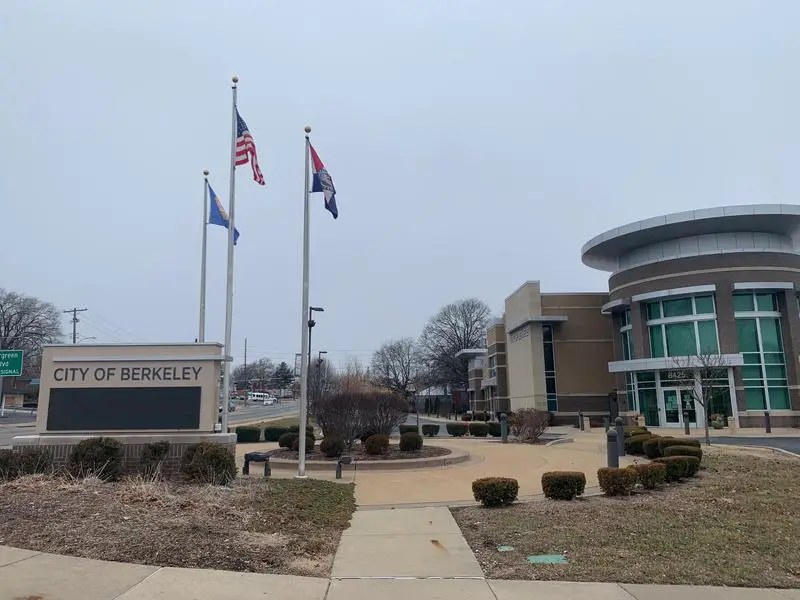
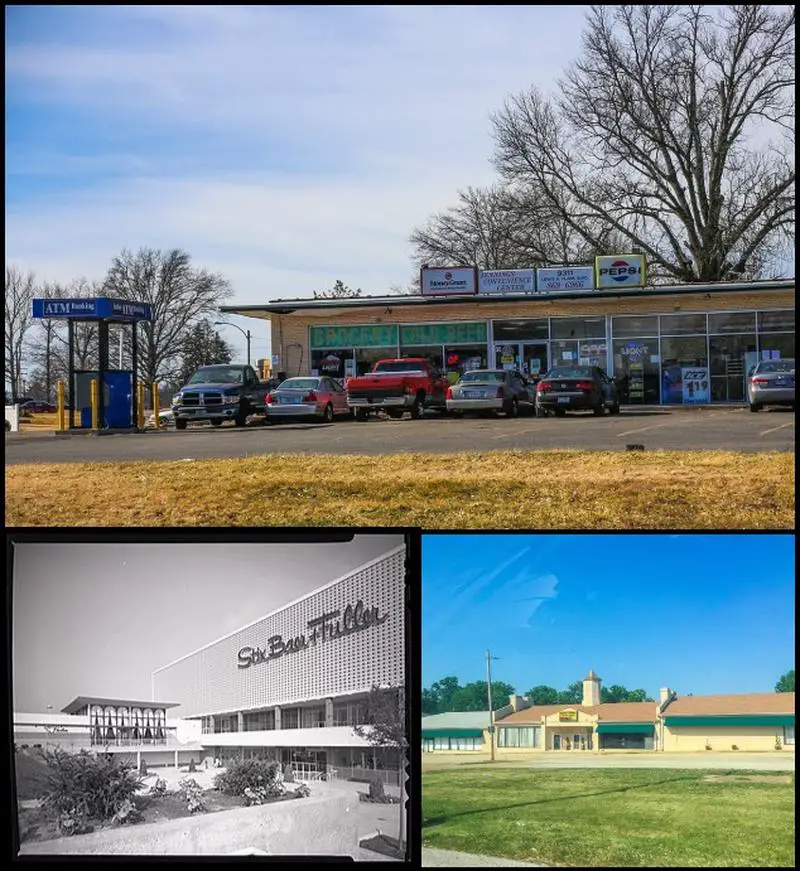
/10
Population: 8,310
Poverty Level: 23.7%
Median Home Price $66,000
Married Households 15.0%
Households With Kids 39.99%
More on Berkeley: Data | Crime | Cost Of Living
/10
Population: 6,663
Poverty Level: 19.3%
Median Home Price $141,100
Married Households 22.0%
Households With Kids 41.17%
More on Black Jack: Data | Cost Of Living
/10
Population: 6,429
Poverty Level: 13.3%
Median Home Price $119,000
Married Households 29.0%
Households With Kids 39.18%
More on De Soto: Data | Crime | Cost Of Living
/10
Population: 18,826
Poverty Level: 26.4%
Median Home Price $78,900
Married Households 20.0%
Households With Kids 32.67%
More on Ferguson: Data | Crime | Cost Of Living
/10
Population: 8,987
Poverty Level: 12.4%
Median Home Price $117,300
Married Households 18.0%
Households With Kids 30.79%
More on Cameron: Data | Crime | Cost Of Living
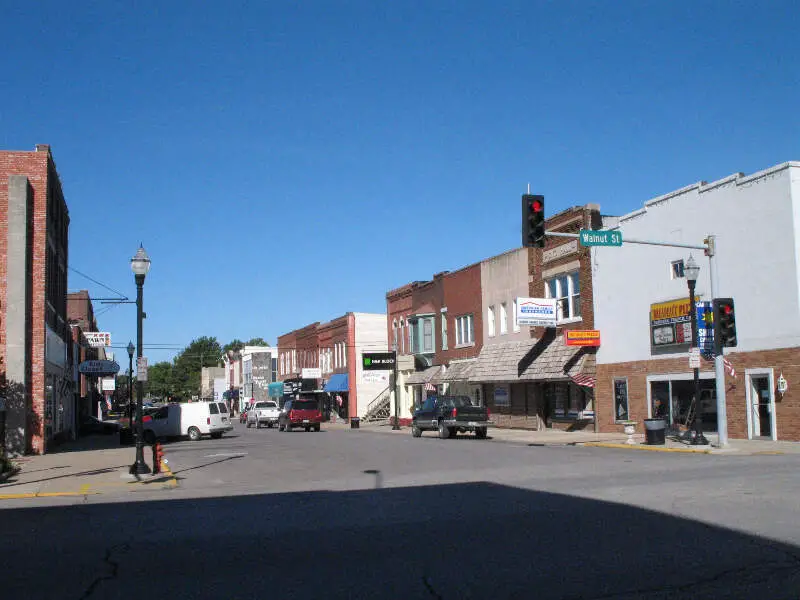
/10
Population: 7,268
Poverty Level: 17.3%
Median Home Price $84,800
Married Households 27.0%
Households With Kids 30.48%
More on Aurora: Data | Crime | Cost Of Living
/10
Population: 8,708
Poverty Level: 19.6%
Median Home Price $87,000
Married Households 37.0%
Households With Kids 39.78%
More on Park Hills: Data | Crime | Cost Of Living
/10
Population: 10,702
Poverty Level: 19.5%
Median Home Price $68,200
Married Households 24.0%
Households With Kids 28.37%
More on Bellefontaine Neighbors: Data | Crime | Cost Of Living
/10
Population: 15,908
Poverty Level: 11.2%
Median Home Price $96,300
Married Households 15.0%
Households With Kids 29.06%
More on Overland: Data | Crime | Cost Of Living
Methodology: How We Measured The Most Miserable Cities In The Show Me State
To rank the unhappiest places in Missouri, we had to determine what criteria make people happy. It isn’t a stretch to assume that happy people earn great salaries, are relatively stress-free, and have a stable home life.
So we went to the Census’s American Community Survey 2017-2021 report for the happy criteria, flipped the list with Saturday Night Science, and it spit out the answer.
Like magic.
Here are the criteria we used to measure misery:
- Percentage of residents with a college degree
- Average commute times
- Unemployment rates
- Cost of living
- % of married couples
- % of families with kids
- Poverty rate
After we decided on the criteria, we gathered the data for the 129 places in Missouri with over 5,000 people.
We then ranked each place from one to 129 for each of the seven criteria, with a score of one being the most miserable (Any ties were given to the larger place).
Next, we averaged the seven rankings into a Miserable Index for each place with the lowest overall Miserable Index “earning” the title “Most Miserable City In Missouri.”
If you’d like to see the complete list of states, most miserable to happiest, scroll to the bottom of this post to see the unabridged chart.
We updated this article for 2023, and it’s our tenth time ranking the most miserable cities in Missouri.
There You Have It – The Least Happy Cities In Missouri
As we said earlier, trying to determine the most miserable cities in Missouri is usually a subjective matter.
But if you’re analyzing cities where people are not stable, where you’re stuck in traffic, and no one spent the time to go to college, then this is an accurate list.
If you’re curious enough, here are the happiest cities in Missouri, according to science:
- Ladue
- Shrewsbury
- University City
For more Missouri reading, check out:
- Best Places To Live In Missouri
- Cheapest Places To Live In Missouri
- Most Dangerous Cities in Missouri
- Richest Cities In Missouri
- Safest Places In Missouri
- Worst Places To Live In Missouri
- Most Expensive Places To Live In Missouri
Miserable Cities In Missouri For 2023
| Rank | City | Population | Poverty Level | Median Home Value | % Married | % Kids |
|---|---|---|---|---|---|---|
| 1 | Jennings, MO | 13,129 | 29.2% | $58,000 | 14.0% | 26.78% |
| 2 | Berkeley, MO | 8,310 | 23.7% | $66,000 | 15.0% | 39.99% |
| 3 | Black Jack, MO | 6,663 | 19.3% | $141,100 | 22.0% | 41.17% |
| 4 | De Soto, MO | 6,429 | 13.3% | $119,000 | 29.0% | 39.18% |
| 5 | Ferguson, MO | 18,826 | 26.4% | $78,900 | 20.0% | 32.67% |
| 6 | Cameron, MO | 8,987 | 12.4% | $117,300 | 18.0% | 30.79% |
| 7 | Aurora, MO | 7,268 | 17.3% | $84,800 | 27.0% | 30.48% |
| 8 | Park Hills, MO | 8,708 | 19.6% | $87,000 | 37.0% | 39.78% |
| 9 | Bellefontaine Neighbors, MO | 10,702 | 19.5% | $68,200 | 24.0% | 28.37% |
| 10 | Overland, MO | 15,908 | 11.2% | $96,300 | 15.0% | 29.06% |
| 11 | Harrisonville, MO | 10,070 | 10.7% | $155,400 | 26.0% | 31.74% |
| 12 | Pevely, MO | 5,974 | 5.7% | $156,700 | 42.0% | 38.94% |
| 13 | Charleston, MO | 5,184 | 26.0% | $76,500 | 23.0% | 31.42% |
| 14 | Fulton, MO | 12,691 | 14.4% | $134,300 | 22.0% | 37.73% |
| 15 | Florissant, MO | 52,382 | 10.7% | $107,700 | 27.0% | 30.36% |
| 16 | Oak Grove, MO | 8,228 | 12.0% | $155,700 | 36.0% | 40.04% |
| 17 | Warrenton, MO | 8,450 | 17.6% | $150,400 | 27.0% | 32.45% |
| 18 | Lebanon, MO | 14,880 | 21.0% | $110,000 | 24.0% | 40.44% |
| 19 | Bonne Terre, MO | 6,772 | 32.3% | $103,600 | 26.0% | 25.03% |
| 20 | Carthage, MO | 15,395 | 34.8% | $109,800 | 19.0% | 43.47% |
| 21 | St. Ann, MO | 13,007 | 12.0% | $95,600 | 24.0% | 30.59% |
| 22 | Peculiar, MO | 5,559 | 7.1% | $166,400 | 24.0% | 36.42% |
| 23 | Grandview, MO | 25,931 | 13.9% | $127,200 | 16.0% | 26.89% |
| 24 | Excelsior Springs, MO | 10,595 | 10.7% | $147,200 | 31.0% | 32.36% |
| 25 | Belton, MO | 23,832 | 7.9% | $153,700 | 25.0% | 32.78% |
| 26 | Mexico, MO | 11,592 | 16.5% | $93,800 | 28.0% | 29.57% |
| 27 | Monett, MO | 9,512 | 15.9% | $123,300 | 21.0% | 41.19% |
| 28 | Caruthersville, MO | 5,606 | 25.2% | $98,400 | 21.0% | 26.51% |
| 29 | St. John, MO | 6,617 | 10.8% | $80,100 | 33.0% | 29.16% |
| 30 | Raytown, MO | 29,893 | 8.7% | $124,300 | 22.0% | 25.27% |
| 31 | Nixa, MO | 22,925 | 7.4% | $191,000 | 24.0% | 40.75% |
| 32 | Grain Valley, MO | 15,435 | 5.6% | $198,400 | 34.0% | 41.11% |
| 33 | Boonville, MO | 8,036 | 14.1% | $136,200 | 29.0% | 29.3% |
| 34 | Independence, MO | 122,230 | 14.3% | $130,400 | 26.0% | 27.24% |
| 35 | Pleasant Hill, MO | 8,673 | 14.9% | $186,400 | 35.0% | 35.64% |
| 36 | Clinton, MO | 8,844 | 17.3% | $120,400 | 25.0% | 31.1% |
| 37 | Union, MO | 12,108 | 8.3% | $160,500 | 35.0% | 31.15% |
| 38 | Blue Springs, MO | 58,265 | 5.6% | $189,100 | 32.0% | 39.41% |
| 39 | Richmond, MO | 5,961 | 14.7% | $112,300 | 33.0% | 31.38% |
| 40 | Kennett, MO | 10,507 | 18.8% | $88,000 | 23.0% | 27.82% |
| 41 | Greenwood, MO | 6,008 | 3.6% | $214,000 | 25.0% | 33.66% |
| 42 | Troy, MO | 12,463 | 10.8% | $160,600 | 38.0% | 38.12% |
| 43 | Eureka, MO | 11,663 | 3.0% | $295,500 | 34.0% | 42.02% |
| 44 | Hazelwood, MO | 25,466 | 14.6% | $127,500 | 24.0% | 26.4% |
| 45 | Poplar Bluff, MO | 16,318 | 27.0% | $101,300 | 23.0% | 28.86% |
| 46 | Sedalia, MO | 21,696 | 18.0% | $106,000 | 26.0% | 29.55% |
| 47 | Marshfield, MO | 7,391 | 20.8% | $144,800 | 32.0% | 37.8% |
| 48 | Moberly, MO | 13,933 | 21.5% | $123,100 | 25.0% | 33.21% |
| 49 | Neosho, MO | 12,439 | 22.4% | $102,500 | 24.0% | 37.11% |
| 50 | Festus, MO | 12,609 | 12.1% | $162,200 | 39.0% | 31.52% |
| 51 | Republic, MO | 18,313 | 13.4% | $141,000 | 34.0% | 40.39% |
| 52 | Wentzville, MO | 43,213 | 4.4% | $246,200 | 35.0% | 45.63% |
| 53 | Arnold, MO | 20,808 | 8.4% | $168,400 | 36.0% | 34.61% |
| 54 | Gladstone, MO | 26,825 | 10.3% | $163,700 | 22.0% | 26.36% |
| 55 | Smithville, MO | 10,211 | 6.2% | $217,800 | 33.0% | 43.99% |
| 56 | Ozark, MO | 20,874 | 12.3% | $173,800 | 25.0% | 44.04% |
| 57 | Ellisville, MO | 9,908 | 2.2% | $289,400 | 32.0% | 30.52% |
| 58 | Carl Junction, MO | 8,099 | 7.1% | $171,500 | 23.0% | 41.64% |
| 59 | Sullivan, MO | 6,192 | 14.5% | $117,400 | 34.0% | 32.14% |
| 60 | Lee’s Summit, MO | 100,772 | 4.2% | $248,800 | 32.0% | 36.93% |
| 61 | Pacific, MO | 6,898 | 8.8% | $196,200 | 29.0% | 26.74% |
| 62 | Bolivar, MO | 10,718 | 20.5% | $139,400 | 21.0% | 33.17% |
| 63 | Kearney, MO | 10,260 | 2.8% | $219,400 | 34.0% | 39.46% |
| 64 | Waynesville, MO | 5,336 | 27.5% | $182,100 | 6.0% | 30.64% |
| 65 | Nevada, MO | 8,111 | 18.7% | $80,800 | 18.0% | 25.56% |
| 66 | Parkville, MO | 7,153 | 1.0% | $456,600 | 29.0% | 45.1% |
| 67 | Wildwood, MO | 35,384 | 3.5% | $398,100 | 31.0% | 37.34% |
| 68 | Raymore, MO | 22,722 | 6.3% | $245,900 | 33.0% | 35.67% |
| 69 | St. Louis, MO | 302,787 | 19.6% | $153,200 | 17.0% | 21.41% |
| 70 | Jackson, MO | 15,272 | 7.4% | $180,500 | 37.0% | 37.63% |
| 71 | O’fallon, MO | 90,802 | 5.0% | $246,100 | 36.0% | 40.53% |
| 72 | Joplin, MO | 51,539 | 17.6% | $129,100 | 21.0% | 27.63% |
| 73 | Kansas City, MO | 502,597 | 15.0% | $175,400 | 17.0% | 26.82% |
| 74 | St. Joseph, MO | 73,138 | 17.2% | $120,300 | 27.0% | 29.39% |
| 75 | Perryville, MO | 8,482 | 14.9% | $148,600 | 36.0% | 32.04% |
| 76 | Liberty, MO | 30,129 | 7.7% | $206,800 | 25.0% | 35.93% |
| 77 | Trenton, MO | 5,547 | 12.2% | $83,900 | 33.0% | 23.65% |
| 78 | Willard, MO | 6,233 | 7.8% | $159,600 | 38.0% | 44.89% |
| 79 | Chillicothe, MO | 9,253 | 13.3% | $98,900 | 28.0% | 28.46% |
| 80 | Webb City, MO | 12,843 | 18.8% | $128,700 | 25.0% | 36.74% |
| 81 | Odessa, MO | 5,538 | 5.0% | $163,100 | 38.0% | 30.19% |
| 82 | Farmington, MO | 17,959 | 16.8% | $152,800 | 27.0% | 29.73% |
| 83 | Lake St. Louis, MO | 16,665 | 3.0% | $305,600 | 33.0% | 29.98% |
| 84 | Hannibal, MO | 17,165 | 21.4% | $115,900 | 30.0% | 30.92% |
| 85 | Bridgeton, MO | 11,417 | 9.3% | $195,200 | 31.0% | 33.4% |
| 86 | Macon, MO | 5,459 | 13.0% | $96,800 | 37.0% | 30.6% |
| 87 | Washington, MO | 14,607 | 5.9% | $170,000 | 37.0% | 30.67% |
| 88 | Warrensburg, MO | 19,509 | 19.2% | $166,900 | 14.0% | 25.43% |
| 89 | Dardenne Prairie, MO | 12,689 | 1.8% | $330,300 | 37.0% | 38.78% |
| 90 | Battlefield, MO | 5,957 | 4.1% | $165,200 | 36.0% | 32.25% |
| 91 | Olivette, MO | 8,408 | 4.3% | $400,300 | 25.0% | 37.43% |
| 92 | St. Peters, MO | 57,289 | 3.7% | $206,700 | 36.0% | 30.68% |
| 93 | Springfield, MO | 168,603 | 21.1% | $127,800 | 21.0% | 21.06% |
| 94 | West Plains, MO | 12,048 | 34.0% | $102,600 | 23.0% | 28.71% |
| 95 | St. Robert, MO | 5,191 | 30.7% | $174,300 | 7.0% | 44.3% |
| 96 | Savannah, MO | 5,087 | 7.5% | $114,600 | 35.0% | 28.96% |
| 97 | Dexter, MO | 7,947 | 19.9% | $91,100 | 29.0% | 29.2% |
| 98 | Maryland Heights, MO | 28,141 | 6.1% | $171,600 | 20.0% | 25.02% |
| 99 | Kirksville, MO | 17,600 | 28.7% | $118,800 | 17.0% | 21.21% |
| 100 | Manchester, MO | 18,308 | 7.0% | $257,000 | 27.0% | 37.22% |