
Do you live in one of the most miserable places in New York?
Only a third of New Yorkers say they are truly happy. That’s too bad, considering that folks in New York don’t really have it too bad in the grand scheme of things.
But, we were curious – which New York cities might be the most miserable? We’re about to find out, using Saturday Night Science and data.
After analyzing the 169 largest cities, we sadly present the most miserable cities in the Empire State.
Table Of Contents: Top Ten | Methodology | Summary | Table
The 10 Most Miserable Places In New York
Read on below to see how we crunched the numbers and how your town ranked. If you have a smile on your face, you probably don’t live in one of these cities.
Oh, and by the way, Northport is the happiest place in New York.
For more New York reading, check out:
The 10 Most Miserable Places In New York For 2023
/10
Population: 58,532
Poverty Level: 17.2%
Median Home Price $358,200
Married Households 8.0%
Households With Kids 45.14%
More on Hempstead: Data | Crime | Cost Of Living
/10
Population: 12,292
Poverty Level: 14.8%
Median Home Price $287,200
Married Households 12.0%
Households With Kids 44.16%
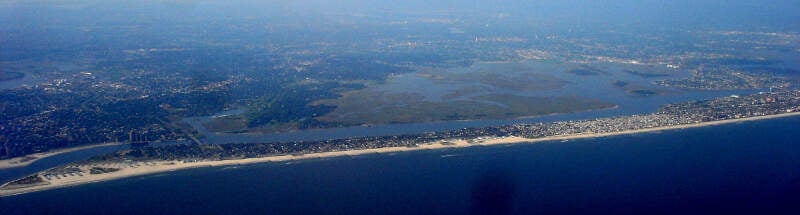
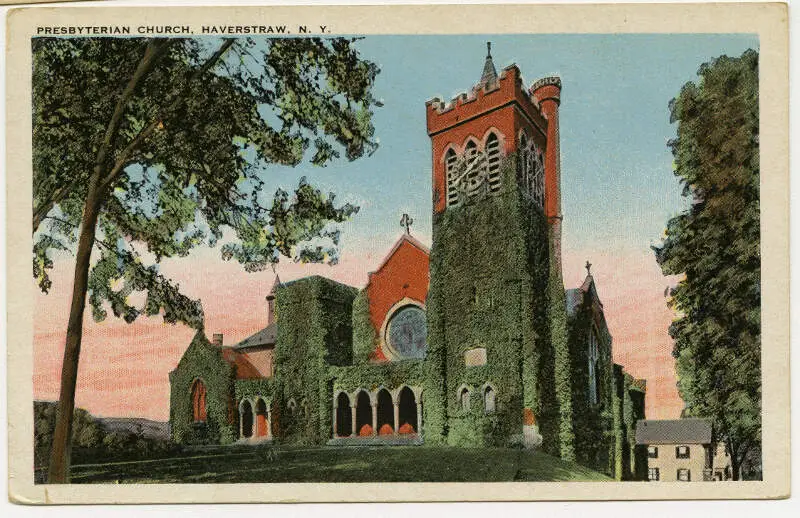
More on Haverstraw: Data | Crime | Cost Of Living
/10
Population: 5,281
Poverty Level: 16.5%
Median Home Price $67,700
Married Households 26.0%
Households With Kids 27.71%
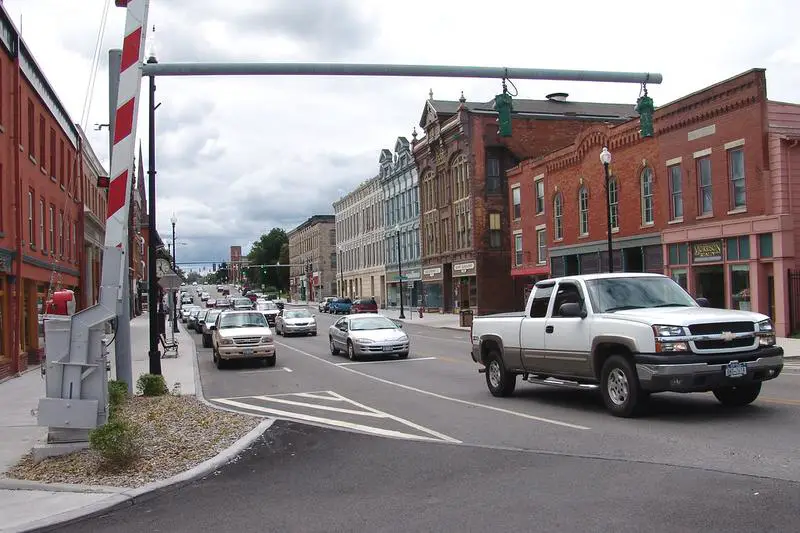
More on Albion: Data | Crime | Cost Of Living
/10
Population: 10,665
Poverty Level: 13.0%
Median Home Price $284,300
Married Households 16.0%
Households With Kids 41.56%
More on West Haverstraw: Data | Cost Of Living
/10
Population: 7,199
Poverty Level: 27.0%
Median Home Price $121,000
Married Households 16.0%
Households With Kids 35.53%
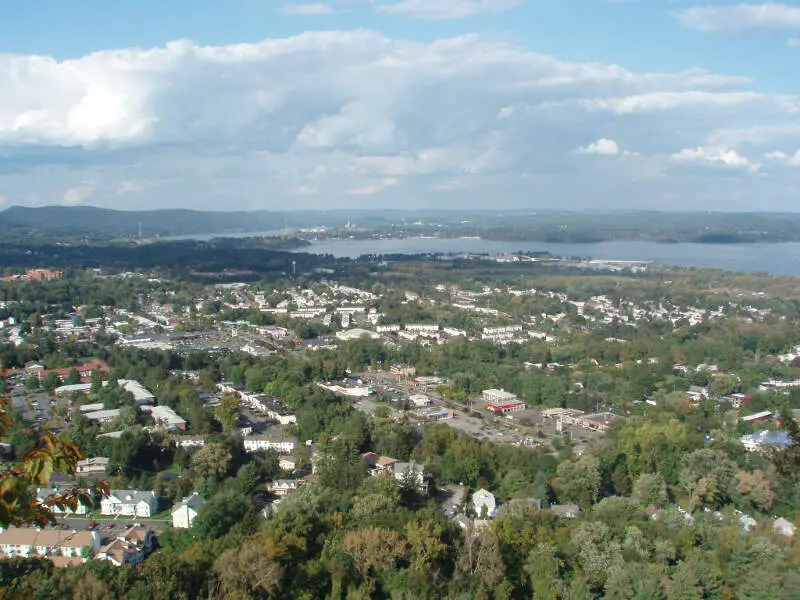
More on Monticello: Data | Crime | Cost Of Living
/10
Population: 28,834
Poverty Level: 21.4%
Median Home Price $166,000
Married Households 14.0%
Households With Kids 36.7%
More on Newburgh: Data | Crime | Cost Of Living
/10
Population: 44,328
Poverty Level: 6.9%
Median Home Price $387,200
Married Households 17.0%
Households With Kids 36.15%
More on Freeport: Data | Crime | Cost Of Living
/10
Population: 11,206
Poverty Level: 4.1%
Median Home Price $355,900
Married Households 32.0%
Households With Kids 40.11%
More on Woodbury: Data | Crime | Cost Of Living
/10
Population: 40,304
Poverty Level: 3.4%
Median Home Price $469,200
Married Households 23.0%
Households With Kids 38.71%
More on Valley Stream: Data | Cost Of Living
/10
Population: 30,086
Poverty Level: 16.5%
Median Home Price $187,800
Married Households 21.0%
Households With Kids 33.86%
More on Middletown: Data | Crime | Cost Of Living
Methodology: How We Measured The Most Miserable Cities In The Empire State
To rank the unhappiest places in New York, we had to determine what criteria make people happy. It isn’t a stretch to assume that happy people earn great salaries, are relatively stress-free, and have a stable home life.
So we went to the Census’s American Community Survey 2017-2021 report for the happy criteria, flipped the list with Saturday Night Science, and it spit out the answer.
Like magic.
Here are the criteria we used to measure misery:
- Percentage of residents with a college degree
- Average commute times
- Unemployment rates
- Cost of living
- % of married couples
- % of families with kids
- Poverty rate
After we decided on the criteria, we gathered the data for the 169 places in New York with over 5,000 people.
We then ranked each place from one to 169 for each of the seven criteria, with a score of one being the most miserable (Any ties were given to the larger place).
Next, we averaged the seven rankings into a Miserable Index for each place with the lowest overall Miserable Index “earning” the title “Most Miserable City In New York.”
If you’d like to see the complete list of states, most miserable to happiest, scroll to the bottom of this post to see the unabridged chart.
We updated this article for 2023, and it’s our tenth time ranking the most miserable cities in New York.
There You Have It – The Least Happy Cities In New York
As we said earlier, trying to determine the most miserable cities in New York is usually a subjective matter.
But if you’re analyzing cities where people are not stable, where you’re stuck in traffic, and no one spent the time to go to college, then this is an accurate list.
If you’re curious enough, here are the happiest cities in New York, according to science:
- Northport
- Saranac Lake
- Saratoga Springs
For more New York reading, check out:
- Best Places To Live In New York
- Cheapest Places To Live In New York
- Most Dangerous Places In New York
- Richest Cities In New York
- Safest Places In New York According To Science
- Worst Places To Live In New York State
- Most Expensive Places To Live In New York
Miserable Cities In New York For 2023
| Rank | City | Population | Poverty Level | Median Home Value | % Married | % Kids |
|---|---|---|---|---|---|---|
| 1 | Hempstead, NY | 58,532 | 17.2% | $358,200 | 8.0% | 45.14% |
| 2 | Haverstraw, NY | 12,292 | 14.8% | $287,200 | 12.0% | 44.16% |
| 3 | Albion, NY | 5,281 | 16.5% | $67,700 | 26.0% | 27.71% |
| 4 | West Haverstraw, NY | 10,665 | 13.0% | $284,300 | 16.0% | 41.56% |
| 5 | Monticello, NY | 7,199 | 27.0% | $121,000 | 16.0% | 35.53% |
| 6 | Newburgh, NY | 28,834 | 21.4% | $166,000 | 14.0% | 36.7% |
| 7 | Freeport, NY | 44,328 | 6.9% | $387,200 | 17.0% | 36.15% |
| 8 | Woodbury, NY | 11,206 | 4.1% | $355,900 | 32.0% | 40.11% |
| 9 | Valley Stream, NY | 40,304 | 3.4% | $469,200 | 23.0% | 38.71% |
| 10 | Middletown, NY | 30,086 | 16.5% | $187,800 | 21.0% | 33.86% |
| 11 | Sleepy Hollow, NY | 10,176 | 7.5% | $743,500 | 14.0% | 37.83% |
| 12 | Port Chester, NY | 31,317 | 10.9% | $491,100 | 13.0% | 36.44% |
| 13 | Peekskill, NY | 25,304 | 10.8% | $308,300 | 17.0% | 27.0% |
| 14 | Hornell, NY | 8,284 | 17.0% | $69,000 | 29.0% | 28.31% |
| 15 | Amsterdam, NY | 18,218 | 23.8% | $92,900 | 25.0% | 29.2% |
| 16 | Elmira, NY | 26,737 | 25.5% | $78,200 | 27.0% | 31.1% |
| 17 | Yonkers, NY | 209,730 | 13.2% | $420,000 | 18.0% | 31.09% |
| 18 | Mount Vernon, NY | 72,855 | 12.7% | $380,500 | 12.0% | 26.02% |
| 19 | Washingtonville, NY | 5,782 | 6.0% | $268,100 | 37.0% | 29.24% |
| 20 | Spring Valley, NY | 32,953 | 24.2% | $305,700 | 14.0% | 48.68% |
| 21 | Gloversville, NY | 15,211 | 22.5% | $77,200 | 30.0% | 28.21% |
| 22 | Hilton, NY | 6,015 | 9.6% | $143,500 | 42.0% | 37.78% |
| 23 | Fulton, NY | 11,461 | 23.6% | $81,000 | 32.0% | 37.93% |
| 24 | Croton-On-Hudson, NY | 8,289 | 3.0% | $605,700 | 28.0% | 37.55% |
| 25 | Salamanca, NY | 5,918 | 25.9% | $67,100 | 27.0% | 31.64% |
| 26 | Larchmont, NY | 6,532 | 1.7% | $1,217,400 | 33.0% | 46.86% |
| 27 | Schenectady, NY | 66,809 | 21.3% | $118,300 | 17.0% | 21.87% |
| 28 | Ogdensburg, NY | 10,153 | 18.4% | $74,400 | 28.0% | 30.17% |
| 29 | Utica, NY | 64,723 | 28.0% | $106,000 | 19.0% | 31.35% |
| 30 | New York, NY | 8,736,047 | 17.0% | $660,700 | 12.0% | 27.93% |
| 31 | Port Jervis, NY | 8,772 | 24.2% | $153,300 | 24.0% | 29.28% |
| 32 | Endicott, NY | 13,588 | 26.7% | $89,600 | 25.0% | 28.32% |
| 33 | Monroe, NY | 9,392 | 4.8% | $336,800 | 31.0% | 43.96% |
| 34 | Elmsford, NY | 5,176 | 10.6% | $472,100 | 22.0% | 41.31% |
| 35 | Pelham, NY | 7,255 | 4.7% | $711,200 | 27.0% | 47.83% |
| 36 | Lindenhurst, NY | 27,169 | 6.3% | $395,100 | 36.0% | 35.12% |
| 37 | Rochester, NY | 211,100 | 29.3% | $93,100 | 13.0% | 25.41% |
| 38 | Dobbs Ferry, NY | 11,511 | 3.7% | $646,300 | 27.0% | 42.13% |
| 39 | Jamestown, NY | 28,818 | 28.1% | $66,100 | 25.0% | 28.12% |
| 40 | Medina, NY | 5,941 | 17.3% | $82,800 | 39.0% | 34.59% |
| 41 | Olean, NY | 13,941 | 23.5% | $81,000 | 26.0% | 29.17% |
| 42 | Sea Cliff, NY | 5,084 | 3.5% | $743,400 | 36.0% | 37.02% |
| 43 | Syracuse, NY | 146,781 | 30.1% | $99,200 | 15.0% | 26.09% |
| 44 | Walden, NY | 6,841 | 22.2% | $257,300 | 25.0% | 36.13% |
| 45 | Solvay, NY | 6,661 | 16.0% | $121,200 | 31.0% | 31.28% |
| 46 | New Rochelle, NY | 80,685 | 10.3% | $578,000 | 20.0% | 31.03% |
| 47 | Kingston, NY | 23,972 | 18.9% | $198,900 | 23.0% | 28.68% |
| 48 | Hudson, NY | 5,964 | 23.5% | $240,800 | 15.0% | 26.04% |
| 49 | Poughkeepsie, NY | 31,475 | 18.8% | $214,300 | 16.0% | 24.92% |
| 50 | Ossining, NY | 27,368 | 8.7% | $377,700 | 20.0% | 29.99% |
| 51 | Buffalo, NY | 276,011 | 27.6% | $112,900 | 18.0% | 26.36% |
| 52 | New Hempstead, NY | 5,440 | 2.2% | $593,800 | 22.0% | 43.2% |
| 53 | Harrison, NY | 28,635 | 4.0% | $894,000 | 25.0% | 47.14% |
| 54 | Wappingers Falls, NY | 6,074 | 8.6% | $253,500 | 27.0% | 25.58% |
| 55 | Niagara Falls, NY | 48,763 | 23.8% | $81,700 | 28.0% | 25.15% |
| 56 | Great Neck, NY | 11,034 | 10.1% | $893,100 | 26.0% | 43.98% |
| 57 | Rye, NY | 16,459 | 4.4% | $1,529,400 | 25.0% | 46.55% |
| 58 | Auburn, NY | 26,913 | 20.2% | $114,000 | 26.0% | 27.45% |
| 59 | Westbury, NY | 15,772 | 5.3% | $496,200 | 21.0% | 30.14% |
| 60 | East Rockaway, NY | 10,108 | 4.9% | $531,700 | 42.0% | 32.57% |
| 61 | Lockport, NY | 20,876 | 12.4% | $103,900 | 33.0% | 26.86% |
| 62 | Cohoes, NY | 17,931 | 16.1% | $177,300 | 29.0% | 24.93% |
| 63 | Lackawanna, NY | 19,697 | 22.1% | $102,900 | 23.0% | 24.2% |
| 64 | Brockport, NY | 7,246 | 22.0% | $109,600 | 13.0% | 19.8% |
| 65 | Oswego, NY | 17,105 | 25.2% | $93,200 | 29.0% | 28.13% |
| 66 | Pleasantville, NY | 7,469 | 5.7% | $701,900 | 27.0% | 37.72% |
| 67 | Binghamton, NY | 47,828 | 32.0% | $95,200 | 19.0% | 22.4% |
| 68 | Troy, NY | 50,717 | 23.3% | $155,000 | 18.0% | 24.12% |
| 69 | Johnson City, NY | 15,275 | 19.6% | $94,600 | 25.0% | 22.1% |
| 70 | Beacon, NY | 13,713 | 9.2% | $342,200 | 27.0% | 28.12% |
| 71 | Mamaroneck, NY | 19,989 | 5.0% | $640,900 | 22.0% | 39.72% |
| 72 | Scarsdale, NY | 18,063 | 2.4% | $1,474,000 | 30.0% | 55.47% |
| 73 | New Hyde Park, NY | 10,262 | 3.0% | $631,400 | 29.0% | 40.02% |
| 74 | Rye Brook, NY | 9,909 | 5.3% | $794,700 | 36.0% | 40.07% |
| 75 | Irvington, NY | 6,594 | 1.9% | $801,900 | 29.0% | 54.05% |
| 76 | Norwich, NY | 6,982 | 17.9% | $100,500 | 31.0% | 23.05% |
| 77 | Mechanicville, NY | 5,191 | 18.8% | $158,300 | 30.0% | 29.61% |
| 78 | Airmont, NY | 9,964 | 10.9% | $575,300 | 34.0% | 46.83% |
| 79 | Kings Point, NY | 5,493 | 2.8% | $2,000,001 | 19.0% | 41.45% |
| 80 | Goshen, NY | 5,705 | 7.3% | $299,600 | 24.0% | 26.92% |
| 81 | Great Neck Plaza, NY | 7,429 | 8.7% | $399,800 | 20.0% | 23.21% |
| 82 | Scotia, NY | 7,305 | 7.5% | $153,200 | 35.0% | 35.19% |
| 83 | Cortland, NY | 17,577 | 21.9% | $115,400 | 21.0% | 25.99% |
| 84 | Williston Park, NY | 7,571 | 1.8% | $615,900 | 36.0% | 39.81% |
| 85 | Bath, NY | 5,613 | 16.2% | $89,100 | 36.0% | 20.13% |
| 86 | Bronxville, NY | 6,569 | 7.5% | $1,039,100 | 23.0% | 41.2% |
| 87 | Mount Kisco, NY | 10,904 | 7.6% | $432,000 | 19.0% | 29.24% |
| 88 | Lynbrook, NY | 20,325 | 4.5% | $519,200 | 35.0% | 31.51% |
| 89 | Suffern, NY | 11,376 | 6.3% | $309,400 | 22.0% | 25.32% |
| 90 | Chestnut Ridge, NY | 10,211 | 19.1% | $577,800 | 32.0% | 40.89% |
| 91 | Herkimer, NY | 7,239 | 13.6% | $95,800 | 34.0% | 18.61% |
| 92 | Patchogue, NY | 12,341 | 7.7% | $364,400 | 27.0% | 24.33% |
| 93 | Hudson Falls, NY | 7,413 | 18.8% | $137,800 | 28.0% | 23.56% |
| 94 | Batavia, NY | 15,497 | 16.0% | $108,100 | 29.0% | 20.48% |
| 95 | Pelham Manor, NY | 5,698 | 2.7% | $918,500 | 37.0% | 41.1% |
| 96 | Lake Grove, NY | 11,110 | 5.7% | $449,900 | 43.0% | 32.47% |
| 97 | Rome, NY | 32,309 | 17.4% | $105,900 | 31.0% | 27.73% |
| 98 | Newark, NY | 9,049 | 13.0% | $103,800 | 31.0% | 30.13% |
| 99 | Dunkirk, NY | 12,651 | 26.7% | $71,500 | 25.0% | 24.78% |
| 100 | Johnstown, NY | 8,247 | 12.4% | $112,400 | 35.0% | 27.63% |
Your criteria for happiness are ridiculous- this article is kind of total nonsense.
Tell us where we should go? Disneyland?
Science and data ? Did you talk to anybody? Like the people of Beacon who are apparently pretty miserable?
Maybe you’re just miserable because because you can’t think of anything good to write about. Stop projecting your shit on everyone – this article is trash.
Haverstraw, is low on this list but should be a great place given its special location and history of its post office and brick industry. It always was grear and will show its greatness.. There is only 1 rather simple issue in Haverstraw and the addresses are between 101 RIverside Avenue (CRH Oldcastle longstanding criminal associations), a real estate developer who does not pay his part of the village’s debt properly and heading north to village hall that has an odd out of place debt that for years has prevented it from being part of the Town of Haverstraw.
Your criteria puts university towns and cities at a serious disadvantage for ranking.
NOT miserable places.