
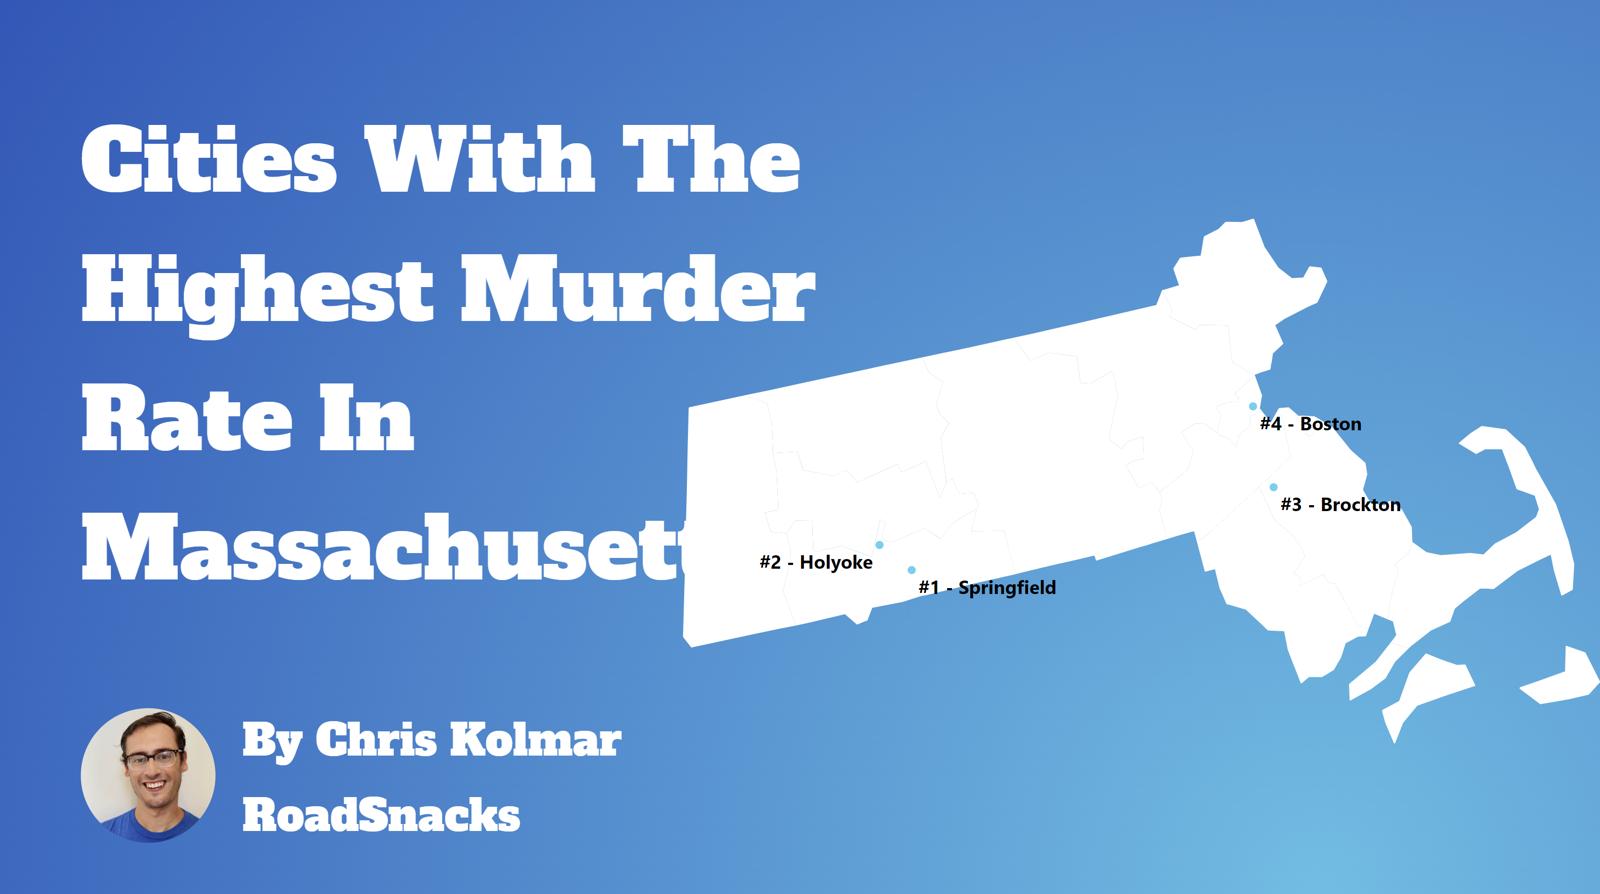
Do you live in one of the murder capitals of Massachusetts?
We all watch the news with horror when we hear about a homicide that happens not that far away from us. While a murder just blocks or even a couple of towns away from your house would make anyone uneasy, in the long run, most likely, where you live is relatively safe.
To find the cities in Massachusetts with the most murders and the highest murder rates per capita, we used Saturday Night Science to compare the FBI crime data on murders for the 41 cities in the Bay State with over 5,000 residents.
Table Of Contents: Top Ten | Methodology | Summary | Table
Cities With Highest Murder Rates In Massachusetts
- Dover
- Springfield
- Rochester
- Holyoke
- Cohasset
- Duxbury
- Bridgewater
- Blackstone
- Freetown
- Lunenburg
What city has the highest murder rate in Massachusetts? The city with the highest murder rate in Massachusetts is Dover with 34.1 murders per 100,000 people.
What is the city in Massachusetts with highest number of murders? The city in Massachusetts with the highest number of murders is Boston with 34 murders.
Read on below to see how we crunched the numbers and how your town in Massachusetts ranked. There were ‘only’ 41 cities in Massachusetts where a city reported a murder to the FBI, meaning 208 places had no murder.
For more reading on the Bay State check out:
- Best Places To Live In Massachusetts
- Cheapest Places To Live In Massachusetts
- Most Dangerous Cities In Massachusetts
The 10 Murder Capitals Of Massachusetts For 2025
1. Dover
/10
Population: 5,868
Murders: 2 (12th Most)
Murders Per 100k: 34.1 (Most)
More on Dover:

/10
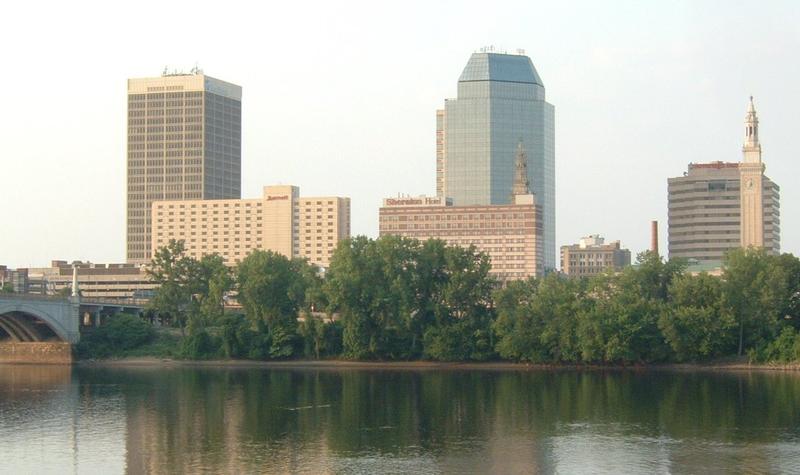
Population: 154,218
Murders: 29 (2nd Most)
Murders Per 100k: 18.8 (2nd Most)
More on Springfield: Data
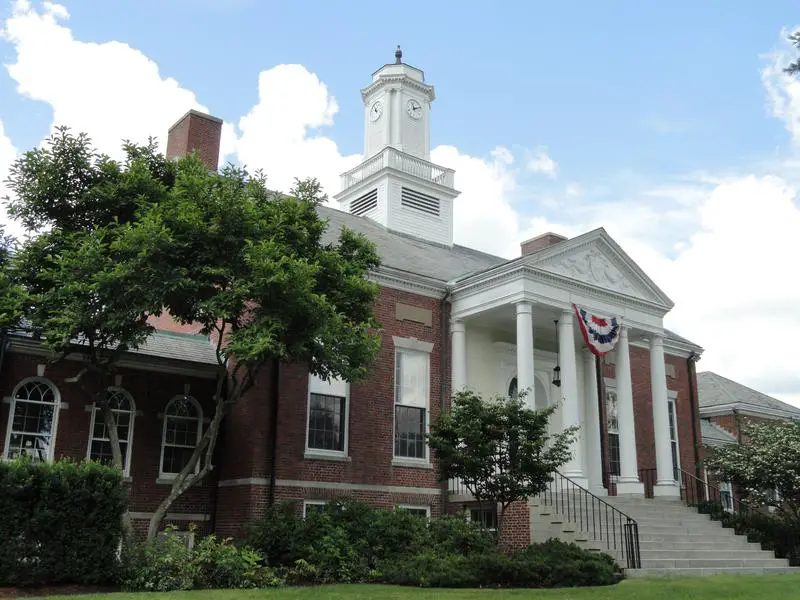
3. Rochester

Population: 6,112
Murders: 1 (29th Most)
Murders Per 100k: 16.4 (3rd Most)
More on Rochester:

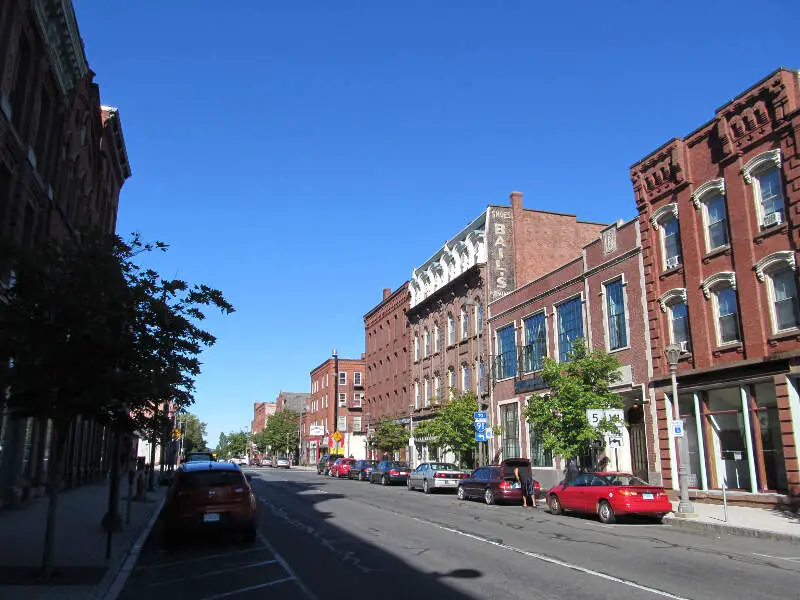
/10
Population: 37,706
Murders: 5 (5th Most)
Murders Per 100k: 13.3 (4th Most)
More on Holyoke: Data
5. Cohasset

Population: 8,380
Murders: 1 (29th Most)
Murders Per 100k: 11.9 (5th Most)
More on Cohasset:
6. Duxbury
/10
Population: 16,809
Murders: 2 (12th Most)
Murders Per 100k: 11.9 (6th Most)
More on Duxbury:

Population: 9,221
Murders: 1 (29th Most)
Murders Per 100k: 10.8 (7th Most)
More on Bridgewater: Data
8. Blackstone

Population: 9,257
Murders: 1 (29th Most)
Murders Per 100k: 10.8 (8th Most)
More on Blackstone:
9. Freetown

Population: 9,283
Murders: 1 (29th Most)
Murders Per 100k: 10.8 (9th Most)
More on Freetown:
10. Lunenburg
/10
Population: 11,900
Murders: 1 (29th Most)
Murders Per 100k: 8.4 (10th Most)
More on Lunenburg:
Methodology: How we calculated the murder capitals of Massachusetts
While there are surveys and public polls on what cities in a state are the most dangerous, we wanted to rely on something other than speculation and opinion. Instead, we used Saturday Night Science to compare the hard numbers from the FBI’s last year of reporting. Specifically, we analyzed the FBI’s Uniform Crime Report, which summarizes the number of murders in each city annually.
We only looked at every single city in Massachusetts for which FBI data was available for the most recent FBI Crime In The United States. That left us with 41 cities to rank.
We took the number of murders per capita as the ranking factor. The place with the most murders per capita based on the most recent data is Dover. It is our tenth time ranking the places with the most murders per capita in Massachusetts. We updated the list for 2025.
Summary: The Places With The Most Murders In Massachusetts For 2025
If you’re looking at the places in Massachusetts with the most murders, and where residents have the highest chances of being killed themselves, this is an accurate list. Again, these statistics are an indication of where crimes occur, not a statement about the effectiveness of the law enforcement in the areas they serve.
The cities with the highest murder per capita in Massachusetts are Dover, Springfield, Rochester, Holyoke, Cohasset, Duxbury, Bridgewater, Blackstone, Freetown, and Lunenburg.
For more Massachusetts reading, check out:
- Best Places To Raise A Family In Massachusetts
- Fastest Growing Cities In Massachusetts
- Safest Places In Massachusetts
- Best Cities For Singles In Massachusetts
- Worst Places To Live In Massachusetts
Murder Rates By City In Massachusetts
| Rank | City | Population | Murders | Murders/100K |
|---|---|---|---|---|
| 1 | Dover, MA | 5868 | 2 | 34.08 |
| 2 | Springfield, MA | 154218 | 29 | 18.8 |
| 3 | Rochester, MA | 6112 | 1 | 16.36 |
| 4 | Holyoke, MA | 37706 | 5 | 13.26 |
| 5 | Cohasset, MA | 8380 | 1 | 11.93 |
| 6 | Duxbury, MA | 16809 | 2 | 11.9 |
| 7 | Bridgewater, MA | 9221 | 1 | 10.84 |
| 8 | Blackstone, MA | 9257 | 1 | 10.8 |
| 9 | Freetown, MA | 9283 | 1 | 10.77 |
| 10 | Lunenburg, MA | 11900 | 1 | 8.4 |
| 11 | Lawrence, MA | 87806 | 7 | 7.97 |
| 12 | Lakeville, MA | 12592 | 1 | 7.94 |
| 13 | Rehoboth, MA | 13330 | 1 | 7.5 |
| 14 | Brockton, MA | 108938 | 7 | 6.43 |
| 15 | Raynham, MA | 15697 | 1 | 6.37 |
| 16 | Easthampton, MA | 15980 | 1 | 6.26 |
| 17 | Andover, MA | 36398 | 2 | 5.49 |
| 18 | Boston, MA | 642823 | 34 | 5.29 |
| 19 | Braintree, MA | 38544 | 2 | 5.19 |
| 20 | Fitchburg, MA | 41566 | 2 | 4.81 |
| 21 | Gardner, MA | 20816 | 1 | 4.8 |
| 22 | Salem, MA | 45005 | 2 | 4.44 |
| 23 | Fall River, MA | 93879 | 4 | 4.26 |
| 24 | Mansfield, MA | 23880 | 1 | 4.19 |
| 25 | Wareham, MA | 24072 | 1 | 4.15 |
| 26 | New Bedford, MA | 100876 | 4 | 3.97 |
| 27 | Lynn, MA | 101144 | 4 | 3.95 |
| 28 | West Springfield, MA | 28521 | 1 | 3.51 |
| 29 | Saugus, MA | 28619 | 1 | 3.49 |
| 30 | Melrose, MA | 28982 | 1 | 3.45 |
| 31 | Milford, MA | 30233 | 1 | 3.31 |
| 32 | Randolph, MA | 32757 | 1 | 3.05 |
| 33 | Medford, MA | 68280 | 2 | 2.93 |
| 34 | Marlborough, MA | 40773 | 1 | 2.45 |
| 35 | Newton, MA | 86996 | 2 | 2.3 |
| 36 | Methuen, MA | 53558 | 1 | 1.87 |
| 37 | Chicopee, MA | 55043 | 1 | 1.82 |
| 38 | Taunton, MA | 60356 | 1 | 1.66 |
| 39 | Waltham, MA | 63797 | 1 | 1.57 |
| 40 | Plymouth, MA | 68771 | 1 | 1.45 |
| 41 | Cambridge, MA | 118960 | 1 | 0.84 |
I know I’m a few months late here but seriously, Groton, MA? This is obviously a statistical anomaly for that year. Your biggest threat out there are cows and stoned GD kids whipping around the country roads in their $50k King ranch.