
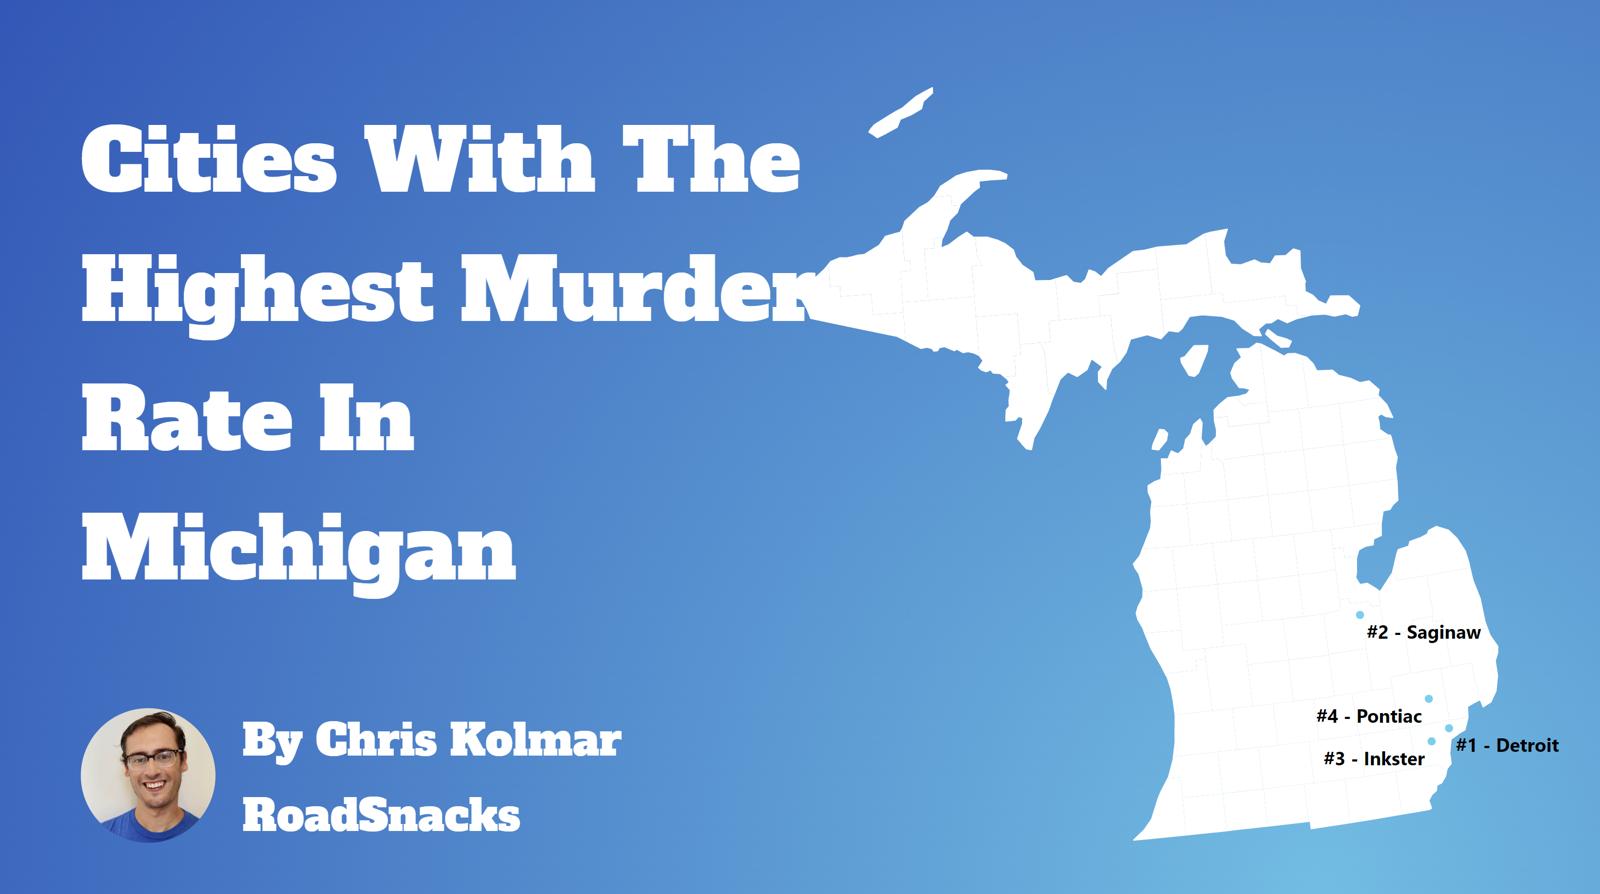
Do you live in one of the murder capitals of Michigan?
We all watch the news with horror when we hear about a homicide that happens not that far away from us. While a murder just blocks or even a couple of towns away from your house would make anyone uneasy, in the long run, most likely, where you live is relatively safe.
To find the cities in Michigan with the most murders and the highest murder rates per capita, we used Saturday Night Science to compare the FBI crime data on murders for the 61 cities in the Wolverine State with over 7,000 residents.
Table Of Contents: Top Ten | Methodology | Summary | Table
Cities With Highest Murder Rates In Michigan
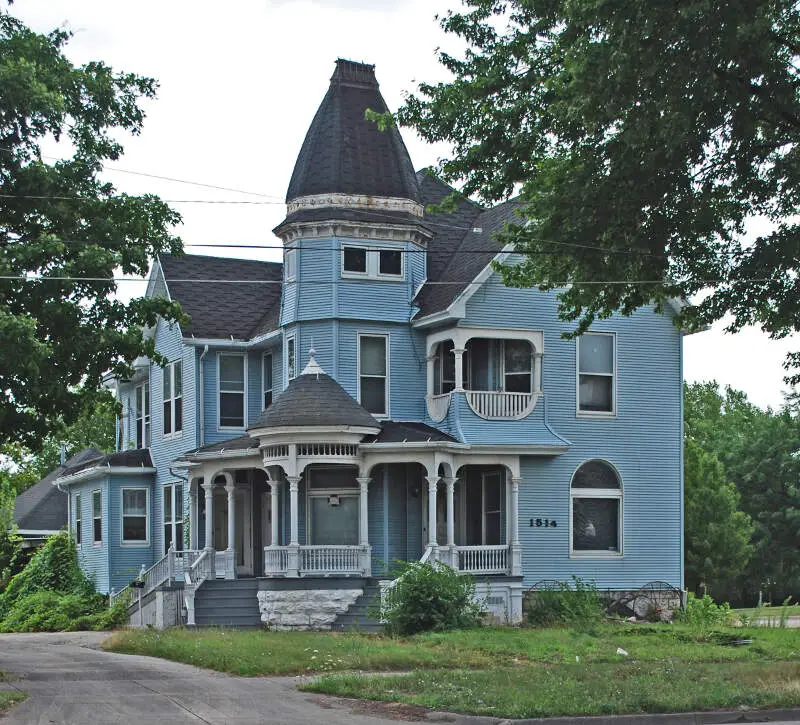
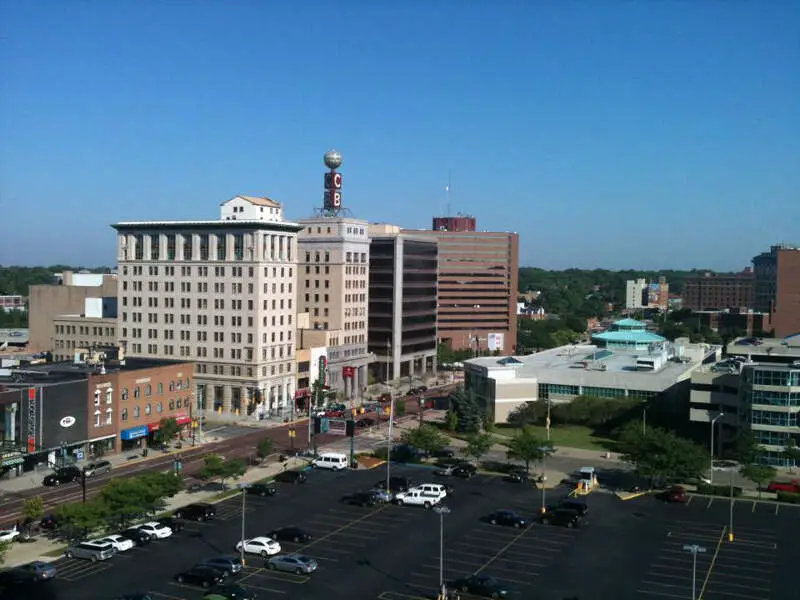
- Saginaw
- Highland Park
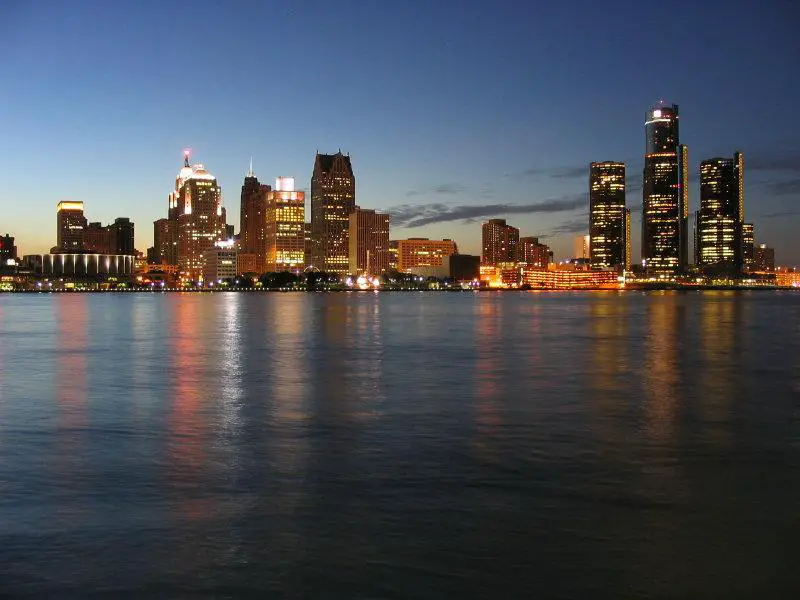
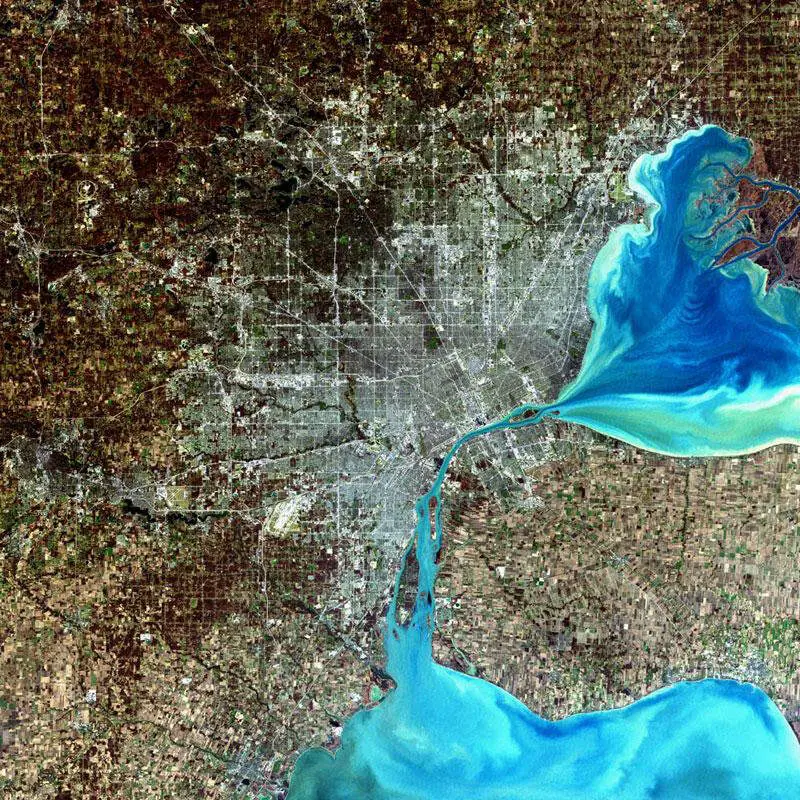
- Detroit
- Oscoda Township
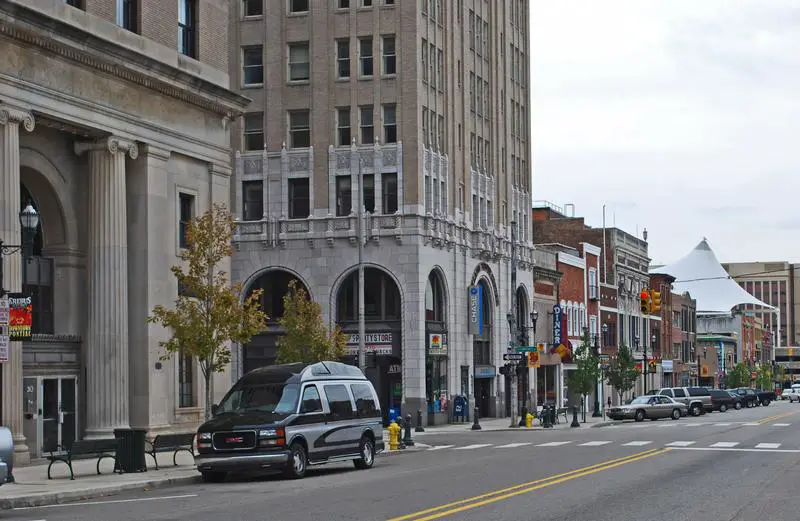
- Flint
- Benton Township
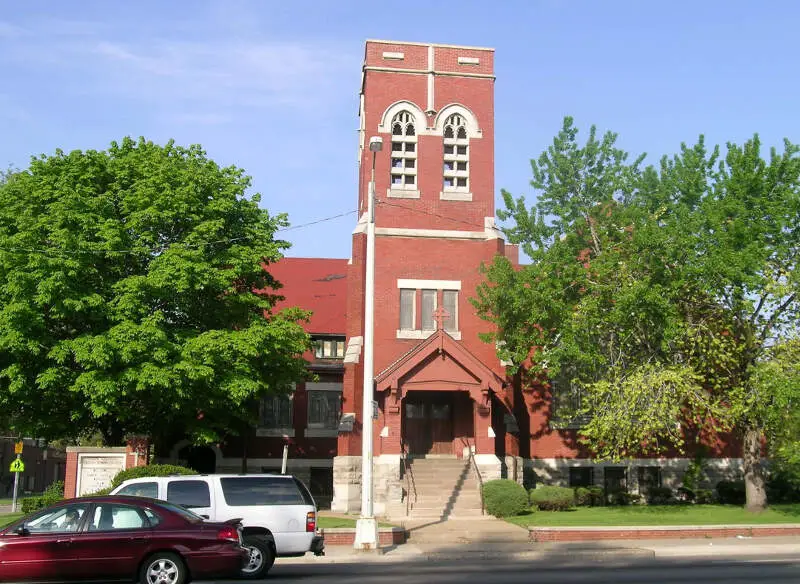
- Pontiac
- Bridgeport Township
- Melvindale
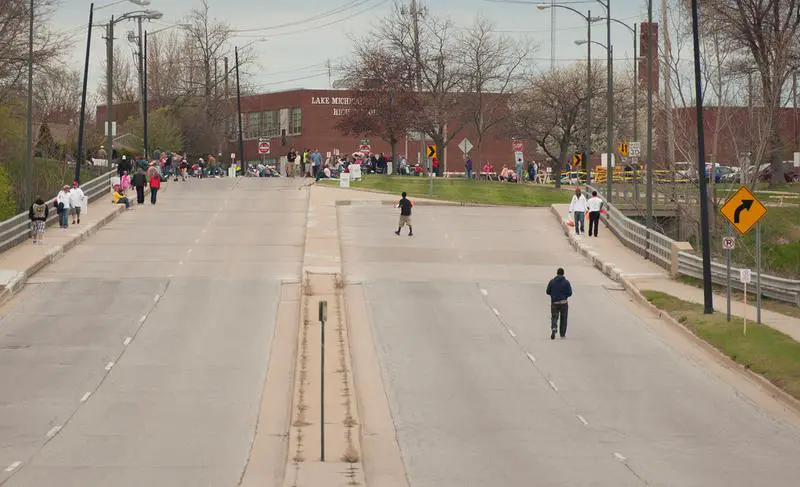
- Kalamazoo
What city has the highest murder rate in Michigan? The city with the highest murder rate in Michigan is Saginaw with 44.3 murders per 100,000 people.
What is the city in Michigan with highest number of murders? The city in Michigan with the highest number of murders is Detroit with 203 murders.
Read on below to see how we crunched the numbers and how your town in Michigan ranked. There were ‘only’ 61 cities in Michigan where a city reported a murder to the FBI, meaning 147 places had no murder.
For more reading on the Wolverine State check out:
- Best Places To Live In Michigan
- Cheapest Places To Live In Michigan
- Most Dangerous Places in Michigan
The 10 Murder Capitals Of Michigan For 2026

/10
Population: 42,880
Murders: 19 (3rd Most)
Murders Per 100k: 44.3 (Most)
More on Saginaw: Data | Crime | Cost Of Living | Movers

/10
Population: 8,280
Murders: 3 (15th Most)
Murders Per 100k: 36.2 (2nd Most)
More on Highland Park: Data | Crime | Cost Of Living | Movers

/10
Population: 651,171
Murders: 203 (Most)
Murders Per 100k: 31.2 (3rd Most)
More on Detroit: Data | Crime | Cost Of Living | Movers
4. Oscoda Township

Population: 7,211
Murders: 2 (25th Most)
Murders Per 100k: 27.7 (4th Most)
More on Oscoda Township: Movers

/10
Population: 79,183
Murders: 20 (2nd Most)
Murders Per 100k: 25.3 (5th Most)
More on Flint: Data | Crime | Cost Of Living | Movers
6. Benton Township
Population: 14,040
Murders: 3 (15th Most)
Murders Per 100k: 21.4 (6th Most)
More on Benton Township: Movers

/10
Population: 61,644
Murders: 13 (4th Most)
Murders Per 100k: 21.1 (7th Most)
More on Pontiac: Data | Crime | Cost Of Living | Movers
8. Bridgeport Township

Population: 9,840
Murders: 2 (25th Most)
Murders Per 100k: 20.3 (8th Most)
More on Bridgeport Township: Movers

/10
Population: 12,267
Murders: 2 (25th Most)
Murders Per 100k: 16.3 (9th Most)
More on Melvindale: Data | Crime | Cost Of Living | Movers

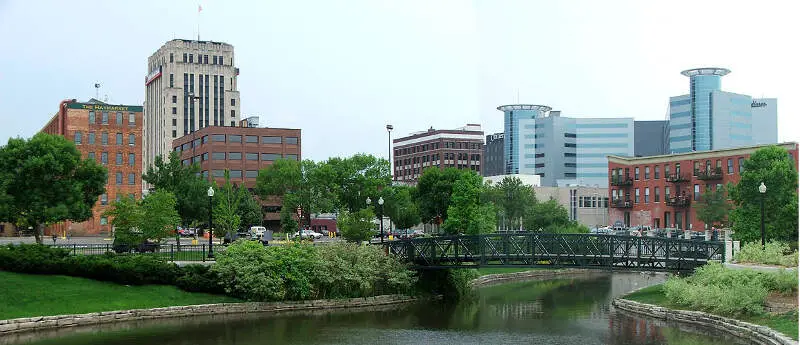
/10
Population: 73,002
Murders: 10 (7th Most)
Murders Per 100k: 13.7 (10th Most)
More on Kalamazoo: Data | Crime | Cost Of Living | Movers
Methodology: How we calculated the murder capitals of Michigan
While there are surveys and public polls on what cities in a state are the most dangerous, we wanted to rely on something other than speculation and opinion. Instead, we used Saturday Night Science to compare the hard numbers from the FBI’s last year of reporting. Specifically, we analyzed the FBI’s Uniform Crime Report, which summarizes the number of murders in each city annually.
We only looked at every single city in Michigan for which FBI data was available for the most recent FBI Crime In The United States. That left us with 61 cities to rank.
We took the number of murders per capita as the ranking factor. The place with the most murders per capita based on the most recent data is Saginaw. It is our eleventh time ranking the places with the most murders per capita in Michigan. We updated the list for 2026.
Summary: The Places With The Most Murders In Michigan For 2026
If you’re looking at the places in Michigan with the most murders, and where residents have the highest chances of being killed themselves, this is an accurate list. Again, these statistics are an indication of where crimes occur, not a statement about the effectiveness of the law enforcement in the areas they serve.
The cities with the highest murder per capita in Michigan are Saginaw, Highland Park, Detroit, Oscoda Township, Flint, Benton Township, Pontiac, Bridgeport Township, Melvindale, and Kalamazoo.
For more Michigan reading, check out:
- Best Places To Raise A Family In Michigan
- Fastest Growing Cities In Michigan
- Safest Places In Michigan
- Best Cities For Singles In Michigan
- Worst Places To Live In Michigan
Murder Rates By City In Michigan
| Rank | City | Population | Murders | Murders/100K |
|---|---|---|---|---|
| 1 | Saginaw, MI | 42880 | 19 | 44.31 |
| 2 | Highland Park, MI | 8280 | 3 | 36.23 |
| 3 | Detroit, MI | 651171 | 203 | 31.17 |
| 4 | Oscoda Township, MI | 7211 | 2 | 27.74 |
| 5 | Flint, MI | 79183 | 20 | 25.26 |
| 6 | Benton Township, MI | 14040 | 3 | 21.37 |
| 7 | Pontiac, MI | 61644 | 13 | 21.09 |
| 8 | Bridgeport Township, MI | 9840 | 2 | 20.33 |
| 9 | Melvindale, MI | 12267 | 2 | 16.3 |
| 10 | Kalamazoo, MI | 73002 | 10 | 13.7 |
| 11 | Buena Vista Township, MI | 7485 | 1 | 13.36 |
| 12 | Inkster, MI | 24751 | 3 | 12.12 |
| 13 | Northfield Township, MI | 8461 | 1 | 11.82 |
| 14 | Howell, MI | 9985 | 1 | 10.02 |
| 15 | Lansing, MI | 111965 | 11 | 9.82 |
| 16 | Jackson, MI | 30704 | 3 | 9.77 |
| 17 | Emmett Township, MI | 11743 | 1 | 8.52 |
| 18 | Wyandotte, MI | 23778 | 2 | 8.41 |
| 19 | Battle Creek, MI | 61163 | 5 | 8.17 |
| 20 | Romulus, MI | 24567 | 2 | 8.14 |
| 21 | Blackman Township, MI | 39091 | 3 | 7.67 |
| 22 | Bath Township, MI | 13473 | 1 | 7.42 |
| 23 | Madison Heights, MI | 28188 | 2 | 7.1 |
| 24 | Fraser, MI | 14350 | 1 | 6.97 |
| 25 | Burton, MI | 29280 | 2 | 6.83 |
| 26 | Harper Woods, MI | 14717 | 1 | 6.79 |
| 27 | Flint Township, MI | 30751 | 2 | 6.5 |
| 28 | DeWitt Township, MI | 15433 | 1 | 6.48 |
| 29 | Bay City, MI | 31908 | 2 | 6.27 |
| 30 | Grand Rapids, MI | 195913 | 12 | 6.13 |
| 31 | Wayne, MI | 16891 | 1 | 5.92 |
| 32 | Wixom, MI | 17120 | 1 | 5.84 |
| 33 | Trenton, MI | 17698 | 1 | 5.65 |
| 34 | Oxford Township, MI | 19165 | 1 | 5.22 |
| 35 | Warren, MI | 135843 | 7 | 5.15 |
| 36 | Genesee Township, MI | 20199 | 1 | 4.95 |
| 37 | Taylor, MI | 60602 | 3 | 4.95 |
| 38 | Saginaw Township, MI | 40864 | 2 | 4.89 |
| 39 | Redford Township, MI | 47067 | 2 | 4.25 |
| 40 | Clinton Township, MI | 99056 | 4 | 4.04 |
| 41 | East Lansing, MI | 50472 | 2 | 3.96 |
| 42 | Walker, MI | 25308 | 1 | 3.95 |
| 43 | Wyoming, MI | 77684 | 3 | 3.86 |
| 44 | Auburn Hills, MI | 26019 | 1 | 3.84 |
| 45 | Westland, MI | 81727 | 3 | 3.67 |
| 46 | Oak Park, MI | 28858 | 1 | 3.47 |
| 47 | Canton Township, MI | 97844 | 3 | 3.07 |
| 48 | Eastpointe, MI | 33492 | 1 | 2.99 |
| 49 | Holland, MI | 34604 | 1 | 2.89 |
| 50 | Pittsfield Township, MI | 39244 | 1 | 2.55 |
| 51 | Midland, MI | 42712 | 1 | 2.34 |
| 52 | Roseville, MI | 46358 | 1 | 2.16 |
| 53 | Kentwood, MI | 53891 | 1 | 1.86 |
| 54 | Dearborn Heights, MI | 60148 | 1 | 1.66 |
| 55 | Novi, MI | 66366 | 1 | 1.51 |
| 56 | Waterford Township, MI | 69066 | 1 | 1.45 |
| 57 | Southfield, MI | 75454 | 1 | 1.33 |
| 58 | Rochester Hills, MI | 75960 | 1 | 1.32 |
| 59 | Farmington Hills, MI | 82116 | 1 | 1.22 |
| 60 | Dearborn, MI | 104571 | 1 | 0.96 |
| 61 | Sterling Heights, MI | 133058 | 1 | 0.75 |