
Do you live in one of the murder capitals of Tennessee?
We all watch the news with horror when we hear about a homicide that happens not that far away from us. While a murder just blocks or even a couple of towns away from your house would make anyone uneasy, in the long run, most likely, where you live is relatively safe.
To find the cities in Tennessee with the most murders and the highest murder rates per capita, we used Saturday Night Science to compare the FBI crime data on murders for the 35 cities in the Volunteer State with over 6,000 residents.
Table Of Contents: Top Ten | Methodology | Summary | Table

Cities With Highest Murder Rates In Tennessee
- Memphis
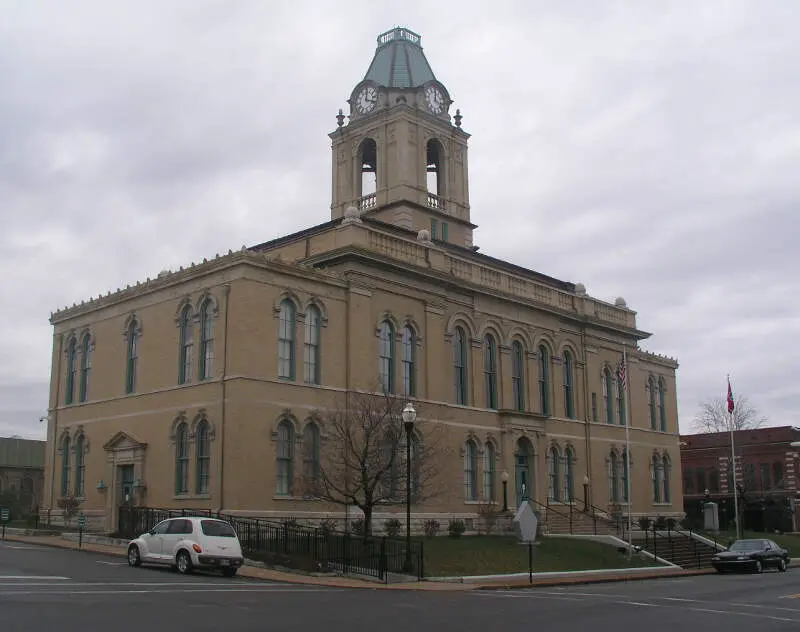
- Springfield
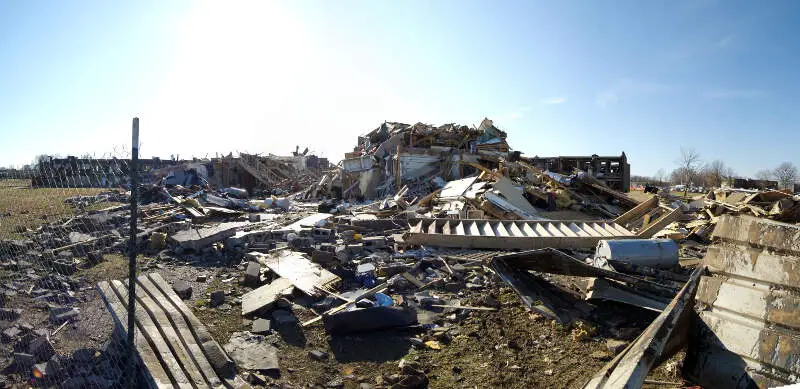
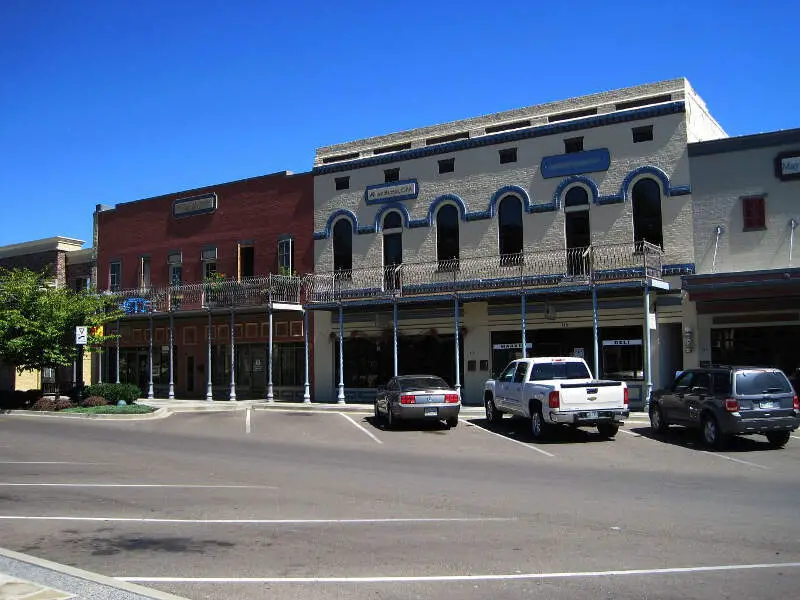
- Jackson
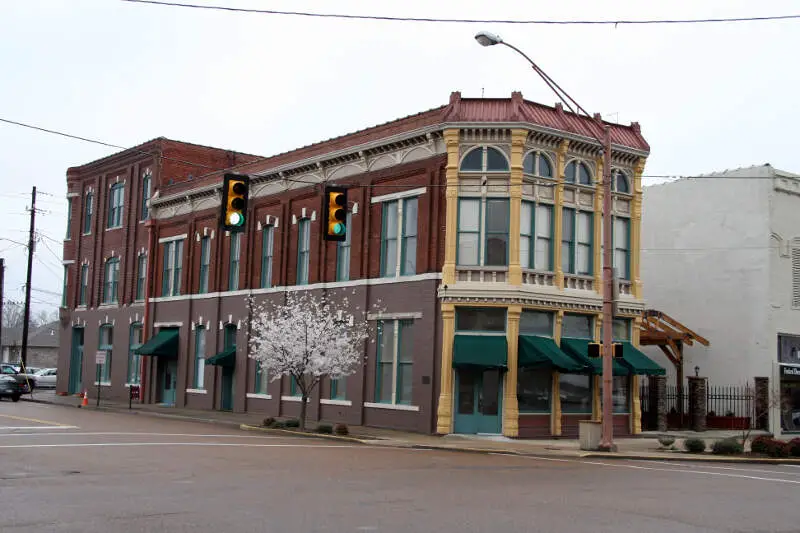
- Dyersburg
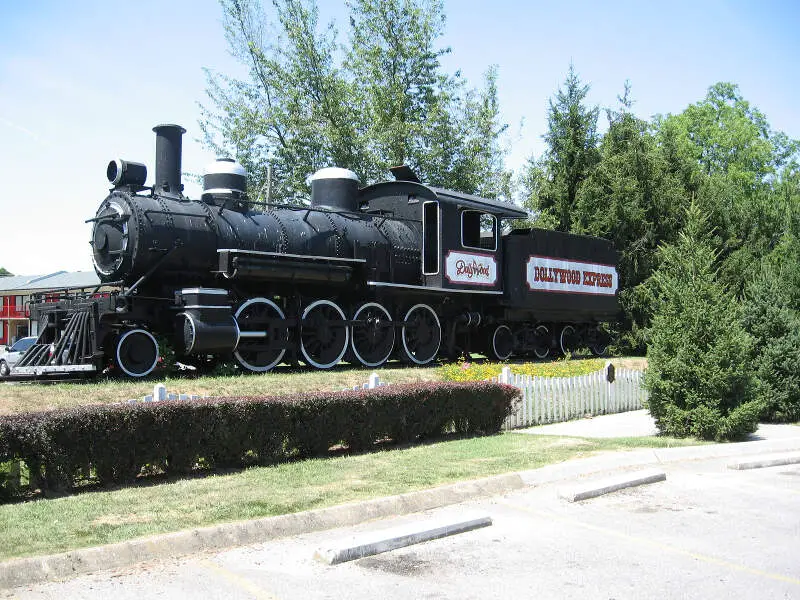
- Pigeon Forge
- Sweetwater
- Metropolitan Nashville Police Department
- Munford
- Ripley
- Chattanooga
What city has the highest murder rate in Tennessee? The city with the highest murder rate in Tennessee is Memphis with 40.6 murders per 100,000 people.
What is the city in Tennessee with highest number of murders? The city in Tennessee with the highest number of murders is Memphis with 249 murders.
Read on below to see how we crunched the numbers and how your town in Tennessee ranked. There were ‘only’ 35 cities in Tennessee where a city reported a murder to the FBI, meaning 61 places had no murder.
For more reading on the Volunteer State check out:
- Best Places To Live In Tennessee
- Cheapest Places To Live In Tennessee
- Most Dangerous Cities In Tennessee
The 10 Murder Capitals Of Tennessee For 2026


/10
Population: 613,207
Murders: 249 (Most)
Murders Per 100k: 40.6 (Most)
More on Memphis: Data | Crime | Cost Of Living | Movers

/10
Population: 19,729
Murders: 5 (8th Most)
Murders Per 100k: 25.3 (2nd Most)
More on Springfield: Data | Crime | Cost Of Living | Movers

/10
Population: 68,286
Murders: 17 (5th Most)
Murders Per 100k: 24.9 (3rd Most)
More on Jackson: Data | Crime | Cost Of Living | Movers

/10
Population: 15,917
Murders: 3 (11th Most)
Murders Per 100k: 18.8 (4th Most)
More on Dyersburg: Data | Crime | Cost Of Living | Movers

/10
Population: 6,344
Murders: 1 (26th Most)
Murders Per 100k: 15.8 (5th Most)
More on Pigeon Forge: Data | Crime | Cost Of Living | Movers

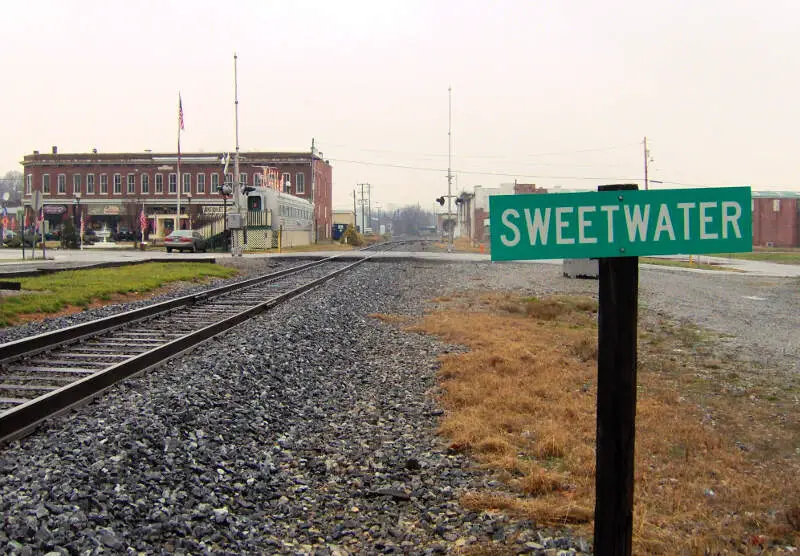
/10
Population: 6,696
Murders: 1 (26th Most)
Murders Per 100k: 14.9 (6th Most)
More on Sweetwater: Data | Crime | Cost Of Living | Movers
7. Metropolitan Nashville Police Department

Population: 698,987
Murders: 102 (2nd Most)
Murders Per 100k: 14.6 (7th Most)
More on Metropolitan Nashville Police Department: Movers

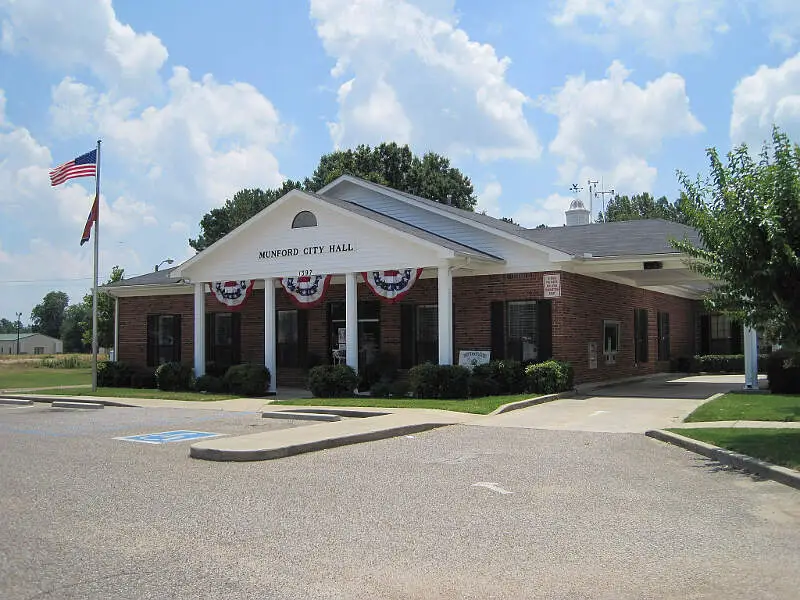
/10
Population: 6,901
Murders: 1 (26th Most)
Murders Per 100k: 14.5 (8th Most)
More on Munford: Data | Crime | Cost Of Living | Movers

/10
Population: 7,575
Murders: 1 (26th Most)
Murders Per 100k: 13.2 (9th Most)
More on Ripley: Data | Crime | Cost Of Living | Movers


/10
Population: 188,894
Murders: 24 (3rd Most)
Murders Per 100k: 12.7 (10th Most)
More on Chattanooga: Data | Crime | Cost Of Living | Movers
Methodology: How we calculated the murder capitals of Tennessee
While there are surveys and public polls on what cities in a state are the most dangerous, we wanted to rely on something other than speculation and opinion. Instead, we used Saturday Night Science to compare the hard numbers from the FBI’s last year of reporting. Specifically, we analyzed the FBI’s Uniform Crime Report, which summarizes the number of murders in each city annually.
We only looked at every single city in Tennessee for which FBI data was available for the most recent FBI Crime In The United States. That left us with 35 cities to rank.
We took the number of murders per capita as the ranking factor. The place with the most murders per capita based on the most recent data is Memphis. It is our eleventh time ranking the places with the most murders per capita in Tennessee. We updated the list for 2026.
Summary: The Places With The Most Murders In Tennessee For 2026
If you’re looking at the places in Tennessee with the most murders, and where residents have the highest chances of being killed themselves, this is an accurate list. Again, these statistics are an indication of where crimes occur, not a statement about the effectiveness of the law enforcement in the areas they serve.
The cities with the highest murder per capita in Tennessee are Memphis, Springfield, Jackson, Dyersburg, Pigeon Forge, Sweetwater, Metropolitan Nashville Police Department, Munford, Ripley, and Chattanooga.
For more Tennessee reading, check out:
- Best Places To Raise A Family In Tennessee
- Fastest Growing Cities In Tennessee
- Safest Places In Tennessee
- Best Cities For Singles In Tennessee
- Worst Places To Live In Tennessee
Murder Rates By City In Tennessee
| Rank | City | Population | Murders | Murders/100K |
|---|---|---|---|---|
| 1 | Memphis, TN | 613207 | 249 | 40.61 |
| 2 | Springfield, TN | 19729 | 5 | 25.34 |
| 3 | Jackson, TN | 68286 | 17 | 24.9 |
| 4 | Dyersburg, TN | 15917 | 3 | 18.85 |
| 5 | Pigeon Forge, TN | 6344 | 1 | 15.76 |
| 6 | Sweetwater, TN | 6696 | 1 | 14.93 |
| 7 | Metropolitan Nashville Police Department, TN | 698987 | 102 | 14.59 |
| 8 | Munford, TN | 6901 | 1 | 14.49 |
| 9 | Ripley, TN | 7575 | 1 | 13.2 |
| 10 | Chattanooga, TN | 188894 | 24 | 12.71 |
| 11 | Columbia, TN | 49374 | 6 | 12.15 |
| 12 | Knoxville, TN | 200457 | 22 | 10.97 |
| 13 | Oakland, TN | 11026 | 1 | 9.07 |
| 14 | Millington, TN | 11785 | 1 | 8.49 |
| 15 | Lenoir City, TN | 12354 | 1 | 8.09 |
| 16 | Lewisburg, TN | 13406 | 1 | 7.46 |
| 17 | Manchester, TN | 13626 | 1 | 7.34 |
| 18 | Athens, TN | 14949 | 1 | 6.69 |
| 19 | Dickson, TN | 16980 | 1 | 5.89 |
| 20 | Lebanon, TN | 51653 | 3 | 5.81 |
| 21 | Goodlettsville, TN | 17312 | 1 | 5.78 |
| 22 | Johnson City, TN | 74093 | 4 | 5.4 |
| 23 | La Vergne, TN | 39897 | 2 | 5.01 |
| 24 | Clarksville, TN | 185349 | 9 | 4.86 |
| 25 | Tullahoma, TN | 21208 | 1 | 4.72 |
| 26 | East Ridge, TN | 21886 | 1 | 4.57 |
| 27 | Cleveland, TN | 49482 | 2 | 4.04 |
| 28 | Shelbyville, TN | 25655 | 1 | 3.9 |
| 29 | Kingsport, TN | 57138 | 2 | 3.5 |
| 30 | Hendersonville, TN | 64126 | 2 | 3.12 |
| 31 | Morristown, TN | 32660 | 1 | 3.06 |
| 32 | Murfreesboro, TN | 169520 | 5 | 2.95 |
| 33 | Gallatin, TN | 52346 | 1 | 1.91 |
| 34 | Smyrna, TN | 58791 | 1 | 1.7 |
| 35 | Franklin, TN | 90077 | 1 | 1.11 |