
Whitest cities in Illinois research summary. We analyzed Illinois’s most recent Census data to determine the whitest cities in Illinois based on the percentage of White residents. Here are the results of our analysis:
-
The whitest city in Illinois is Litchfield based on the most recent Census data.
-
Litchfield is 98.78% White.
-
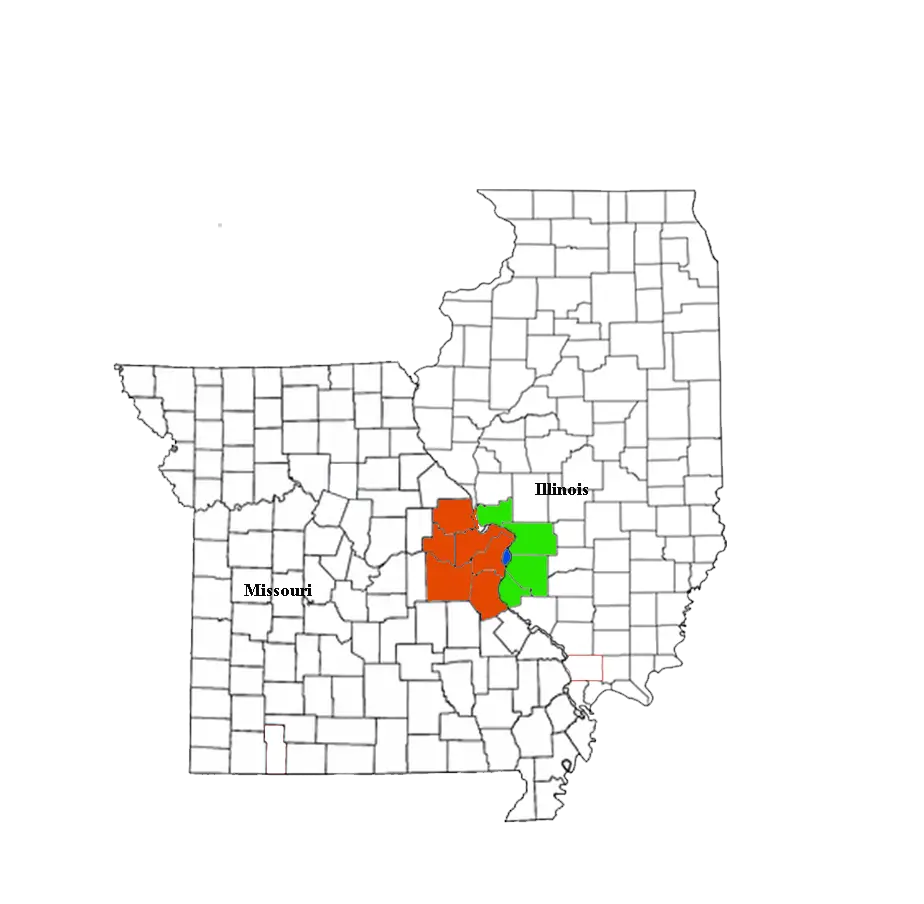
The least White city in Illinois is East St. Louis.
-
East St. Louis is 1.63% White.
-
Illinois is 58.7% White.
-
Illinois is the 36th Whitest state in the United States.
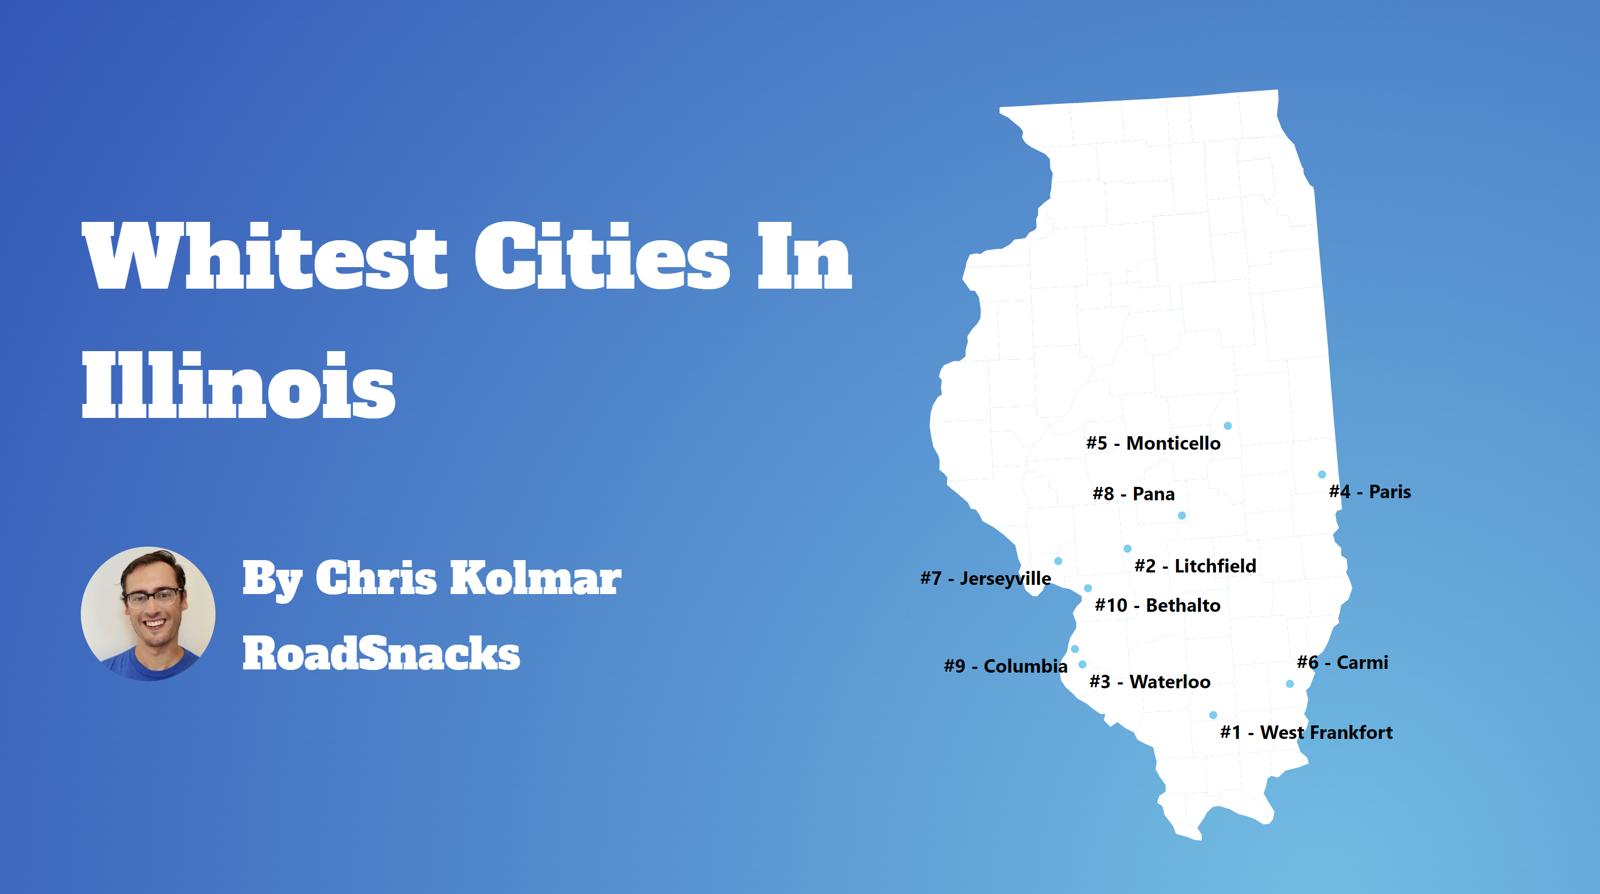
Table Of Contents: Top Ten | Methodology | Summary | Table
Today, we are looking at the whitest places in Illinois. We won’t measure the number of Whole Foods or Pottery Barns per capita. Instead, we’ll focus on the Census data’s report of race by place in Illinois. In particular, we ranked each place in Illinois by the percentage of white people.
So where are the whitest cities you can live in Illinois?
After analyzing cities with populations greater than 5,000, we came up with this list as the whitest cities in Illinois for 2025.
Here are the 10 whites places in Illinois for 2025:
- Litchfield
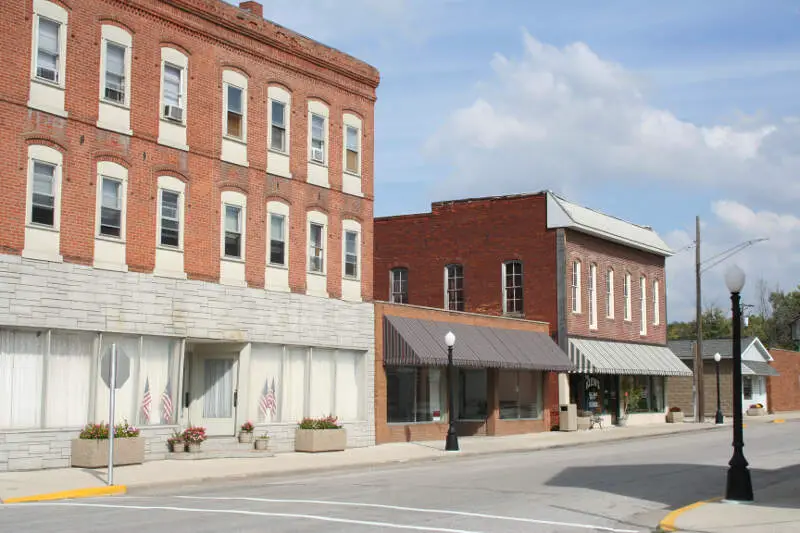
- West Frankfort
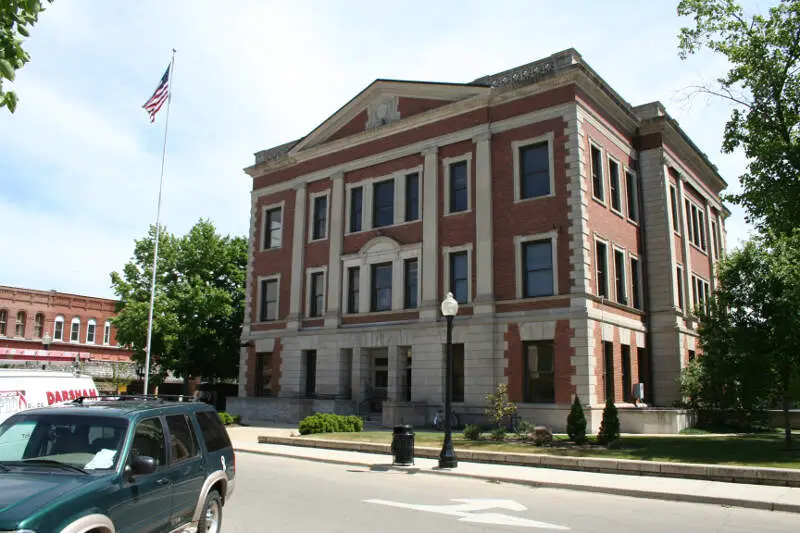
- Paris
- Waterloo
- Jerseyville
- Monticello
- Bethalto
- Columbia
- Washington
- Taylorville
What is the whitest city in Illinois for 2025? According to the most recent census data Litchfield ranks as the whitest. If you’re wondering, East St. Louis is the least white city of all those we measured.
Read on below to see where your hometown ranked and why. Or check out the whitest states in America and the most diverse states in America.
For more Illinois reading, check out:
The 10 Whitest Cities In Illinois For 2025
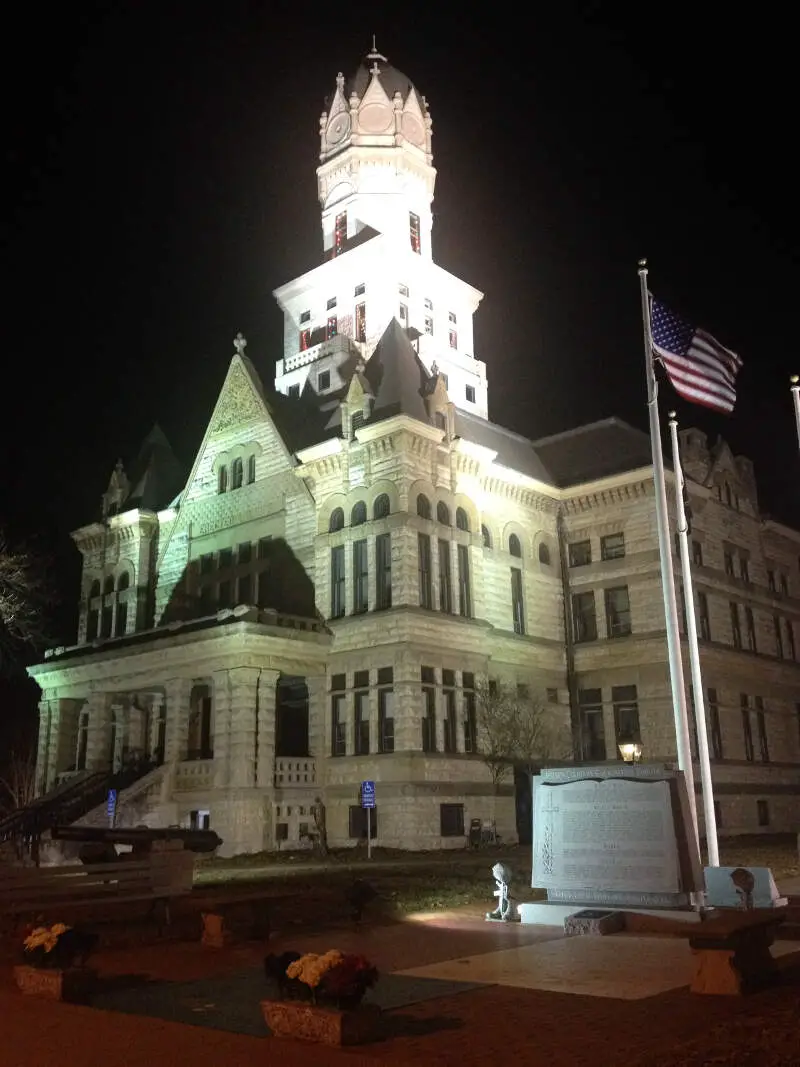
1. Litchfield, IL<

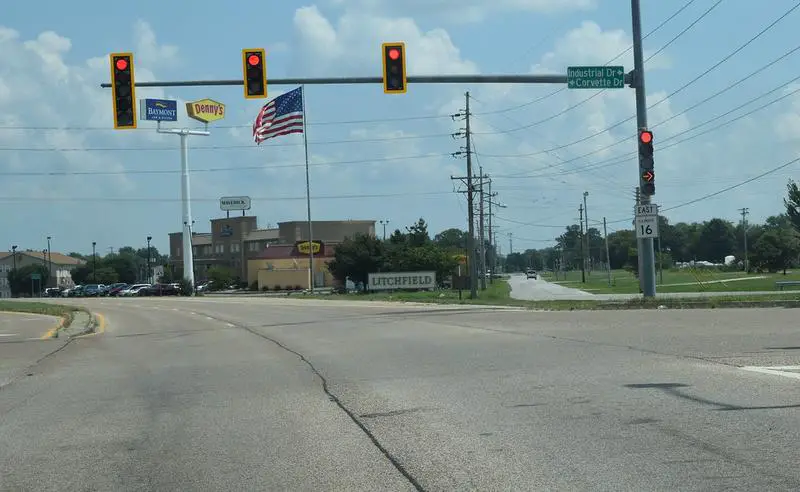
/10
Population: 6,814
% White: 98.78%
More on Litchfield:

/10
Population: 7,156
% White: 96.09%
More on West Frankfort: Data

/10
Population: 8,154
% White: 95.85%
More on Paris: Data

/10
Population: 11,055
% White: 95.42%
More on Waterloo: Data
5. Jerseyville, IL<

/10
Population: 7,432
% White: 95.4%
More on Jerseyville:

/10
Population: 6,332
% White: 94.74%
More on Monticello: Data

/10
Population: 9,244
% White: 94.68%
More on Bethalto: Data
8. Columbia, IL<

/10
Population: 11,063
% White: 94.06%
More on Columbia:

/10
Population: 15,946
% White: 93.55%
More on Washington: Data

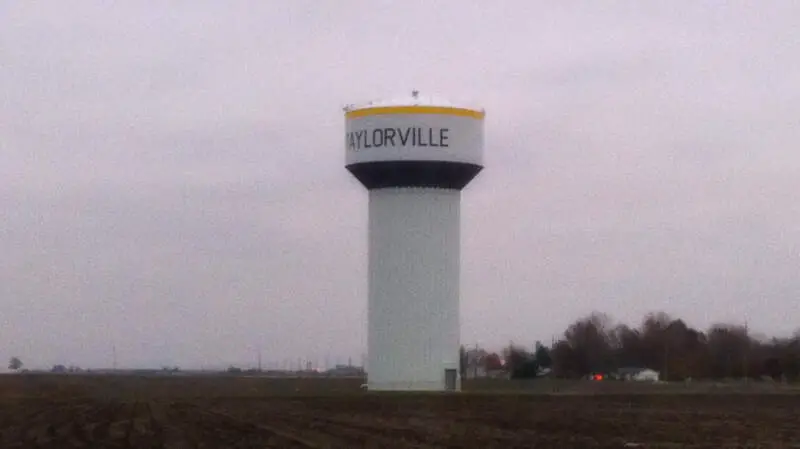
/10
Population: 11,149
% White: 92.99%
More on Taylorville: Data
Methodology: How we determined the whitest places in Illinois for 2025
To rank the whitest places in Illinois, we used Saturday Night Science to look at Census demographic data.
We had to look at the number of white people living in each city in Illinois on a per capita basis. In other words, the percentage of white people living in each city in Illinois.
We looked at table B03002: Hispanic OR LATINO ORIGIN BY RACE. Here are the category names as defined by the Census:
- Hispanic or Latino
- White alone*
- Black or African American alone*
- American Indian and Alaska Native alone*
- Asian alone*
- Native Hawaiian and Other Pacific Islander alone*
- Some other race alone*
- Two or more races*
Our particular column of interest here was the number of people who identified as White alone.
We limited our analysis to town with a population greater than 5,000 people. That left us with 324 cities.
We then calculated the percentage of residents that are White. The percentages ranked from 98.8% to 1.6%.
Finally, we ranked each city based on the percentage of White population, with a higher score being more White than a lower score. Litchfield took the distinction of being the most White, while East St. Louis was the least White city.
We updated this article for 2025. This report represents our tenth time ranking the whitest cities in Illinois.
Read on for more information on how the cities in Illinois ranked by population of White residents or, for a more general take on diversity in America, head over to our ranking of the most diverse cities in America.
Summary: White Populations Across Illinois
We measured the locations with the highest percentage of white people in Illinois. According to the most recent data, this list provides accurate information on the whitest places in Illinois.
The most White cities in Illinois are Litchfield, West Frankfort, Paris, Waterloo, Jerseyville, Monticello, Bethalto, Columbia, Washington, and Taylorville.
If you’re curious enough, here are the least White places in Illinois:
- East St. Louis
- Calumet Park
- Riverdale
For more Illinois reading, check out:
- Best Places To Raise A Family In Illinois
- Worst Places To Live In Illinois
- Most Dangerous Cities In Illinois
White Population By City In Illinois
| Rank | City | Population | White Population | % White |
|---|---|---|---|---|
| 1 | Litchfield | 6,814 | 6,731 | 98.78% |
| 2 | West Frankfort | 7,156 | 6,876 | 96.09% |
| 3 | Paris | 8,154 | 7,816 | 95.85% |
| 4 | Waterloo | 11,055 | 10,549 | 95.42% |
| 5 | Jerseyville | 7,432 | 7,090 | 95.4% |
| 6 | Monticello | 6,332 | 5,999 | 94.74% |
| 7 | Bethalto | 9,244 | 8,752 | 94.68% |
| 8 | Columbia | 11,063 | 10,406 | 94.06% |
| 9 | Washington | 15,946 | 14,918 | 93.55% |
| 10 | Taylorville | 11,149 | 10,367 | 92.99% |
| 11 | Glencoe | 8,715 | 8,083 | 92.75% |
| 12 | Eureka | 5,095 | 4,693 | 92.11% |
| 13 | Effingham | 12,258 | 11,289 | 92.09% |
| 14 | Mount Carmel | 6,892 | 6,347 | 92.09% |
| 15 | East Peoria | 22,485 | 20,704 | 92.08% |
| 16 | Hoopeston | 5,039 | 4,633 | 91.94% |
| 17 | Olney | 8,864 | 8,144 | 91.88% |
| 18 | Harrisburg | 8,608 | 7,890 | 91.66% |
| 19 | Morton | 16,503 | 15,013 | 90.97% |
| 20 | Mattoon | 16,334 | 14,798 | 90.6% |
| 21 | Pana | 5,277 | 4,768 | 90.35% |
| 22 | Troy | 10,889 | 9,833 | 90.3% |
| 23 | Coal City | 5,145 | 4,640 | 90.18% |
| 24 | Winnetka | 12,508 | 11,279 | 90.17% |
| 25 | Salem | 7,341 | 6,609 | 90.03% |
| 26 | Bartonville | 5,854 | 5,259 | 89.84% |
| 27 | Carlinville | 5,574 | 5,006 | 89.81% |
| 28 | Mount Zion | 6,076 | 5,451 | 89.71% |
| 29 | New Lenox | 27,456 | 24,607 | 89.62% |
| 30 | Pekin | 31,812 | 28,509 | 89.62% |
| 31 | East Alton | 5,729 | 5,129 | 89.53% |
| 32 | Chatham | 14,740 | 13,191 | 89.49% |
| 33 | Highland | 10,268 | 9,186 | 89.46% |
| 34 | Geneseo | 6,577 | 5,881 | 89.42% |
| 35 | Benton | 7,076 | 6,325 | 89.39% |
| 36 | Carterville | 5,822 | 5,170 | 88.8% |
| 37 | Clinton | 7,012 | 6,213 | 88.61% |
| 38 | Mokena | 19,906 | 17,632 | 88.58% |
| 39 | Western Springs | 13,353 | 11,804 | 88.4% |
| 40 | Princeton | 7,829 | 6,920 | 88.39% |
| 41 | Braidwood | 6,175 | 5,457 | 88.37% |
| 42 | Elburn | 6,054 | 5,336 | 88.14% |
| 43 | Lincoln | 13,406 | 11,809 | 88.09% |
| 44 | Godfrey | 17,743 | 15,615 | 88.01% |
| 45 | Sugar Grove | 9,233 | 8,109 | 87.83% |
| 46 | Campton Hills | 10,724 | 9,378 | 87.45% |
| 47 | Maryville | 8,280 | 7,198 | 86.93% |
| 48 | Homer Glen | 24,516 | 21,310 | 86.92% |
| 49 | Deerfield | 19,185 | 16,640 | 86.73% |
| 50 | Manteno | 8,942 | 7,752 | 86.69% |
| 51 | Johnsburg | 6,374 | 5,524 | 86.66% |
| 52 | Peoria Heights | 5,834 | 5,050 | 86.56% |
| 53 | Wood River | 10,315 | 8,923 | 86.51% |
| 54 | Quincy | 39,188 | 33,813 | 86.28% |
| 55 | Palos Heights | 11,817 | 10,185 | 86.19% |
| 56 | Canton | 13,408 | 11,537 | 86.05% |
| 57 | Mahomet | 9,755 | 8,387 | 85.98% |
| 58 | Chillicothe | 6,185 | 5,317 | 85.97% |
| 59 | Sandwich | 7,121 | 6,121 | 85.96% |
| 60 | Du Quoin | 5,780 | 4,960 | 85.81% |
| 61 | Lemont | 17,643 | 15,123 | 85.72% |
| 62 | Sycamore | 18,243 | 15,578 | 85.39% |
| 63 | Edwardsville | 26,543 | 22,596 | 85.13% |
| 64 | Marion | 16,796 | 14,292 | 85.09% |
| 65 | Herrin | 12,271 | 10,430 | 85.0% |
| 66 | Peru | 9,863 | 8,376 | 84.92% |
| 67 | Wilmington | 5,507 | 4,676 | 84.91% |
| 68 | Northfield | 5,683 | 4,820 | 84.81% |
| 69 | Lockport | 26,228 | 22,237 | 84.78% |
| 70 | Robinson | 7,005 | 5,934 | 84.71% |
| 71 | Marengo | 7,123 | 6,022 | 84.54% |
| 72 | Milan | 5,037 | 4,232 | 84.02% |
| 73 | Willow Springs | 5,871 | 4,932 | 84.01% |
| 74 | Morris | 14,775 | 12,332 | 83.47% |
| 75 | Ottawa | 18,714 | 15,582 | 83.26% |
| 76 | Rockton | 8,238 | 6,851 | 83.16% |
| 77 | Geneva | 21,299 | 17,653 | 82.88% |
| 78 | Lake Zurich | 19,727 | 16,350 | 82.88% |
| 79 | Park Ridge | 39,241 | 32,474 | 82.76% |
| 80 | Charleston | 17,212 | 14,222 | 82.63% |
| 81 | Metropolis | 5,898 | 4,865 | 82.49% |
| 82 | Lake Forest | 19,190 | 15,816 | 82.42% |
| 83 | Pontiac | 11,483 | 9,453 | 82.32% |
| 84 | Glen Carbon | 13,521 | 11,115 | 82.21% |
| 85 | Channahon | 13,854 | 11,374 | 82.1% |
| 86 | Downers Grove | 49,867 | 40,917 | 82.05% |
| 87 | Lake Bluff | 5,834 | 4,785 | 82.02% |
| 88 | Jacksonville | 17,490 | 14,298 | 81.75% |
| 89 | Roscoe | 10,881 | 8,893 | 81.73% |
| 90 | Batavia | 26,730 | 21,787 | 81.51% |
| 91 | Barrington | 11,049 | 8,991 | 81.37% |
| 92 | Palos Hills | 18,139 | 14,746 | 81.29% |
| 93 | West Dundee | 7,867 | 6,385 | 81.16% |
| 94 | Libertyville | 20,493 | 16,575 | 80.88% |
| 95 | Crystal Lake | 40,436 | 32,697 | 80.86% |
| 96 | Clarendon Hills | 8,642 | 6,987 | 80.85% |
| 97 | Manhattan | 10,315 | 8,337 | 80.82% |
| 98 | Spring Grove | 5,866 | 4,738 | 80.77% |
| 99 | Machesney Park | 22,744 | 18,318 | 80.54% |
| 100 | Centralia | 12,009 | 9,670 | 80.52% |
Pretty humorous list, Now do a list of “blackest” cities in Illinois using a bunch of stereotypical criteria and see how that flies.
My thoughts exactly. Although, I’m still not really understanding whitest. Perhaps in the same category as white privilege? Anyhoo. More useless information from internet, silly me.
It’s quite ridiculous that you get huffy about people not agreeing with “fact based” data when you subsequently come up with a list based off of coffee house to yoga parlor ratios. I wonder what my math teacher would say about those ratios…
It is BS (Bad Sociology) to use % white in total population. The question is, what % white is the HOUSEHOLD population. The notorious Anna, still known locally as “Ain’t No N* Allowed,” has about 75 African Americans in the IL State Mental Hospital, so it does not occur on this list. The first capital of IL, Vandalia, has about 1,300 African Americans, of whom about 1,300 are males age 18-70. They are in prison! And so it goes. For serious research on white IL cities, see the book SUNDOWN TOWNS.