
More and more people would prefer to live in the cities and towns that surround Los Angeles to avoid all the hustle and bustle.
So the question arises: what suburbs of Los Angeles are the worst?
Today, we’ll use Saturday Night Science to determine which Los Angeles ‘burbs need a little tender loving care – the sore thumbs of the Los Angeles area if you will. Realistically, you can only expect some of the suburbs to live up to Los Angeles proper, although Manhattan Beach certainly tries.
We examined the 78 biggest suburbs of Los Angeles to find out the worst places to live. And while you won’t necessarily find them on the worst places to live in California lists, these ten places are a little too far downwind of Los Angeles in terms of quality of life.
Table Of Contents: Top Ten | Methodology | Summary | Table
The 10 worst suburbs around Los Angeles for 2025
Now don’t freak out.
What’s the worst suburb of Los Angeles? South El Monte ranks as the worst suburb of Los Angeles for 2025 based on the most recent Census and FBI data.
Or, if you’re thinking of moving to elsewhere in California check out the best places in California overall or the worst.
And remember, there are some good places to live around Los Angeles too.
The 10 Worst Los Angeles Suburbs To Live For 2025

/10
Population: 19,413
Median Income: $67,153 (7th lowest)
Unemployment Rate: 7.5% (15th highest)
Median Home Value: $741,557 (20th lowest)
More on South El Monte: Data | Crime | Cost Of Living
We’ll get the ball rolling with South El Monte, the absolute worst place to live around Los Angeles according to the data.
And in the world of worst rankings, South El Monte beat the competition pretty handily thanks to scoring in the bottom 15% in three major categories. Income is the 7th worst in the Los Angeles area, and to make matters worse, the city ranks 20th worst when it comes to home values.
But hey, at least it’s cheap to live there. But there’s a reason for that… it’s South El Monte.
You won’t feel bad about not having a great income for the area. There aren’t a bunch of places to spend your money anyway.

/10
Population: 53,658
Median Income: $56,952 (3rd lowest)
Unemployment Rate: 9.6% (3rd highest)
Median Home Value: $657,657 (7th lowest)
More on Huntington Park: Data | Crime | Cost Of Living
Welcome to Huntington Park. Home to KMart, Big Lots, and a lot of gas stations.
This city is 11.4 miles to Los Angeles. Income levels here are the 3rd lowest in the metro area, where families bring in about $56,952 a year, which only goes so far even on a shoestring budget.
But on the bright side, there are a lot of fast food joints in the area.

/10
Population: 22,325
Median Income: $52,748 (lowest)
Unemployment Rate: 8.9% (6th highest)
Median Home Value: $663,236 (8th lowest)
More on Cudahy: Data | Crime | Cost Of Living
Back up the highway we go for the third worst Los Angeles suburb you can live in. You might have expected to see Cudahy on here. While the cost of living is low, your entertainment and work options are limited. And that’s an understatement.
In terms of numbers, it’s in the worst 15% for insurance, and the adult high school dropout rate is poor compared to other Los Angeles suburbs.
But at least there are lovely parks to bring the kids during the day.

/10
Population: 65,291
Median Income: $70,236 (9th lowest)
Unemployment Rate: 9.8% (2nd highest)
Median Home Value: $671,051 (9th lowest)
More on Lynwood: Data | Crime | Cost Of Living
If you live in Lynwood, most likely you struggle to make ends meet every month. It ranks as the 9th lowest Los Angeles suburb for median household incomes.
Not only that, but this is the 2nd worst unemployed suburb you can live in if you choose to live near Los Angeles. Remember, we looked at 78 cities for this study.
Lynwood is about 13.7 miles to downtown.

/10
Population: 32,830
Median Income: $60,641 (4th lowest)
Unemployment Rate: 7.4% (17th highest)
Median Home Value: $674,383 (10th lowest)
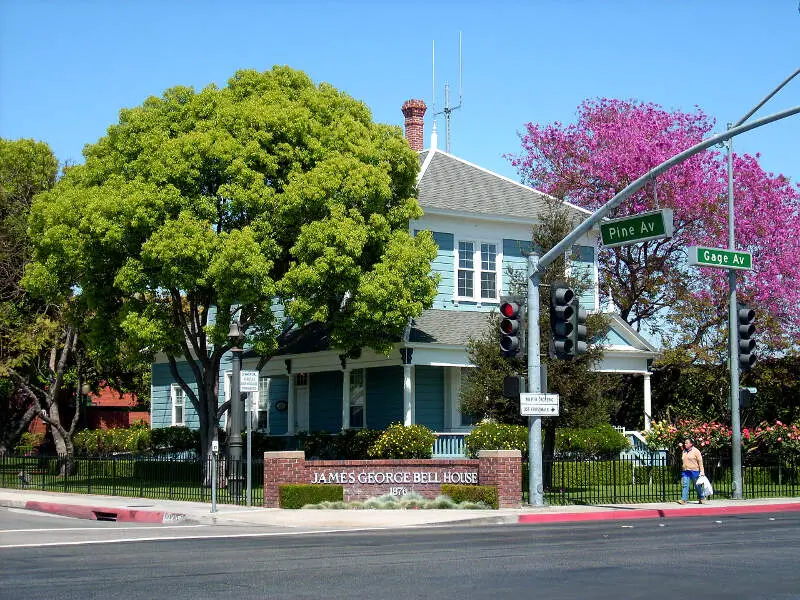
More on Bell: Data | Crime | Cost Of Living
Bell has the distinction of being a Los Angeles suburb. Which means that’s about all it has going for it.
All snarkiness aside, Bell has the 10th lowest home values in the metro Los Angeles area, where the median price is $674,383. The median income is $250,001.
Bell has an unemployment rate of 7.38% which ranks 17th worst.

/10
Population: 93,525
Median Income: $74,270 (16th lowest)
Unemployment Rate: 7.1% (19th highest)
Median Home Value: $618,800 (3rd lowest)
More on Compton: Data | Crime | Cost Of Living
Compton has 93,525 residents that probably know it’s a pretty crummy place to live when you look at the data. (Or, if you’ve ever been there, you don’t need to look at the data.)
Incomes are towards the bottom, and the poverty rate sits at 17.068566034497554%.

/10
Population: 24,593
Median Income: $61,655 (5th lowest)
Unemployment Rate: 6.4% (27th highest)
Median Home Value: $636,861 (6th lowest)
More on Maywood: Data | Crime | Cost Of Living
Ah, Maywood. You rank as the 7th worst place to live around Los Angeles.
It’s the place with the 27th most out of work residents in the Los Angeles metro area (6.37%).

/10
Population: 38,661
Median Income: $55,372 (2nd lowest)
Unemployment Rate: 6.0% (35th highest)
Median Home Value: $679,797 (11th lowest)
More on Bell Gardens: Data | Crime | Cost Of Living
Bell Gardens is a city about 15.2 miles from Los Angeles, but Los Angeles probably wishes it was further away. It ranks as the 8th worst burb for 2018.
You’d be hard-pressed to find a worse place to live. Bell Gardens has the 3rd most uninsured people, 2nd worst incomes, and has the 35th highest unemployment rate (6.01%) in the entire Los Angeles metro area.
Homes only cost $679,797 for a reason. That’s cheap for Los Angeles standards.

/10
Population: 12,072
Median Income: $71,768 (13th lowest)
Unemployment Rate: 4.5% (68th highest)
Median Home Value: $682,089 (12th lowest)
More on Commerce: Data | Crime | Cost Of Living
If you absolutely have to live near Los Angeles, then Commerce might be a place for you to consider as it’s only the 9th worst Los Angeles suburb.
About 4.51% of residents are out of work.

/10
Population: 107,066
Median Income: $64,484 (6th lowest)
Unemployment Rate: 6.4% (26th highest)
Median Home Value: $748,405 (23rd lowest)
More on El Monte: Data | Crime | Cost Of Living
Rounding out the ten worst Los Angeles suburbs to call home is El Monte.
Located 22.2 miles outside the city, El Montes is a real pit when you look at the data. Its residents have the 26th highest unemployment rate (6.43%), and poverty is far above the area average.
Methodology: Determining The Worst Suburbs Around Los Angeles for 2025
To figure out how bad a Los Angeles suburb is to live in, we used Saturday Night Science to identify the kinds of things people like and then decide what suburbs have the least amount of those things.
Using the most recent American Community Survey data from 2019-2023, this is the criteria we used:
- High unemployment rate
- Low median household incomes
- Low population density (no things to do)
- Low home values
- A lot of high school dropouts
- High poverty
- High rate of uninsured families
We defined a suburb as any town within 30 miles of Los Angeles.
We also limited the analysis to places with over 2,000 people. This left us with a grand total of 78 suburbs to evaluate around Los Angeles.
We ranked each place with scores from 1 to 78 in each category, where 1 was the “worst.”
Next, we averaged the rankings for each place to create a quality-of-life index.
And finally, we crowned the city with the worst quality of life index, the “Worst Suburb near Los Angeles.” We’re looking at you, South El Monte.
We updated this article for 2025, which reflects our tenth time ranking the worst suburbs around Los Angeles.
Summary: The areas around Los Angeles where the dream is more of a nightmare for 2025
Well there you have it — the worst of the ‘burbs surrounding Los Angeles with South El Monte casting itself ahead of the pack.
The worst suburbs of Los Angeles are .
As we mentioned earlier, the suburbs around Los Angeles aren’t all bad. Manhattan Beach takes the cake as the best place to live around Los Angeles.
- Manhattan Beach
- Palos Verdes Estates
- Hermosa Beach
For more California reading, check out:
- Best Places To Live In California
- Cheapest Places To Live In California
- Most Dangerous Cities In California
- Best Places To Retire In California
- Richest Cities In California
- Safest Places In California
- Worst Places To Live In California
Detailed List Of The Worst Los Angeles Suburbs
| Rank | City | Population | Median Income | Median Home Values |
|---|---|---|---|---|
| 1 | South El Monte | 19,413 | $67,153 | $741,557 |
| 2 | Huntington Park | 53,658 | $56,952 | $657,657 |
| 3 | Cudahy | 22,325 | $52,748 | $663,236 |
| 4 | Lynwood | 65,291 | $70,236 | $671,051 |
| 5 | Bell | 32,830 | $60,641 | $674,383 |
| 6 | Compton | 93,525 | $74,270 | $618,800 |
| 7 | Maywood | 24,593 | $61,655 | $636,861 |
| 8 | Bell Gardens | 38,661 | $55,372 | $679,797 |
| 9 | Commerce | 12,072 | $71,768 | $682,089 |
| 10 | El Monte | 107,066 | $64,484 | $748,405 |
| 11 | South Gate | 91,836 | $71,315 | $684,709 |
| 12 | Paramount | 52,546 | $70,912 | $636,557 |
| 13 | Inglewood | 105,575 | $71,029 | $743,315 |
| 14 | Montebello | 61,376 | $74,955 | $801,430 |
| 15 | Hawaiian Gardens | 13,816 | $76,025 | $631,559 |
| 16 | Azusa | 49,318 | $85,727 | $701,979 |
| 17 | Hawthorne | 85,933 | $72,719 | $858,972 |
| 18 | Baldwin Park | 70,720 | $79,087 | $705,138 |
| 19 | Lawndale | 31,113 | $83,538 | $773,902 |
| 20 | San Fernando | 23,716 | $79,694 | $737,759 |
| 21 | Bellflower | 77,396 | $77,602 | $779,864 |
| 22 | Stanton | 38,639 | $81,455 | $781,941 |
| 23 | La Puente | 37,404 | $84,811 | $706,494 |
| 24 | Long Beach | 458,491 | $83,969 | $835,128 |
| 25 | Westlake | 4,794 | $67,691 | $178,709 |
| 26 | Glendale | 192,270 | $84,262 | $1,162,084 |
| 27 | Santa Fe Springs | 19,310 | $86,857 | $766,481 |
| 28 | Pico Rivera | 60,821 | $86,956 | $734,403 |
| 29 | Rosemead | 50,340 | $72,248 | $890,595 |
| 30 | Artesia | 16,044 | $97,712 | $844,035 |
| 31 | Carson | 93,523 | $107,391 | $777,291 |
| 32 | Gardena | 59,765 | $79,291 | $773,727 |
| 33 | Monterey Park | 59,639 | $77,605 | $900,198 |
| 34 | Temple | 5,655 | $89,269 | $285,240 |
| 35 | Norwalk | 100,713 | $98,709 | $742,357 |
| 36 | Los Alamitos | 11,784 | $98,539 | $1,504,880 |
| 37 | La Habra | 62,233 | $98,158 | $882,620 |
| 38 | Duarte | 21,921 | $97,952 | $784,226 |
| 39 | Fullerton | 141,278 | $104,219 | $1,012,509 |
| 40 | West Covina | 107,436 | $98,570 | $829,440 |
| 41 | Downey | 111,793 | $87,400 | $856,711 |
| 42 | Signal Hill | 11,563 | $102,303 | $695,025 |
| 43 | San Gabriel | 38,764 | $87,592 | $1,079,739 |
| 44 | Whittier | 85,925 | $92,374 | $800,239 |
| 45 | Monrovia | 37,553 | $97,083 | $971,411 |
| 46 | Alhambra | 81,483 | $85,189 | $912,963 |
| 47 | Pasadena | 136,462 | $103,778 | $1,179,361 |
| 48 | Buena Park | 83,052 | $108,187 | $907,830 |
| 49 | West Hollywood | 35,090 | $94,844 | $1,016,264 |
| 50 | Lomita | 20,409 | $92,920 | $899,830 |
| 51 | Santa Clarita | 229,021 | $119,926 | $792,509 |
| 52 | Seal Beach | 24,868 | $83,045 | $807,584 |
| 53 | Calabasas | 22,869 | $157,938 | $1,672,456 |
| 54 | Simi Valley | 125,769 | $117,703 | $835,113 |
| 55 | Beverly Hills | 31,955 | $127,979 | $3,444,707 |
| 56 | Lakewood | 80,510 | $116,794 | $852,670 |
| 57 | Malibu | 10,516 | $192,159 | $3,205,716 |
| 58 | Thousand Oaks | 125,676 | $134,367 | $1,033,821 |
| 59 | Cypress | 49,531 | $124,167 | $1,042,517 |
| 60 | Santa Monica | 91,535 | $109,739 | $1,645,444 |
| 61 | Arcadia | 55,550 | $116,142 | $1,371,745 |
| 62 | Torrance | 143,499 | $113,105 | $1,155,338 |
| 63 | La Mirada | 46,945 | $110,177 | $858,129 |
| 64 | Cerritos | 48,340 | $133,953 | $1,045,550 |
| 65 | Agoura Hills | 19,881 | $171,944 | $1,219,811 |
| 66 | La Palma | 15,375 | $115,833 | $1,138,017 |
| 67 | Hidden Hills | 2,079 | $250,001 | $5,067,420 |
| 68 | Rolling Hills Estates | 8,158 | $187,500 | $1,871,459 |
| 69 | El Segundo | 16,863 | $149,149 | $1,668,465 |
| 70 | Rancho Palos Verdes | 41,259 | $175,307 | $1,791,757 |
| 71 | La Habra Heights | 5,546 | $186,837 | $1,386,098 |
| 72 | South Pasadena | 26,297 | $128,105 | $1,617,943 |
| 73 | San Marino | 12,279 | $187,633 | $2,708,353 |
| 74 | Redondo Beach | 69,814 | $144,588 | $1,454,228 |
| 75 | Sierra Madre | 11,020 | $141,094 | $1,396,581 |
| 76 | Hermosa Beach | 19,248 | $152,019 | $2,159,662 |
| 77 | Palos Verdes Estates | 13,047 | $247,500 | $2,688,953 |
| 78 | Manhattan Beach | 34,584 | $193,904 | $3,076,975 |
☆☆☆☆☆SHARE & Pass this message around☆☆☆☆☆☆
First, whoever wrote this article took the worse pictures to provide the worse impression of the Antelope Valley, The writer obviously failed to do their research which shows incompetancy and ignorance on their ability to write a true and factual story.
Any article that states ” dont shoot the messagnger- means its solely based on this person opinions and no actual facts.
I honestly dont believe the writer of this article even knows how to write an article with any facts whatsoever.
Lancaster, Palmdale, and Quartz Hill have a lot more to offer than open dirt fields and nothing to do. People fail to realize that our location is the perfect location as we are 1 hour away from everything.you could possibly want to do.
From mountains, outdoor hiking, traveling to the beaches, heading out dirt bike & quad riding, fishing, snowboarding, and much more we have the capability to do it all.
I am so sick of outsiders and insiders not giving these towns the credit they deserve. Yes, we have some areas we could clean up and beautify. Like the eastside of both our major towns.
And, yes do we need more jobs? Most definately, but what city in California doesnt?
However, this author obviously wouldnt know a gem from a cortz if when he saw one.
It just goes to show how living in the trashy streets of LA wiuldnt allow him to appreciate and understand the simpler and easier life the Antelope Valley has to offer.
Community and country living offers to simple of a life for this narrow minded writer. I dont feel I need some big city minded folk tearing down our home towns.
Lancaster, Palmdale, and Quartz Hill is well worth living in and visiting for awhile we have so many community and home town events and actually care about the people in our cities.
I’m so sorry this was a misrepresentation of your towns. Your reply surely helps. Thank you.
Mistakes Recognized: I have placed the edited version of my statement in the facebook comments. Sadly, my autotext caused severe spelling errors in my above written statement. Hopefully, by posting this mistake publicly it will show the writer how to correct a mistake correctly when one is made.
Well I guess the only part of your article that has any value to it is that it will keep some people from the areas and slow down crowding. You could find some pretty amazing things about the Antelope Valley if you listened to the people who CHOOSE to live it. That’s right choose. They are passionate about the AV and all it has to offer. But don’t tell anyone, because then we would have the traffic, a slightly less % of parking and more people coming here who didn’t want to have to wait to see GOOD doctors, dentists. I can’t think of anything I need to do or go south to buy, that can’t be found here. There are GOOD jobs here too. AND hardworking people. “Hardworking people of Palos Verde?” I guess the same work is harder there? Or does $$$ equate with quality of life?
After you’ve made it you still have to spend it to live. The ratios? Also, if you are spending $$$ to live somewhere, you have less $$ and time to spend with family & friends.
On top of all of the ridiculousness, the pictures don’t even portray the cities of Lancaster, Palmdale, nor Quartz Hill! Let’s drive out to the middle of nowhere and take pictures of nothing! Whoever wrote this article is a totally blithering idiot and his company should fire him and be ashamed of allowing such extreme stupidity to be published.
Aubray you must not have lived long in the Antelope Valley if you think it’s all that. I was born and raised there and it went to shit in 1987. Did you also know it has the busiest 911 call average in the United States? ST33 and ST131. Also you have one of the highest violent crime rates in the nation, not mention parolee’s. The Metrolink and the Syte prison was the final nail in the coffin for that place. It was a awesome to grow up, but it is a lost cause now. LA cesspool and Highway14 North is the supply line.
Bottom line. AV deserves #1
S. Skinner: Thank you for your response. I have lived in the Antelope Valley my whole life. Born in a city up north, traveled down to the AV when I was 2 yr. old- left the area for 2 years to live by the beach at 18- then moved back by the time I was almost 20. I’ve been here to see the area turn from towns into cities, watch the good ol’ AV Mall bloom into what it is today. I grew up in Eastside Lancaster which is one of the hardest hit areas in desperate need of clean up since the last economical fall. You talked in your reply about the AV having one of the highest violent crime rates in the nation. I’m not sure how long it has been since you have been to the area- but we didn’t even make the list. http://www.neighborhoodscout.com/neighborhoods/crime-rates/top100dangerous/
Don’t misunderstand me, our area has it problems, and there is definitely some work there is definitely some work that needs to be done. However, we have come a long way since our up and down past and we still have a long way to go, but I believe and always have believed that it can be done.
The AV Community is just that- a community- dedicated to helping one another. We have a lot to offer to tourist, families, and major businesses who want to invest in bringing their companies here. There’s tons of open land opportunities to develop on and even more educational perks for study and observation.
Sure, we have had our ups and downs- but what city hasn’t. Bottom Line: The facts are the facts and the AV isn’t on the list and the author of this original article is full of sh**
Though, I’m sorry you may have had a bad experience- and though I am sure other may have had their own as well we are much more than just a pile of dirt sitting somewhere in the middle of nowhere.
While the writer may have it wrong on some level, he also has it right. Yes, the photo may be somewhat misleading, but not much. If you know the history of the area going back about 30 years, it isn’t difficult to see how the decline occurred. Lancaster/Palmdale/QH once had a bright future. Much of the employment was tied to aerospace. That had it’s own advantages and drawback, too. No place that survives on essentially a single source for its employment is going to last without reinventing itself (take Pittsburg for example). That entire area has come to rely more on the prison system to provide jobs than attracting any other industry to the area. As a result, many families of the incarcerated have migrated to the area. Some bringing even more criminal elements with them. Having this higher concentration of renters vs. homeowners and add in the criminal element and there is no real mystery as to how the decline happened. Throw in corrupt city council and the apathy of the voters in the area (since a majority of the people moving in are low income) and the exodus of those with higher incomes. So, while you may enjoy Lancaster/Palmdale/QH and what it has to offer, as someone who grew up there and watched/experienced the decline, I can tell you that for me, it is a miserable place to live. In addition, even whenI was growing up there, the school system was terrible. Because of the affiliation with L.A. County, it seems that the teachers are left to thei own devices and many no longer cared.
Look, you can’t drive a decent car anywhere past Division street on the East side of Lancaster without being glared at by some a hole crossing the street as slow as possible with a chip on their shoulder. Go into a 7-11 over there and tell me you don’t feel the least bit apprehensive. There are places all over the valley that were once perfectly safe to be in, even at night as a kid, that are now at a minimum, risky to go into as an adult in broad daylight.
So, don’t fool yourself about the quality of life there. In fact, I’d love to see eh area go back to its former state. But that takes the current residents to insist on a better way of life. If you’re all satisfied with the way things are now, then life there will never get any better because you’re not demanding more and attracting industry through better education of your children.
you at least seem to have an open and intelligent perspective
R. Tuck: After reading your share I had to respond. I’m sorry to hear that your perspective of the AV has obviously downsized in someway. However, we are making strides. You discussed the issues with education and it’s not necessarily the teachers as it is the lack of them. A 9k shortage of teachers in the area with an increasing population does not help. I am blessed to be able to go into the schools and help out as often as I can, but I will tell you many of these teachers work 10-14 hour days going to meetings, dealing with children who seem to have a lack of respect for any being in front of them, but it’s only due to their non-life experiences in which they have yet to have gone through. I’m not sure what you do for a living, but many of our students are achieving amazing things.
I would like to encourage you to go to http://www.avstudentrecognition.com Here you will find my organization in which we recognize all the graduating students of the Antelope Valley who have obtained a 4.0 GPA for all 4 years of high school. Yes, that’s right- this is actually taking place in the Antelope Valley. Our teachers work day in and day out, have dedicated their time and efforts to these students to help them achieve amazing things.
Like, I previously said not all teachers are alike, but I can’t say the education problems are because of the teachers. Teaching a child starts at home. Parents have to contribute their time just as much as teachers to help a child find success.
A few good teachers and students don’t address all of the issues that make the area overall, terrible. In fact, those few bright spots you speak of will in all likelihood grow up, experience what life is like in places that don’t present an immediate threat to them or their families and leave. So, thank you for the efforts. For that I commend you. For me, though, I left and will never go back.
I travel for a living and I can tell you first hand that once you see how much your quality of life can improve by going elsewhere, you’ll wonder why you didn’t do it sooner. God gives you one life to live. Don’t waste it making excuses for a place that so many others tell you is miserable. Perhaps exploring their reasons may enlighten you and hopefully give you the same opportunity others have discovered to live life in a place where the likelihood of your being a victim of a crime is even or less than the odds of winning the lottery.
As for the article writer and for the ones leaving comments did u all for get that the a.v. has the highest rate for child abuse and sexual abuse in all of LA County and with that being said forget about no work, drugs, and gangs the abuse categories are enough to make the av #1 as the worst place to live.
I don’t know where you got your information about Lancaster, CA, or what you have
been smoking, but if you would rather live in Compton or Watts than Lancaster your
are insane. I noticed there was no mention of Lancaster’s beautiful minor league
baseball stadium, our world-class Lancaster Performing Arts Center, our national
soccer complex, Southern California’s largest and busiest 24-hr Fitness complex, our
newly revitalized downtown, the Antelope Valley College campus, Cinemark’s 22
theater movie facility, the Sage Planetarium, and many very nice, modern parks.
So u live in lancaster? Good to know. Lancaster is a very run down town with barely anything to do.
Matter of interpretation on how the AV is seen. I reside here since 2005. Nothing negative said about how the SFV changed in the 1960-2005, from a beautiful home, in my own opinion, into a gutterswamp filled with changes I fail to comprehend, also in my own opinion. I moved out to Palmdale in 2005, then to Lancaster in 2007, further north after that. The residents that live above Lancaster feel the issues of the AV infiltrates their Payton place and threatens their livelihood, as mentioned in various postings of theirs. It seems indicative of mankind to spread out and bring with him his “issues” that comes across as his “trash”. Not to mention, Lancaster becomes a dumping ground for criminals and homeless. I see it first hand every day. GR lines increase, more places exclude homeless, save for churches, food giveaways, homeless shelters. I hear more griping out on the streets, see it in the editorials, online. LASD is looked at with disdain as theyhave to deal with hoodlums, released parolees, and the public. Despite having a decent mall, a few movie theaters and a good community college, the embittered and embattled feeling that either AV is home or sewer is a matter of personal interpretation. I still think SFV is a sewer, since I’d seen it changed before my eyes from the above decades mentioned. AV may not be so different, but not the same. Listen to police calls on a scanner, and one would think AV is a warzone. But, is it? That is a question best asked of each person that lives and works in the AV, isn’t it?
My problem is that its classist.
My sisters and I grew up on free school lunch program, the “entitlements” that Rush Limbaugh and Bill O’Reilly rant about. We lived in a North OC house beginning in 1972. Never had a problem with crime even though it is right up against some iffy looking apartments (back then, the apartments had little white-haired old ladies but now that it’s more brown, it hasn’t changed the safety of the area). My Mom still lives there. The most exciting thing in our neighborhood to happen in over 40 years were two apartment building fires next door. We were poor because my father was an auto mechanic and my mom stayed home to raise us. But we weren’t dumb. We all graduated from college, my sister with honors in music (pianist), my other sister become a doctor, my other sister is a teacher in one of the best-paid school districts in the IE. I myself earned two degrees. Both of our parents had no degree. Being on school lunch program didn’t mean we were trash. Living in a low income area doesn’t mean you’re a Welfare queen. The leading cause of poverty is being a SINGLE MOTHER, so blame divorce and family breakup, not “lifestyle” for the problem. The second leading cause of poverty (and bankruptcy) is MEDICAL EXPENSE, so let’s blame people who have disabilities and illnesses and accidents on the job for ending up in a low income household. Being low income doesn’t mean you’re a dumb, lazy idiot, no matter what Faux News pumps into your boob tube.
The income levels that are cited as low income in the IE and AV would be considered sufficient in many parts of the country to get you into a good school district and a decent size house. Ever watch HGTV and ask yourself how these people can spend $200K for a three acres and a 3,000 SQ Ft house? The ONLY thing that is separating people who make these income levels elsewhere in the country from being “poor” instead of “middle class” is HOUSING COSTS.
Look it up: Southern California, and Los Angeles, specifically, now tops the list according to the Lusk Center for Real Estate for being the most poverty-stricken area in the nation. That’s the entire region, folks, because we know it only gets worse in the OC! The reason? Median wages for everybody in Los Angeles are lower than what it takes, on average, to live here, and we have less rent control than the areas we typically think of as high-cost like Manhattan or San Francisco. At the same time, Southern California and LA/OC, particularly, have the worst housing shortage. So the new homes are being built for people who make over six figures a year. I’ve got news for you: If you make a six figure income here, even if that’s only “middle class”, Uncle Sam says you’re part of the top 5-10 percent of all income earners nationally. And if you earn a mid-six figure income, for tax purposes you are in “1 percent” territory.
When the cost of living goes up but wages do not, you end up with poverty. Southern California only works for two-income earner households, for the most part. If one person suffers a prolonged setback with job, health or just a more basic thing like caring for sick or aging parent or family member, you can quickly lose your entire standard of living. And here we had Gloria Steinham promising us in the 1960s that we would be liberated? All it did is allow employers to slash wages on the presumption that everyone would have a working spouse or partner to make up the difference. That’s WHY in today’s dollars a single income is worth less in practical terms than what single-breadwinner households made in the past. Those neighborhoods that were built in the 1950s had blue collar people in them. Now they have mid level managers. Not-so-large homes in South OC have dentists and doctors whose kids are doubling up and sharing rooms just like their low-income counterparts! All the while, you can flip on HGTV on any given day and see some yahoo with a stay-at-home wife buy a McMansion that would make a Californian blush! Do we realize that JOKE is on us? It’s not that people in these communities are “poor” by any national definition, it’s that they do the same work their non-California counterparts do and can’t afford to live because SoCal is so built out that the land and development costs are through the roof. I once heard that on a waitress’s salary in South Dakota, she can own her own home. Does the same waitress in the LA/OC/ID/AV area deserve to be on Section 8 or have a succession of roommates while she contemplates taking on two- or six-figure student loan debts to get a “better job” (after which much of her increased “earning power” will go toward paying off the school loans rather than actually getting ahead from a housing perspective?).
The entire SoCal area from the IE to the AV and all parts in between are riddled with gangs, crime and homeless. (Thank you, Reagan, for letting out all the crazies who needed institutional care to save the state money. I remember not knowing WHAT a panhandler was — because I had never seen one even in lower-class North OC — before you became California’s governor!)
Reality check, here: Drive two or three blocks outside of Beverly Hills and there are shifty characters, homeless, GHETTO. Get ‘yer guns, pa, pa: The “safe zones” are shrinking!!! Hello! There’s no point in saying this or that area is safe and this or that area is not safe if they’re less than 5-10 miles apart!
Lau Denmark Denmark. Have uden in Download town LA! Hos dangerois is that Andrea today?
Why is “Fairfax” listed in the longer list? Fairfax is a district of the City of Los Angeles and NOT a suburb.
Lau, Denmark.
Have been in Down Town LA in 1988. How dangerous is that part of LA to Day?