
Cities with highest divorce rate in Washington research summary. We used Saturday Night Science to analyze Washington’s most recent Census data to determine the divorce rate for each city in Washington based on the percentage of currently divorced residents. Here are the results of our analysis:
-
The city with the highest divorce rate in Washington is Centralia based on the most recent Census data.
-
Centralia is 12.0% Divorced.
-
The city with the lowest divorce rate in Washington is Sammamish.
-
Sammamish is 1.0% Divorced.
-
Washington is 4.0% Divorced.
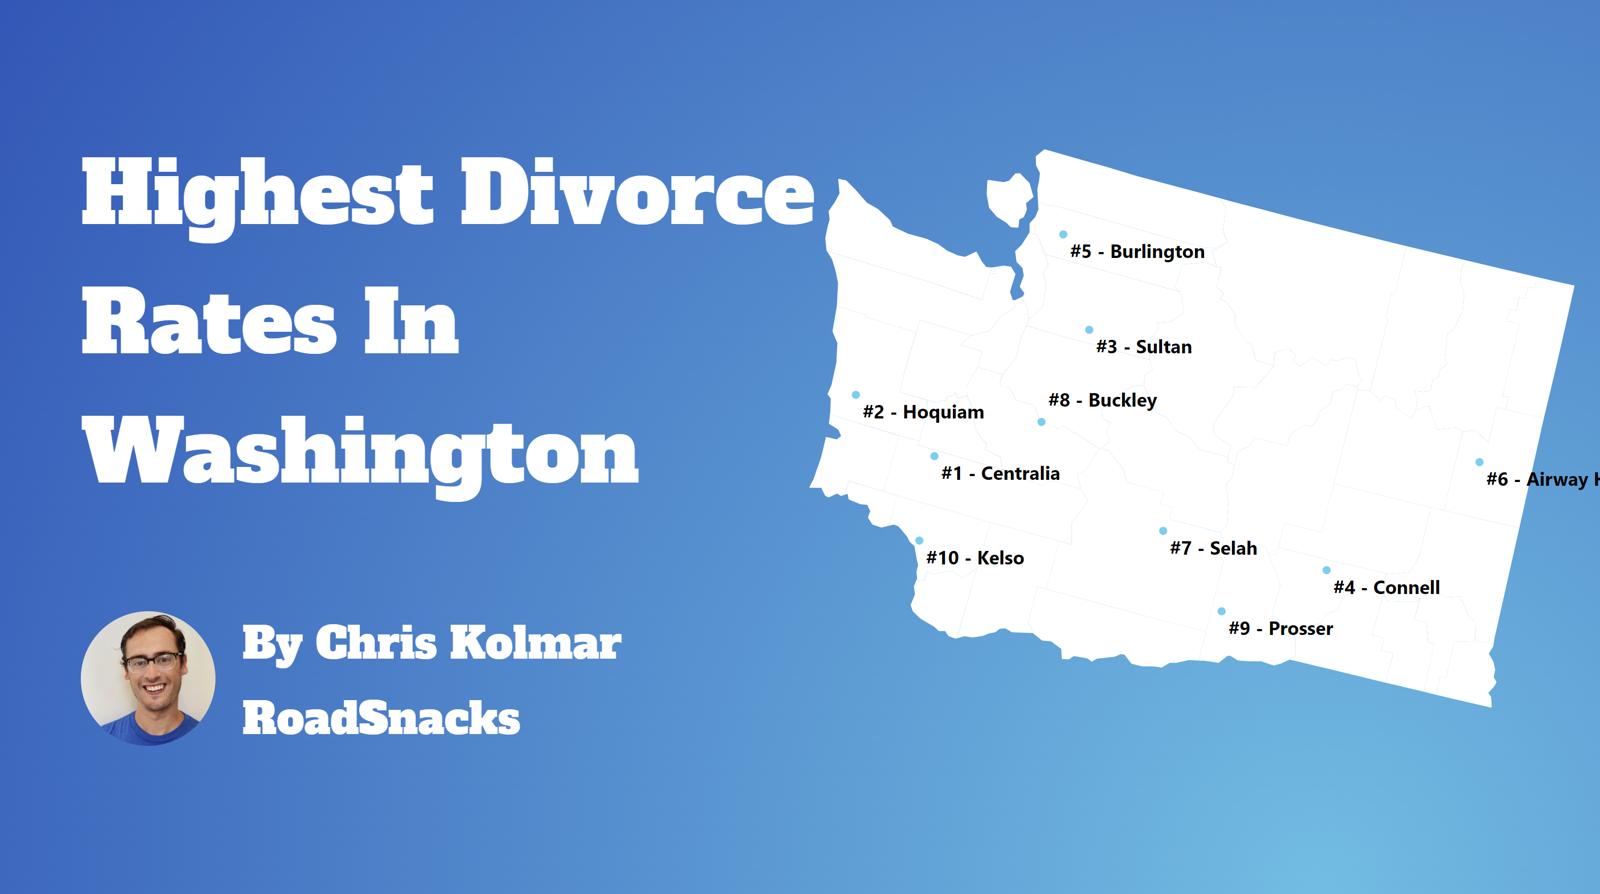
Table Of Contents: Top Ten | Methodology | Summary | Table
There are some 247,711 people living in Washington over fifteen years of age who are divorced. You can compare that to the 28,339,199 Americans who are currently divorced in 2025.
Many people decide to run away – or split up – across the Evergreen State.
Isn’t the divorce rate in America close to 50%? Yes indeed. But we’re measuring something else; we are looking at counts and percentages of people over 15 years old who are currently divorced. That 50% statistic is for the percentage of people who have ever been divorced.
For today’s analysis, the focus will be on the number of currently divorced people.
So now that we have you biting your nails, rethinking your worldview, and pulling out your hair, let’s look at the places in Washington with the highest rates of divorcees.
The 10 Cities In Washington With The Highest Divorce Rates
Let’s quickly recap before we dive into the Saturday Night Science behind the data.
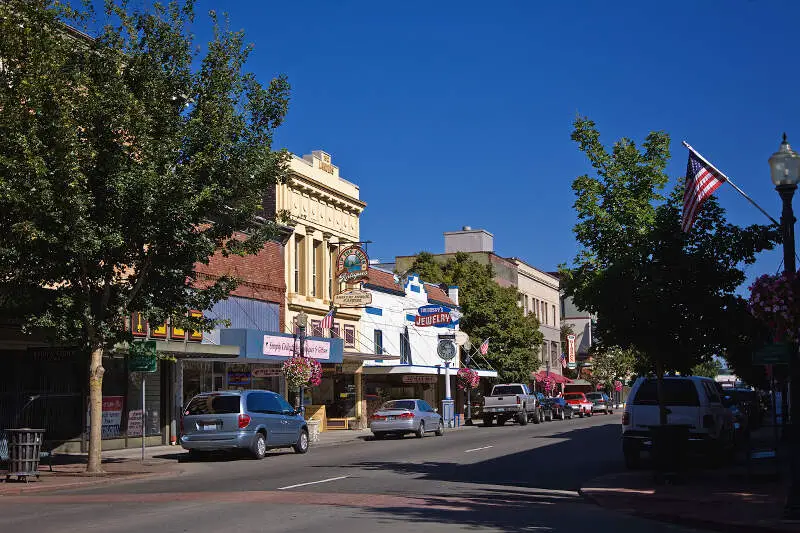
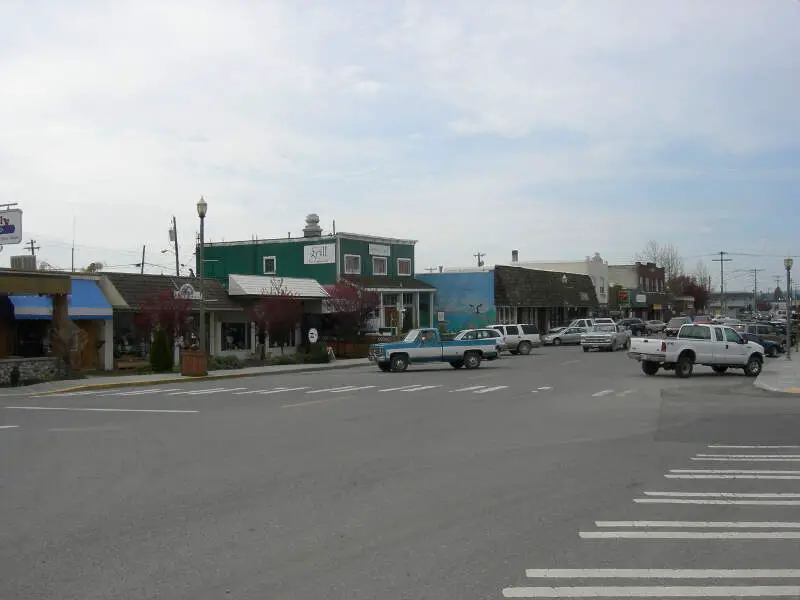
What is the city in Washington with the highest divorce rate? That would be Centralia, with 12.0% of people over 15 years of age being divorced, per the most recent census data.
What is the overall Washington divorce rate? According to the 2019-2023 Community Survey, the overall divorce rate in Washington is 4.0%, which compares to the US divorce rate of 10.9%.
Alrighty, on to how we calculated the places with the highest divorce rates in Washington.
For more Washington reading, check out:
- Most Dangerous Cities In Washington
- Best Places To Live In Washington
- Best Places To Raise A Family In Washington
The 10 Places With The Highest Divorce Rate In Washington For 2025

/10
Population: 18,457
Divorce Rate: 12.0%
Divorcees: 1,771
Median Income: $52,387
More on Centralia: Data

/10
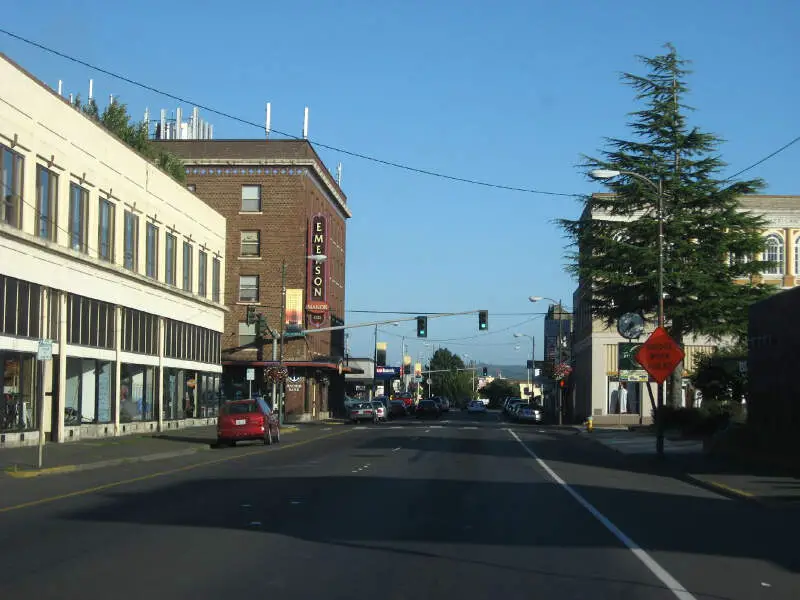
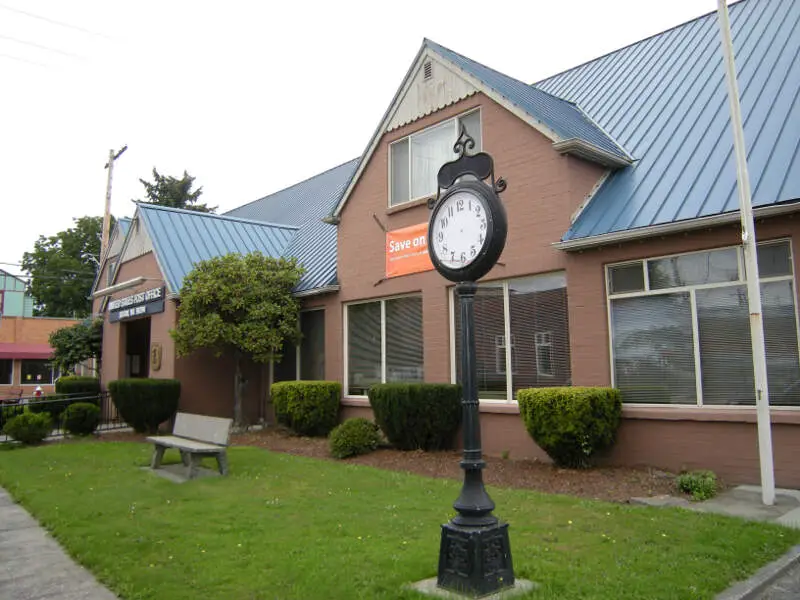
Population: 8,792
Divorce Rate: 10.0%
Divorcees: 703
Median Income: $51,754
More on Hoquiam: Data

/10
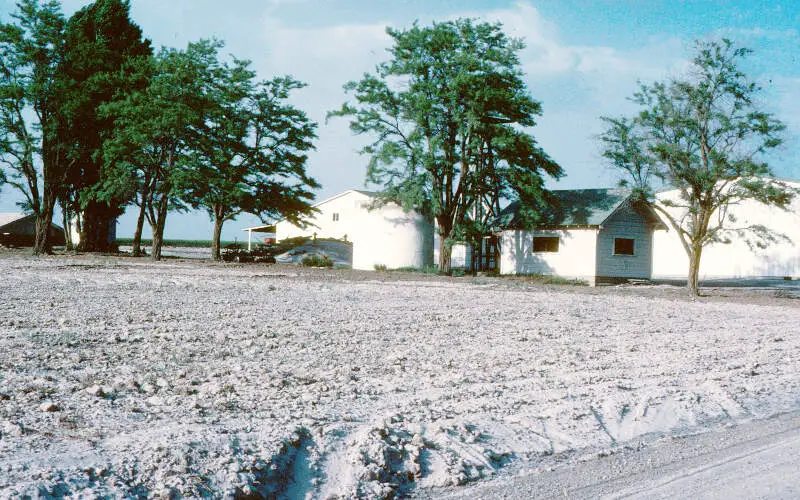
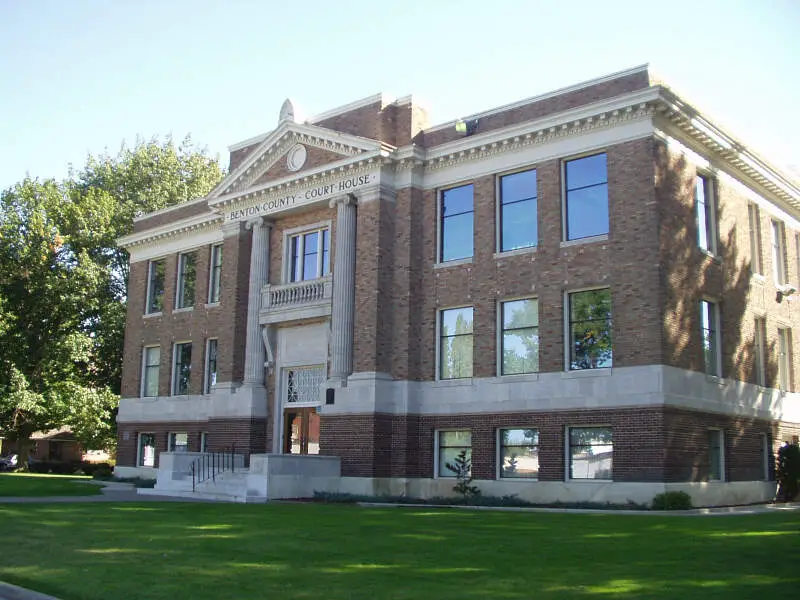
Population: 5,080
Divorce Rate: 10.0%
Divorcees: 406
Median Income: $63,810
More on Connell: Data

/10
Population: 10,766
Divorce Rate: 9.0%
Divorcees: 775
Median Income: $64,659
More on Airway Heights: Data

/10
Population: 8,351
Divorce Rate: 9.0%
Divorcees: 601
Median Income: $87,477
More on Stanwood: Data
/10
Population: 5,770
Divorce Rate: 9.0%
Divorcees: 415
Median Income: $85,278
More on Sultan: Data

/10
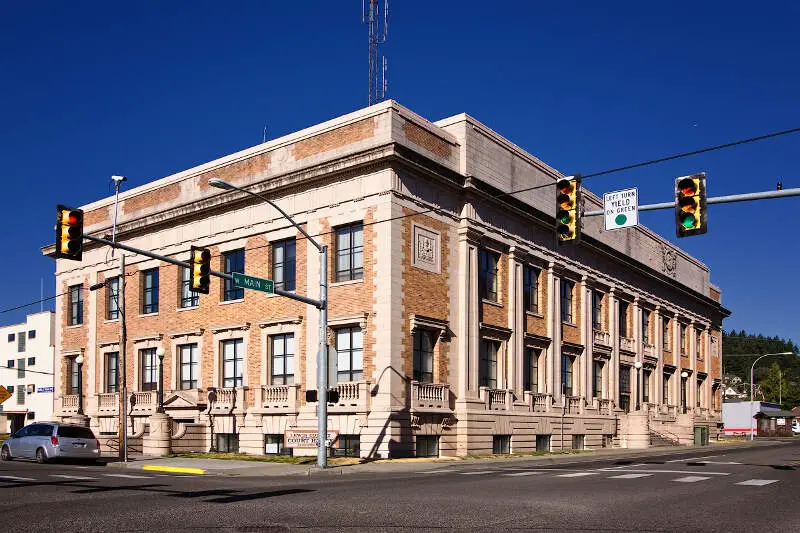
Population: 6,213
Divorce Rate: 8.0%
Divorcees: 397
Median Income: $66,406
More on Prosser: Data

/10
Population: 7,536
Divorce Rate: 8.0%
Divorcees: 482
Median Income: $68,021
More on Chehalis: Data

/10
Population: 9,637
Divorce Rate: 8.0%
Divorcees: 616
Median Income: $74,028
More on Burlington: Data
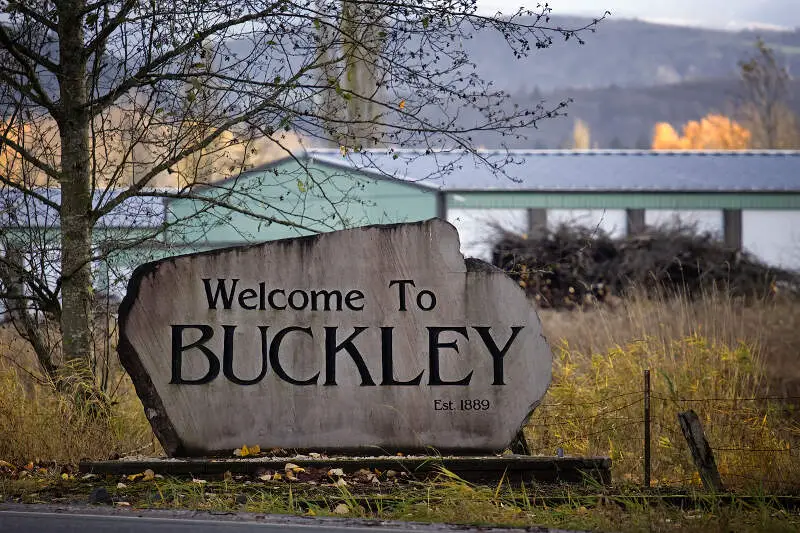
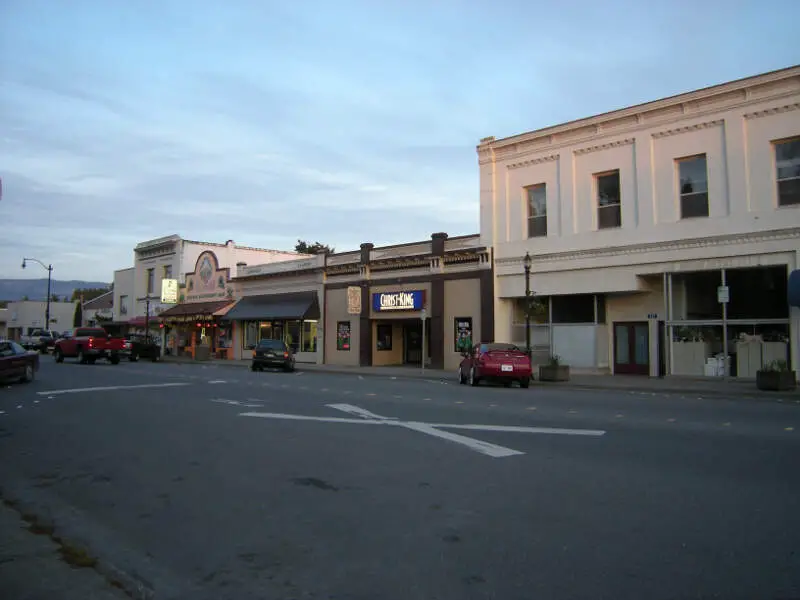
/10
Population: 5,306
Divorce Rate: 8.0%
Divorcees: 339
Median Income: $121,719
More on Buckley: Data
How We Determined The Places In Washington That Get Un-Hitched The Most
Since this is the 58th category of rankings we are compiling for the site, we had a pretty good idea of where to find data on marriage and divorce in America. We used Saturday Night Science to look at the U.S. Census Bureau on divorce rates. Because who likes tracking misery more than the U.S. government?
Specifically, we looked at the 2019-2023 American Community Survey table S1201 — Marital Status.
Pretty straightforward on that front — we just had to extract the following column of data:
- Population 15 Years and Over -> Divorced
There are some interesting/fun/sad data like .1% of female Americans aged 15-19 are divorced, but 0% of males (That’s probably a rounding issue, but still).
But the national data is for another day. Today, the analysis focuses on the 121 places in Washington with a population of over 5,000.
We ranked each place by the percentage of divorcees over 15 years of age from highest to lowest. We crowned the divorce capital of Washington the place with the highest incidence of divorcees, Centralia.
And if you’re trying to avoid divorce, check out Sammamish, the city with the lowest divorce rate in Washington.
We updated this article for 2025 and this list is our fifth time ranking the cities in Washington with the highest divorce rates.
Getting Some Closure In Washington After Untying The Know
Besides just coming up with what we thought would be a great new blog/book title, “Untying the Knot In Washington: Life After Divorce,” we now have a sense of what places in the Evergreen State don’t pay much attention to the whole “’til death do we part” phrase.
The cities with the highest divorce rate in Washington are Centralia, Hoquiam, Connell, Airway Heights, Stanwood, Sultan, Prosser, Chehalis, Burlington, and Buckley.
Try to keep in mind that the reason cities rank where they do in Washington could be because of the age, education, and income distribution, as all of those things impact the rate of divorce.
And that’s probably for the best. Getting out of a toxic relationship is much better than staying in it.
Just make sure you have your running shoes ready to go.
For more Washington reading, check out:
- Most Dangerous Cities In Washington
- Best Places To Live In Washington
- Best Places To Raise A Family In Washington
Cities With The Highest Divorce Rates In Washington
| Rank | City | Population | Divorcees | Divorce Rate |
|---|---|---|---|---|
| 1 | Centralia, WA | 18,457 | 1,771 | 12.0% |
| 2 | Hoquiam, WA | 8,792 | 703 | 10.0% |
| 3 | Connell, WA | 5,080 | 406 | 10.0% |
| 4 | Airway Heights, WA | 10,766 | 775 | 9.0% |
| 5 | Stanwood, WA | 8,351 | 601 | 9.0% |
| 6 | Sultan, WA | 5,770 | 415 | 9.0% |
| 7 | Prosser, WA | 6,213 | 397 | 8.0% |
| 8 | Chehalis, WA | 7,536 | 482 | 8.0% |
| 9 | Burlington, WA | 9,637 | 616 | 8.0% |
| 10 | Buckley, WA | 5,306 | 339 | 8.0% |
| 11 | Aberdeen, WA | 17,040 | 1,090 | 8.0% |
| 12 | Kelso, WA | 12,697 | 711 | 7.0% |
| 13 | Ephrata, WA | 8,493 | 475 | 7.0% |
| 14 | Ellensburg, WA | 18,913 | 1,059 | 7.0% |
| 15 | Port Angeles, WA | 20,087 | 1,124 | 7.0% |
| 16 | Port Townsend, WA | 10,290 | 576 | 7.0% |
| 17 | Longview, WA | 37,836 | 2,118 | 7.0% |
| 18 | Selah, WA | 8,301 | 464 | 7.0% |
| 19 | Wenatchee, WA | 35,502 | 1,988 | 7.0% |
| 20 | Spokane, WA | 229,228 | 12,836 | 7.0% |
| 21 | Spokane Valley, WA | 105,460 | 5,905 | 7.0% |
| 22 | Snohomish, WA | 10,177 | 569 | 7.0% |
| 23 | Milton, WA | 8,747 | 489 | 7.0% |
| 24 | Orting, WA | 8,957 | 429 | 6.0% |
| 25 | Enumclaw, WA | 12,663 | 607 | 6.0% |
| 26 | Yakima, WA | 96,810 | 4,646 | 6.0% |
| 27 | East Wenatchee, WA | 14,114 | 677 | 6.0% |
| 28 | Shelton, WA | 10,619 | 509 | 6.0% |
| 29 | Arlington, WA | 20,599 | 988 | 6.0% |
| 30 | Sumner, WA | 10,674 | 512 | 6.0% |
| 31 | Moses Lake, WA | 25,594 | 1,228 | 6.0% |
| 32 | Clarkston, WA | 7,240 | 347 | 6.0% |
| 33 | Marysville, WA | 71,570 | 3,435 | 6.0% |
| 34 | Lynnwood, WA | 40,953 | 1,965 | 6.0% |
| 35 | Puyallup, WA | 42,642 | 2,046 | 6.0% |
| 36 | Everett, WA | 111,083 | 5,331 | 6.0% |
| 37 | Lynden, WA | 16,025 | 641 | 5.0% |
| 38 | Mount Vernon, WA | 35,312 | 1,412 | 5.0% |
| 39 | Mukilteo, WA | 21,312 | 852 | 5.0% |
| 40 | Richland, WA | 61,912 | 2,476 | 5.0% |
| 41 | Olympia, WA | 55,583 | 2,223 | 5.0% |
| 42 | Othello, WA | 8,699 | 347 | 5.0% |
| 43 | Poulsbo, WA | 11,962 | 478 | 5.0% |
| 44 | Sedro-Woolley, WA | 12,633 | 505 | 5.0% |
| 45 | Tacoma, WA | 220,482 | 8,819 | 5.0% |
| 46 | Tumwater, WA | 26,519 | 1,060 | 5.0% |
| 47 | University Place, WA | 34,850 | 1,394 | 5.0% |
| 48 | Walla Walla, WA | 33,766 | 1,350 | 5.0% |
| 49 | Washougal, WA | 16,945 | 677 | 5.0% |
| 50 | Woodland, WA | 6,513 | 260 | 5.0% |
| 51 | Ocean Shores, WA | 7,076 | 283 | 5.0% |
| 52 | Lakewood, WA | 63,034 | 2,521 | 5.0% |
| 53 | Yelm, WA | 10,618 | 424 | 5.0% |
| 54 | Auburn, WA | 85,455 | 3,418 | 5.0% |
| 55 | Bremerton, WA | 44,531 | 1,781 | 5.0% |
| 56 | Kennewick, WA | 84,389 | 3,375 | 5.0% |
| 57 | Burien, WA | 51,331 | 2,053 | 5.0% |
| 58 | Lake Stevens, WA | 39,500 | 1,580 | 5.0% |
| 59 | Edmonds, WA | 42,783 | 1,711 | 5.0% |
| 60 | Grandview, WA | 11,042 | 441 | 5.0% |
| 61 | Gig Harbor, WA | 12,202 | 488 | 5.0% |
| 62 | Liberty Lake, WA | 12,435 | 397 | 4.0% |
| 63 | Port Orchard, WA | 16,398 | 524 | 4.0% |
| 64 | Edgewood, WA | 12,683 | 405 | 4.0% |
| 65 | Des Moines, WA | 32,545 | 1,041 | 4.0% |
| 66 | Quincy, WA | 7,922 | 253 | 4.0% |
| 67 | College Place, WA | 9,828 | 314 | 4.0% |
| 68 | Sequim, WA | 8,130 | 260 | 4.0% |
| 69 | Tukwila, WA | 21,479 | 687 | 4.0% |
| 70 | Bellingham, WA | 92,367 | 2,955 | 4.0% |
| 71 | Battle Ground, WA | 21,293 | 681 | 4.0% |
| 72 | Anacortes, WA | 17,837 | 570 | 4.0% |
| 73 | Covington, WA | 20,957 | 670 | 4.0% |
| 74 | Pacific, WA | 7,064 | 226 | 4.0% |
| 75 | Mill Creek, WA | 20,846 | 667 | 4.0% |
| 76 | Ferndale, WA | 15,447 | 494 | 4.0% |
| 77 | Monroe, WA | 19,696 | 630 | 4.0% |
| 78 | Mountlake Terrace, WA | 21,419 | 685 | 4.0% |
| 79 | Normandy Park, WA | 6,659 | 213 | 4.0% |
| 80 | Lacey, WA | 57,088 | 1,826 | 4.0% |
| 81 | Federal Way, WA | 99,232 | 3,175 | 4.0% |
| 82 | Fircrest, WA | 7,082 | 226 | 4.0% |
| 83 | Fife, WA | 10,902 | 348 | 4.0% |
| 84 | Lake Forest Park, WA | 13,356 | 427 | 4.0% |
| 85 | Kirkland, WA | 91,614 | 2,198 | 3.0% |
| 86 | Vancouver, WA | 192,696 | 4,624 | 3.0% |
| 87 | Union Gap, WA | 6,511 | 156 | 3.0% |
| 88 | Snoqualmie, WA | 13,750 | 330 | 3.0% |
| 89 | Kent, WA | 135,015 | 3,240 | 3.0% |
| 90 | Sunnyside, WA | 16,329 | 391 | 3.0% |
| 91 | Blaine, WA | 5,982 | 143 | 3.0% |
| 92 | Bonney Lake, WA | 22,776 | 546 | 3.0% |
| 93 | Steilacoom, WA | 6,683 | 160 | 3.0% |
| 94 | Bothell, WA | 48,610 | 1,166 | 3.0% |
| 95 | Brier, WA | 6,507 | 156 | 3.0% |
| 96 | West Richland, WA | 17,126 | 411 | 3.0% |
| 97 | Maple Valley, WA | 28,121 | 674 | 3.0% |
| 98 | Kenmore, WA | 23,594 | 566 | 3.0% |
| 99 | Renton, WA | 105,279 | 2,526 | 3.0% |
| 100 | Cheney, WA | 12,830 | 307 | 3.0% |