
Whitest cities in Alabama research summary. We analyzed Alabama’s most recent Census data to determine the whitest cities in Alabama based on the percentage of White residents. Here are the results of our analysis:
The whitest city in Alabama is Mountain Brook based on the most recent Census data.
Mountain Brook is 95.08% White.
The least White city in Alabama is Midfield.
Midfield is 4.8% White.
Alabama is 63.4% White.
Alabama is the 28th Whitest state in the United States.
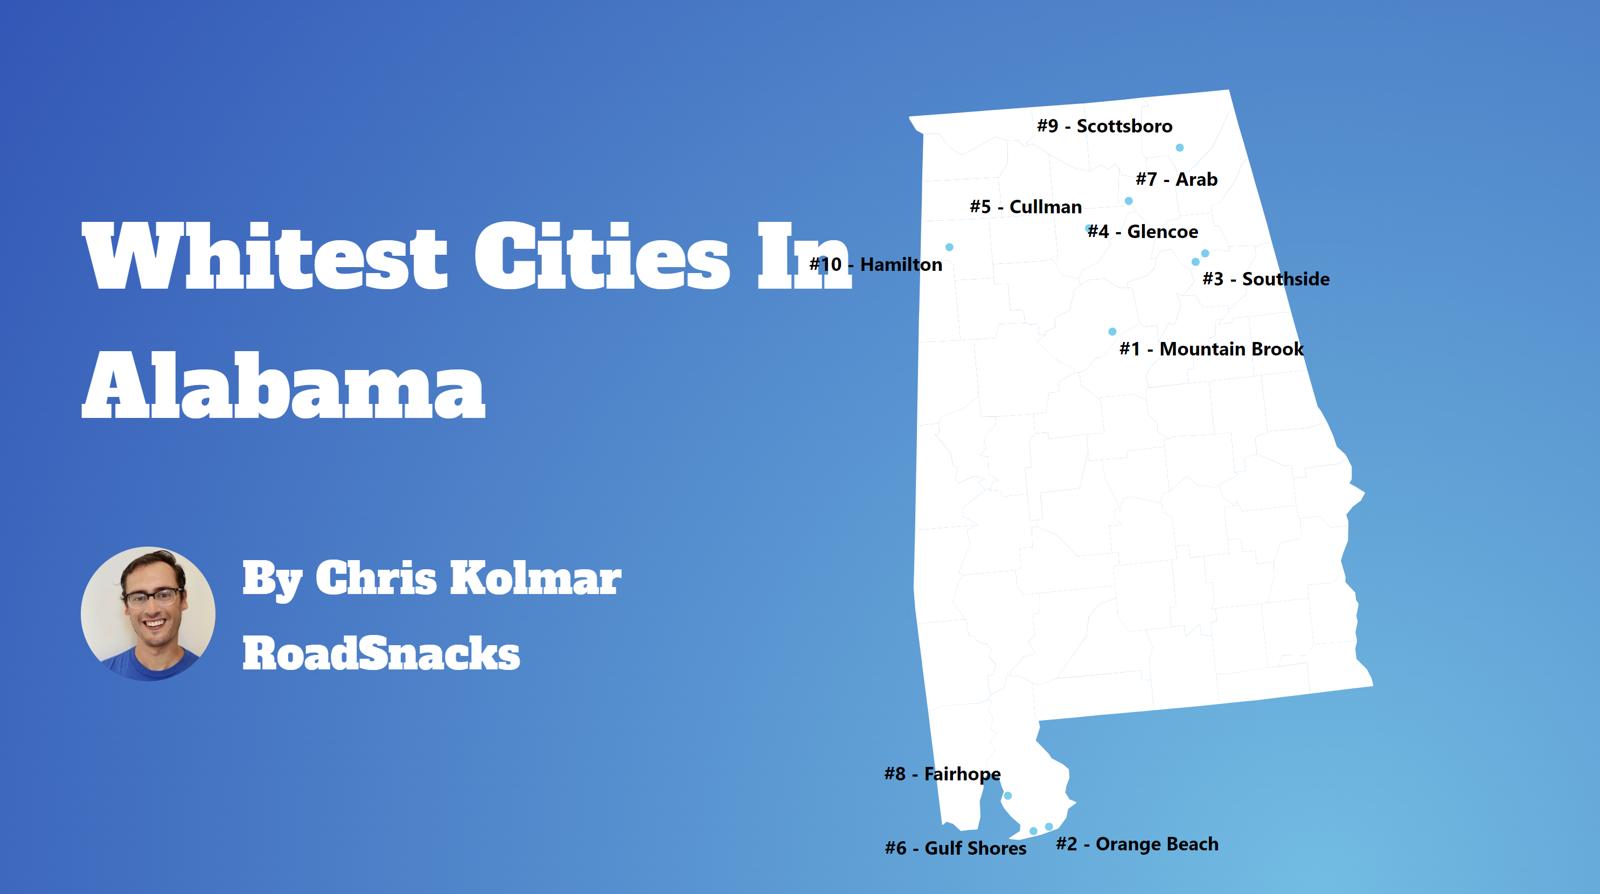
Table Of Contents: Top Ten | Methodology | Summary | Table
Today, we are looking at the whitest places in Alabama. We won’t measure the number of Whole Foods or Pottery Barns per capita. Instead, we’ll focus on the Census data’s report of race by place in Alabama. In particular, we ranked each place in Alabama by the percentage of white people.
So where are the whitest cities you can live in Alabama?
After analyzing cities with populations greater than 5,000, we came up with this list as the whitest cities in Alabama for 2026.Here are the 10 whites places in Alabama for 2026:
What is the whitest city in Alabama for 2026? According to the most recent census data Mountain Brook ranks as the whitest. If you’re wondering, Midfield is the least white city of all those we measured.
Read on below to see where your hometown ranked and why. Or check out the whitest states in America and the most diverse states in America.
For more Alabama reading, check out:
The 10 Whitest Cities In Alabama For 2026

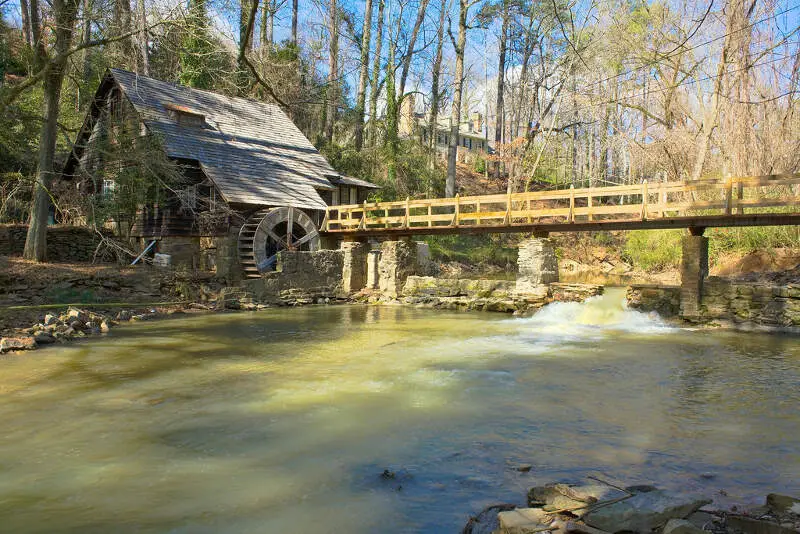
/10
Population: 22,029
% White: 95.08%
More on Mountain Brook: Data | Crime | Cost Of Living | Movers
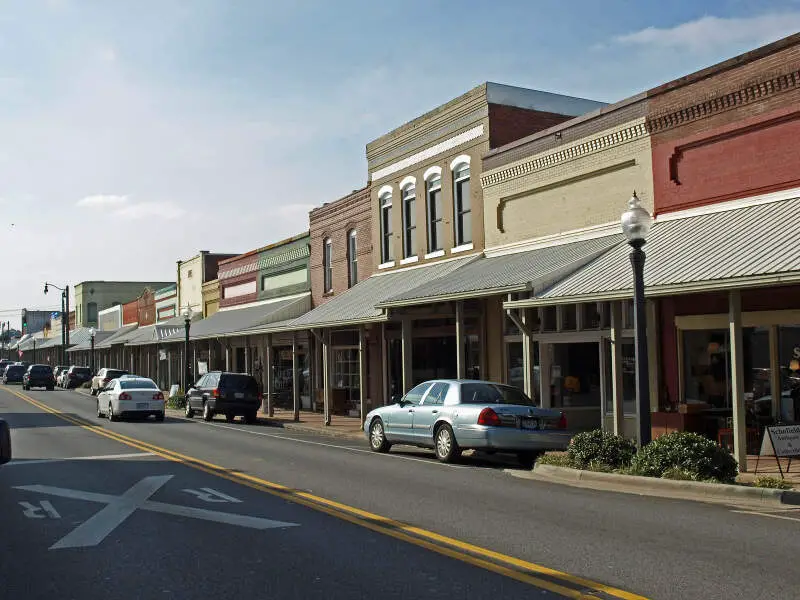
/10
Population: 5,353
% White: 94.08%
More on Glencoe: Data | Crime | Cost Of Living | Movers

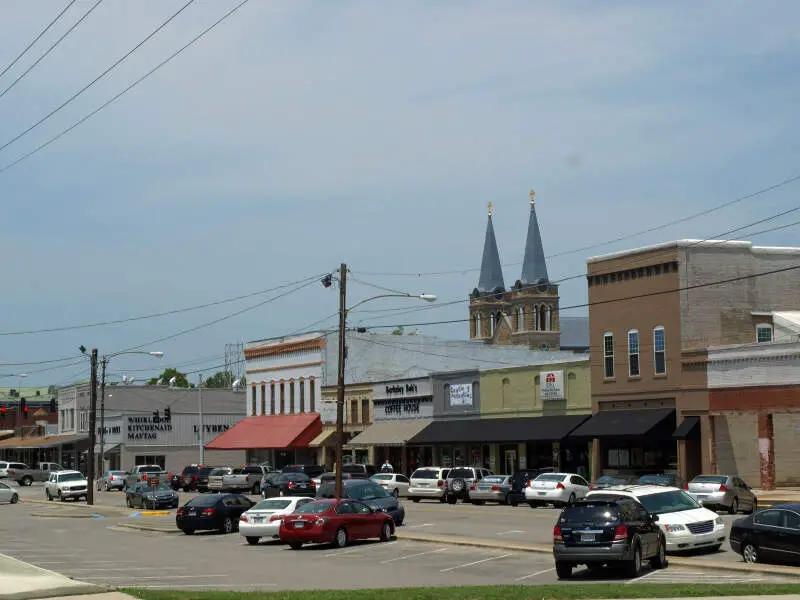
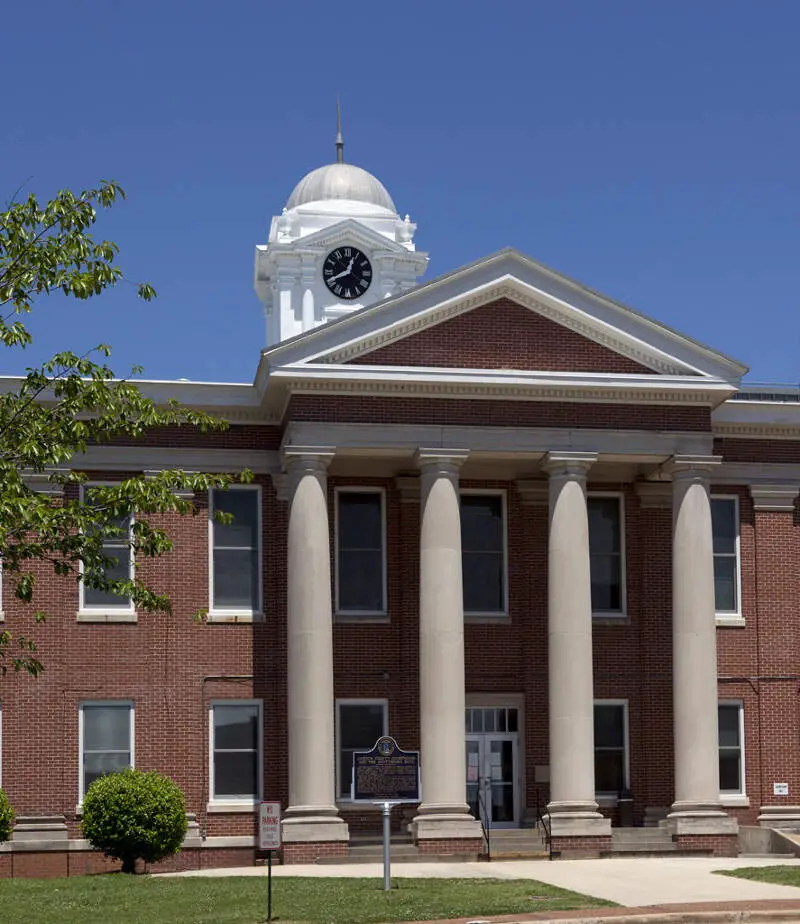
/10
Population: 19,319
% White: 88.66%
More on Cullman: Data | Crime | Cost Of Living | Movers

/10
Population: 24,190
% White: 88.58%
More on Fairhope: Data | Crime | Cost Of Living | Movers

/10
Population: 8,679
% White: 88.13%
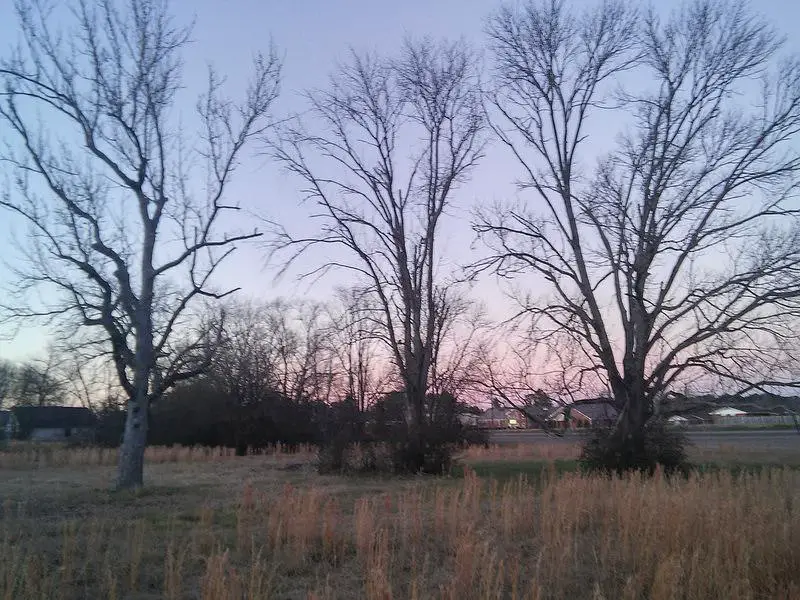
More on Arab: Data | Crime | Cost Of Living | Movers

/10
Population: 9,483
% White: 87.63%
More on Southside: Data | Crime | Cost Of Living | Movers

/10
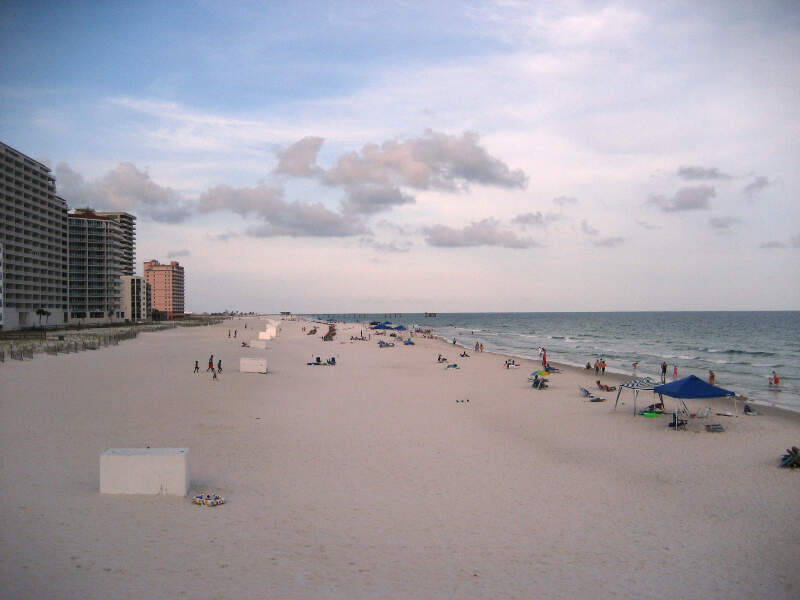
Population: 8,407
% White: 87.32%
More on Orange Beach: Data | Crime | Cost Of Living | Movers

/10
Population: 16,401
% White: 87.3%
More on Gulf Shores: Data | Cost Of Living | Movers

/10
Population: 15,847
% White: 86.21%
More on Hartselle: Data | Cost Of Living | Movers

/10
Population: 15,712
% White: 84.64%
More on Scottsboro: Data | Cost Of Living | Movers
To rank the whitest places in Alabama, we used Saturday Night Science to look at Census demographic data. We had to look at the number of white people living in each city in Alabama on a per capita basis. In other words, the percentage of white people living in each city in Alabama. We looked at table B03002: Hispanic OR LATINO ORIGIN BY RACE. Here are the category names as defined by the Census: Our particular column of interest here was the number of people who identified as White alone. We limited our analysis to town with a population greater than 5,000 people. That left us with 100 cities. We then calculated the percentage of residents that are White. The percentages ranked from 95.1% to 4.8%. Finally, we ranked each city based on the percentage of White population, with a higher score being more White than a lower score. Mountain Brook took the distinction of being the most White, while Midfield was the least White city. We updated this article for 2026. This report represents our eleventh time ranking the whitest cities in Alabama. Read on for more information on how the cities in Alabama ranked by population of White residents or, for a more general take on diversity in America, head over to our ranking of the most diverse cities in America. We measured the locations with the highest percentage of white people in Alabama. According to the most recent data, this list provides accurate information on the whitest places in Alabama. The most White cities in Alabama are Mountain Brook, Glencoe, Cullman, Fairhope, Arab, Southside, Orange Beach, Gulf Shores, Hartselle, and Scottsboro. If you’re curious enough, here are the least White places in Alabama: For more Alabama reading, check out:Methodology: How we determined the whitest places in Alabama for 2026
Summary: White Populations Across Alabama
White Population By City In Alabama
Rank City Population White Population % White 1 Mountain Brook 22,029 20,945 95.08% 2 Glencoe 5,353 5,036 94.08% 3 Cullman 19,319 17,129 88.66% 4 Fairhope 24,190 21,428 88.58% 5 Arab 8,679 7,649 88.13% 6 Southside 9,483 8,310 87.63% 7 Orange Beach 8,407 7,341 87.32% 8 Gulf Shores 16,401 14,318 87.3% 9 Hartselle 15,847 13,661 86.21% 10 Scottsboro 15,712 13,299 84.64% 11 Vestavia Hills 38,616 32,584 84.38% 12 Robertsdale 7,194 5,968 82.96% 13 Attalla 5,775 4,763 82.48% 14 Hamilton 6,922 5,609 81.03% 15 Satsuma 6,822 5,518 80.89% 16 Chelsea 16,260 13,086 80.48% 17 Spanish Fort 10,662 8,568 80.36% 18 Saraland 16,404 13,139 80.1% 19 Trussville 26,673 21,304 79.87% 20 Rainbow City 10,284 8,132 79.07% 21 Moody 13,488 10,608 78.65% 22 Opp 6,709 5,273 78.6% 23 Jasper 14,442 11,339 78.51% 24 Guntersville 8,916 6,985 78.34% 25 Oneonta 6,971 5,453 78.22% 26 Muscle Shoals 16,951 13,107 77.32% 27 Foley 24,026 18,297 76.15% 28 Boaz 10,814 8,144 75.31% 29 Pell City 13,587 10,224 75.25% 30 Daphne 29,453 21,690 73.64% 31 Oxford 22,063 16,172 73.3% 32 Fort Payne 14,927 10,670 71.48% 33 Clanton 8,958 6,395 71.39% 34 Homewood 27,829 19,736 70.92% 35 Florence 41,701 29,513 70.77% 36 Helena 21,769 15,231 69.97% 37 Gardendale 16,534 11,524 69.7% 38 Athens 29,002 20,043 69.11% 39 Leeds 12,028 8,218 68.32% 40 Hoover 92,642 63,046 68.05% 41 Sheffield 9,340 6,330 67.77% 42 Pelham 24,827 16,691 67.23% 43 Alabaster 33,917 22,765 67.12% 44 Tuscumbia 9,115 6,060 66.48% 45 Madison 60,106 39,736 66.11% 46 Prattville 39,482 25,952 65.73% 47 Auburn 80,594 52,963 65.72% 48 Lincoln 7,305 4,764 65.22% 49 Brewton 5,186 3,344 64.48% 50 Millbrook 17,189 11,069 64.4% 51 Northport 31,218 19,992 64.04% 52 Andalusia 8,766 5,588 63.75% 53 Jacksonville 14,437 9,149 63.37% 54 Wetumpka 7,437 4,707 63.29% 55 Albertville 22,813 14,235 62.4% 56 Montevallo 7,556 4,645 61.47% 57 Sylacauga 12,309 7,541 61.26% 58 Smiths Station 5,496 3,329 60.57% 59 Enterprise 29,505 17,821 60.4% 60 Irondale 13,464 7,906 58.72% 61 Calera 17,714 10,234 57.77% 62 Roanoke 5,336 3,061 57.37% 63 Alexander City 14,606 8,345 57.13% 64 Ozark 14,327 8,125 56.71% 65 Huntsville 222,791 124,623 55.94% 66 Decatur 57,361 31,912 55.63% 67 Dothan 71,514 38,925 54.43% 68 Valley 10,277 5,442 52.95% 69 Fultondale 9,384 4,832 51.49% 70 Bay Minette 8,295 4,259 51.34% 71 Opelika 32,820 16,826 51.27% 72 Demopolis 6,908 3,505 50.74% 73 Gadsden 33,374 16,438 49.25% 74 Troy 17,716 8,703 49.13% 75 Tuscaloosa 111,038 54,240 48.85% 76 Clay 10,273 4,828 47.0% 77 Eufaula 12,584 5,657 44.95% 78 Russellville 10,799 4,833 44.75% 79 Hueytown 16,414 7,049 42.95% 80 Anniston 21,271 8,824 41.48% 81 Mobile 203,416 83,690 41.14% 82 Talladega 14,760 6,066 41.1% 83 Atmore 8,334 3,416 40.99% 84 Phenix City 38,499 15,514 40.3% 85 Chickasaw 6,332 2,535 40.03% 86 Monroeville 5,802 1,991 34.32% 87 Pinson 7,832 2,616 33.4% 88 Tarrant 5,925 1,888 31.86% 89 Greenville 7,163 2,049 28.61% 90 Pleasant Grove 9,442 2,651 28.08% 91 Montgomery 197,494 51,005 25.83% 92 Birmingham 198,173 48,042 24.24% 93 Bessemer 25,400 5,198 20.46% 94 Center Point 15,914 2,963 18.62% 95 Lanett 6,814 1,261 18.51% 96 Selma 17,057 2,527 14.82% 97 Tuskegee 8,938 1,052 11.77% 98 Prichard 18,961 1,916 10.1% 99 Fairfield 9,728 638 6.56% 100 Midfield 5,045 242 4.8%