
Whitest cities in California research summary. We analyzed California’s most recent Census data to determine the whitest cities in California based on the percentage of White residents. Here are the results of our analysis:
-
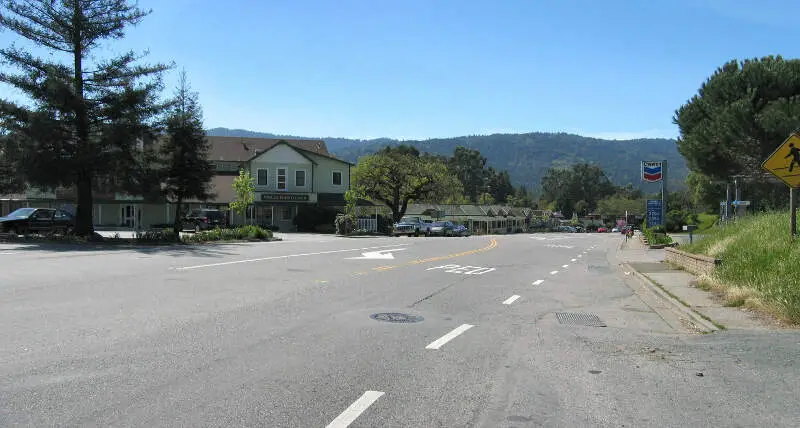
The whitest city in California is Mill Valley based on the most recent Census data.
-
Mill Valley is 82.05% White.
-
The least White city in California is Huron.
-
Huron is 0.47% White.
-
California is 34.6% White.
-
California is the 49th Whitest state in the United States.
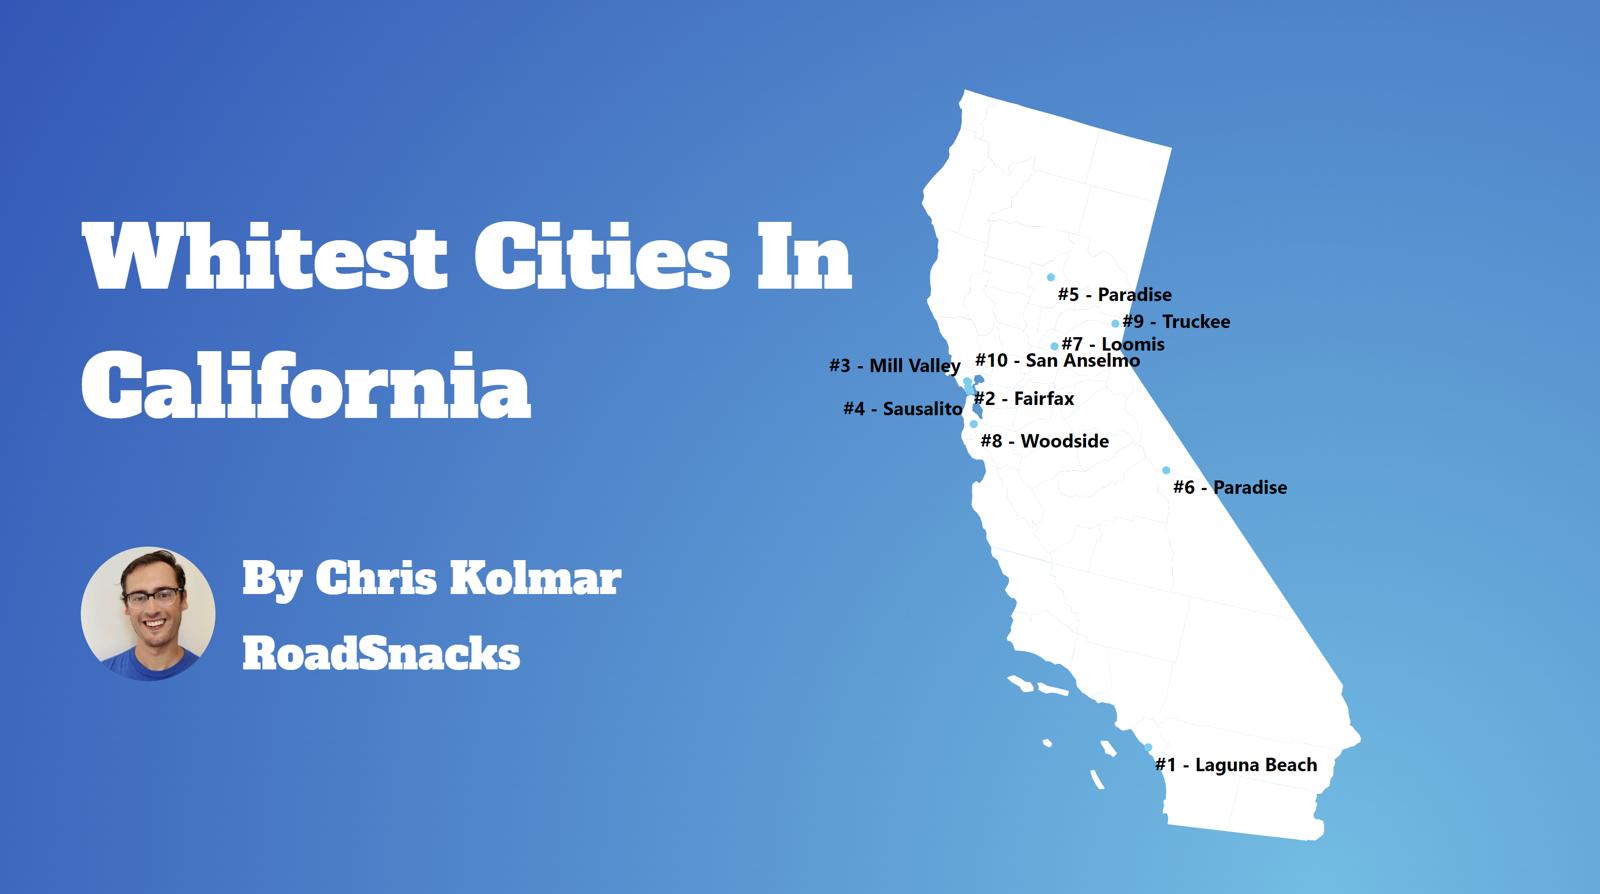
Table Of Contents: Top Ten | Methodology | Summary | Table
Today, we are looking at the whitest places in California. We won’t measure the number of Whole Foods or Pottery Barns per capita. Instead, we’ll focus on the Census data’s report of race by place in California. In particular, we ranked each place in California by the percentage of white people.
So where are the whitest cities you can live in California?
After analyzing cities with populations greater than 5,000, we came up with this list as the whitest cities in California for 2025.
Here are the 10 whites places in California for 2025:
What is the whitest city in California for 2025? According to the most recent census data Mill Valley ranks as the whitest. If you’re wondering, Huron is the least white city of all those we measured.
Read on below to see where your hometown ranked and why. Or check out the whitest states in America and the most diverse states in America.
For more California reading, check out:
- Safest Places In California
- Best Places To Raise A Family In California
- Best Places To Live In California
The 10 Whitest Cities In California For 2025


/10
Population: 14,064
% White: 82.05%
More on Mill Valley: Data

/10
Population: 5,181
% White: 81.53%
More on Woodside: Data

/10
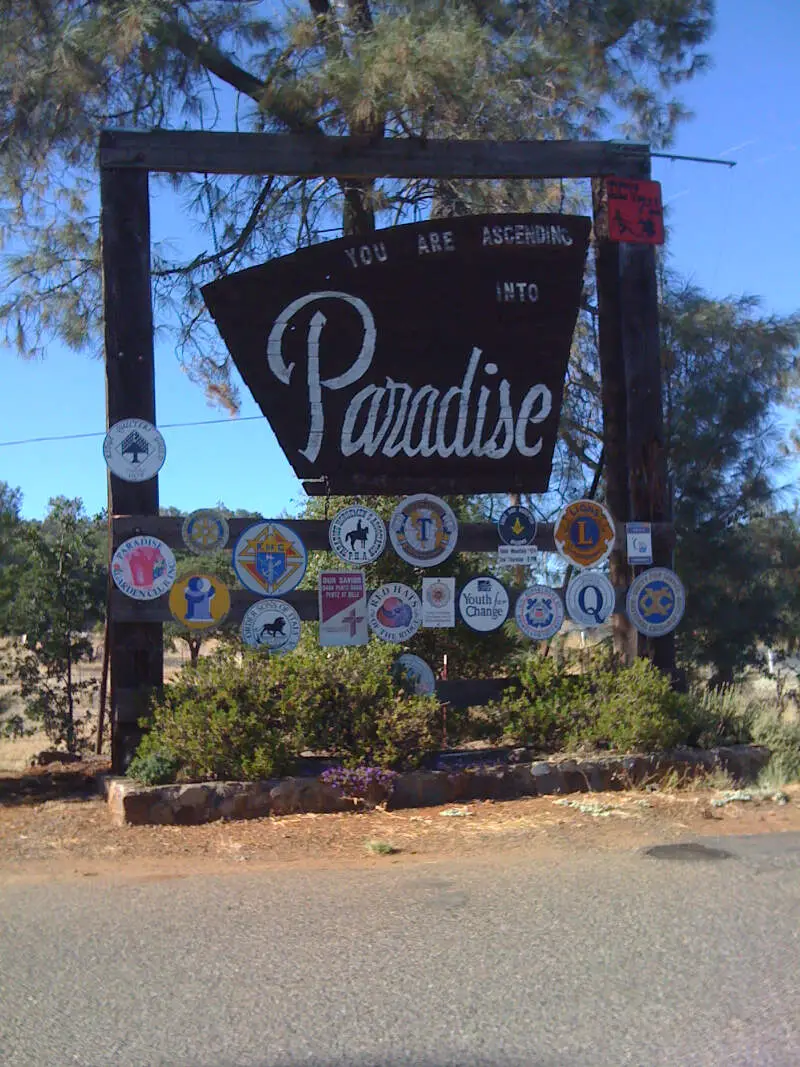
Population: 6,793
% White: 81.05%
More on Paradise: Data

/10
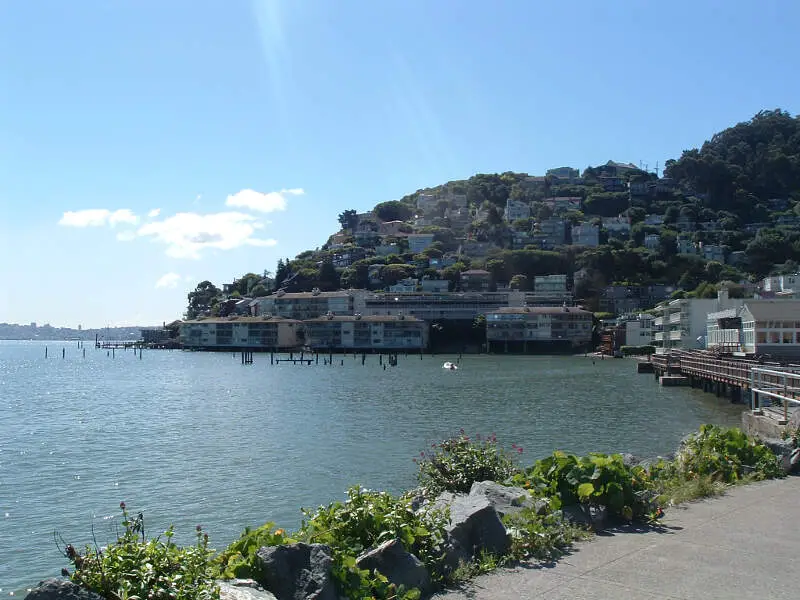
Population: 7,171
% White: 81.02%
More on Sausalito: Data

/10
Population: 7,523
% White: 80.71%
More on Fairfax: Data

/10
Population: 22,777
% White: 80.47%
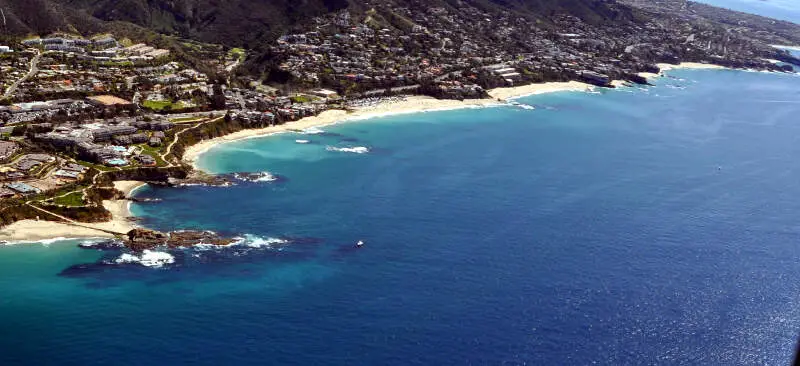
More on Laguna Beach: Data

/10
Population: 16,942
% White: 80.45%
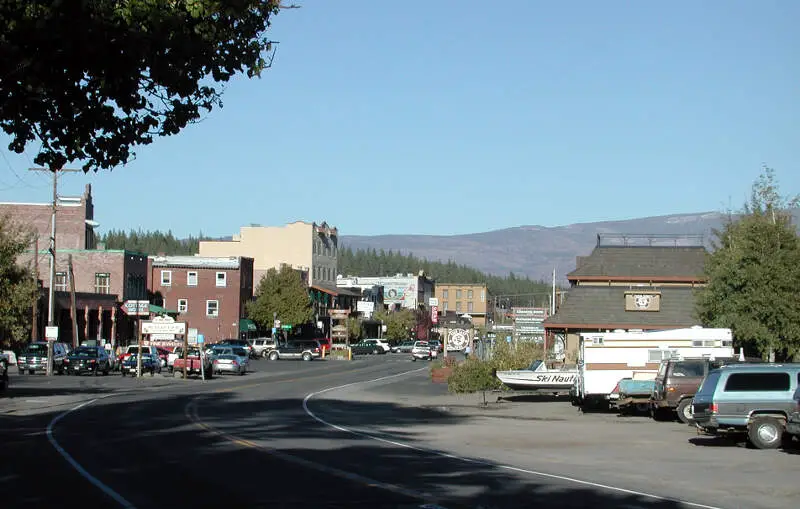
More on Truckee: Data

/10
Population: 10,516
% White: 79.53%
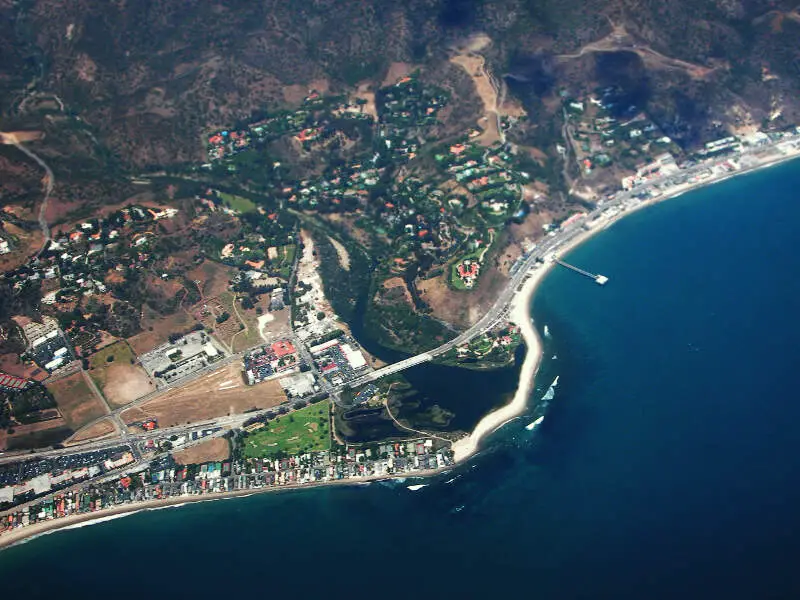
More on Malibu: Data


/10
Population: 14,126
% White: 79.5%
More on Grass Valley: Data

/10
Population: 9,035
% White: 79.09%
More on Tiburon: Data
Methodology: How we determined the whitest places in California for 2025
To rank the whitest places in California, we used Saturday Night Science to look at Census demographic data.
We had to look at the number of white people living in each city in California on a per capita basis. In other words, the percentage of white people living in each city in California.
We looked at table B03002: Hispanic OR LATINO ORIGIN BY RACE. Here are the category names as defined by the Census:
- Hispanic or Latino
- White alone*
- Black or African American alone*
- American Indian and Alaska Native alone*
- Asian alone*
- Native Hawaiian and Other Pacific Islander alone*
- Some other race alone*
- Two or more races*
Our particular column of interest here was the number of people who identified as White alone.
We limited our analysis to town with a population greater than 5,000 people. That left us with 421 cities.
We then calculated the percentage of residents that are White. The percentages ranked from 82.1% to 0.5%.
Finally, we ranked each city based on the percentage of White population, with a higher score being more White than a lower score. Mill Valley took the distinction of being the most White, while Huron was the least White city.
We updated this article for 2025. This report represents our tenth time ranking the whitest cities in California.
Read on for more information on how the cities in California ranked by population of White residents or, for a more general take on diversity in America, head over to our ranking of the most diverse cities in America.
Summary: White Populations Across California
We measured the locations with the highest percentage of white people in California. According to the most recent data, this list provides accurate information on the whitest places in California.
The most White cities in California are Mill Valley, Woodside, Paradise, Sausalito, Fairfax, Laguna Beach, Truckee, Malibu, Grass Valley, and Tiburon.
If you’re curious enough, here are the least White places in California:
- Huron
- Maywood
- Mendota
For more California reading, check out:
- Cheapest Places To Live In California
- Worst Places To Live In California
- Most Dangerous Cities In California
White Population By City In California
| Rank | City | Population | White Population | % White |
|---|---|---|---|---|
| 1 | Mill Valley | 14,064 | 11,540 | 82.05% |
| 2 | Woodside | 5,181 | 4,224 | 81.53% |
| 3 | Paradise | 6,793 | 5,506 | 81.05% |
| 4 | Sausalito | 7,171 | 5,810 | 81.02% |
| 5 | Fairfax | 7,523 | 6,072 | 80.71% |
| 6 | Laguna Beach | 22,777 | 18,328 | 80.47% |
| 7 | Truckee | 16,942 | 13,630 | 80.45% |
| 8 | Malibu | 10,516 | 8,363 | 79.53% |
| 9 | Grass Valley | 14,126 | 11,230 | 79.5% |
| 10 | Tiburon | 9,035 | 7,146 | 79.09% |
| 11 | Pismo Beach | 8,024 | 6,340 | 79.01% |
| 12 | Loomis | 6,809 | 5,378 | 78.98% |
| 13 | Sonoma | 10,726 | 8,377 | 78.1% |
| 14 | San Anselmo | 12,711 | 9,804 | 77.13% |
| 15 | Morro Bay | 10,717 | 8,264 | 77.11% |
| 16 | Rancho Mirage | 17,375 | 13,342 | 76.79% |
| 17 | Shasta Lake | 10,334 | 7,915 | 76.59% |
| 18 | Yreka | 7,832 | 5,992 | 76.51% |
| 19 | Westlake Village | 7,829 | 5,983 | 76.42% |
| 20 | Anderson | 11,282 | 8,609 | 76.31% |
| 21 | Newport Beach | 84,304 | 64,014 | 75.93% |
| 22 | Solana Beach | 12,841 | 9,626 | 74.96% |
| 23 | Scotts Valley | 12,138 | 9,032 | 74.41% |
| 24 | Lafayette | 25,277 | 18,750 | 74.18% |
| 25 | Encinitas | 61,585 | 45,501 | 73.88% |
| 26 | Redding | 93,268 | 68,898 | 73.87% |
| 27 | Auburn | 13,758 | 10,147 | 73.75% |
| 28 | Beverly Hills | 31,955 | 23,552 | 73.7% |
| 29 | Larkspur | 12,856 | 9,398 | 73.1% |
| 30 | Hermosa Beach | 19,248 | 14,018 | 72.83% |
| 31 | Arroyo Grande | 18,412 | 13,409 | 72.83% |
| 32 | Pacific Grove | 15,003 | 10,918 | 72.77% |
| 33 | Sebastopol | 7,466 | 5,426 | 72.68% |
| 34 | Manhattan Beach | 34,584 | 24,904 | 72.01% |
| 35 | Corte Madera | 10,101 | 7,263 | 71.9% |
| 36 | Dana Point | 32,883 | 23,637 | 71.88% |
| 37 | Ione | 5,306 | 3,801 | 71.64% |
| 38 | Ojai | 7,576 | 5,404 | 71.33% |
| 39 | San Clemente | 63,510 | 45,177 | 71.13% |
| 40 | Arcata | 18,578 | 13,176 | 70.92% |
| 41 | Calabasas | 22,869 | 16,128 | 70.52% |
| 42 | San Luis Obispo | 48,039 | 33,860 | 70.48% |
| 43 | Cotati | 7,533 | 5,270 | 69.96% |
| 44 | West Hollywood | 35,090 | 24,381 | 69.48% |
| 45 | Canyon Lake | 11,107 | 7,691 | 69.24% |
| 46 | Coronado | 18,558 | 12,812 | 69.04% |
| 47 | St. Helena | 5,378 | 3,710 | 68.98% |
| 48 | Agoura Hills | 19,881 | 13,660 | 68.71% |
| 49 | Placerville | 10,730 | 7,342 | 68.42% |
| 50 | Seal Beach | 24,868 | 17,004 | 68.38% |
| 51 | Laguna Woods | 17,342 | 11,806 | 68.08% |
| 52 | Big Bear Lake | 5,038 | 3,413 | 67.75% |
| 53 | Solvang | 6,034 | 4,086 | 67.72% |
| 54 | Orinda | 19,472 | 13,169 | 67.63% |
| 55 | Atascadero | 29,735 | 19,903 | 66.93% |
| 56 | Petaluma | 59,321 | 39,666 | 66.87% |
| 57 | Citrus Heights | 87,036 | 58,182 | 66.85% |
| 58 | Clayton | 10,962 | 7,265 | 66.27% |
| 59 | Fortuna | 12,413 | 8,201 | 66.07% |
| 60 | Carlsbad | 114,500 | 75,554 | 65.99% |
| 61 | Piedmont | 11,012 | 7,242 | 65.76% |
| 62 | Chico | 102,032 | 67,058 | 65.72% |
| 63 | Eureka | 26,302 | 17,234 | 65.52% |
| 64 | Ripon | 16,117 | 10,560 | 65.52% |
| 65 | Red Bluff | 14,592 | 9,556 | 65.49% |
| 66 | Danville | 43,426 | 28,296 | 65.16% |
| 67 | Lincoln | 51,629 | 33,599 | 65.08% |
| 68 | Los Gatos | 32,773 | 21,298 | 64.99% |
| 69 | Escalon | 7,429 | 4,813 | 64.79% |
| 70 | Laguna Niguel | 64,023 | 41,192 | 64.34% |
| 71 | Palm Desert | 51,551 | 33,161 | 64.33% |
| 72 | Ridgecrest | 28,138 | 18,081 | 64.26% |
| 73 | Rocklin | 72,340 | 46,467 | 64.23% |
| 74 | Mammoth Lakes | 7,233 | 4,632 | 64.04% |
| 75 | Atherton | 7,021 | 4,470 | 63.67% |
| 76 | Santee | 59,485 | 37,756 | 63.47% |
| 77 | Villa Park | 5,776 | 3,665 | 63.45% |
| 78 | Monterey | 29,772 | 18,862 | 63.35% |
| 79 | Thousand Oaks | 125,676 | 78,970 | 62.84% |
| 80 | Palm Springs | 44,998 | 28,111 | 62.47% |
| 81 | Glendale | 192,270 | 119,803 | 62.31% |
| 82 | Walnut Creek | 69,790 | 43,422 | 62.22% |
| 83 | Healdsburg | 11,274 | 6,997 | 62.06% |
| 84 | Roseville | 152,438 | 94,548 | 62.02% |
| 85 | Palos Verdes Estates | 13,047 | 8,083 | 61.95% |
| 86 | Santa Monica | 91,535 | 56,603 | 61.84% |
| 87 | Moraga | 16,790 | 10,270 | 61.17% |
| 88 | Yucca Valley | 21,744 | 13,287 | 61.11% |
| 89 | Half Moon Bay | 11,454 | 6,947 | 60.65% |
| 90 | Rio Vista | 10,002 | 6,039 | 60.38% |
| 91 | Santa Cruz | 60,953 | 36,374 | 59.68% |
| 92 | Rancho Santa Margarita | 47,257 | 28,164 | 59.6% |
| 93 | Poway | 48,515 | 28,892 | 59.55% |
| 94 | Benicia | 26,861 | 15,989 | 59.52% |
| 95 | Capitola | 9,813 | 5,835 | 59.46% |
| 96 | Mission Viejo | 92,415 | 54,928 | 59.44% |
| 97 | Marysville | 12,703 | 7,538 | 59.34% |
| 98 | Huntington Beach | 196,010 | 116,126 | 59.24% |
| 99 | South Lake Tahoe | 21,319 | 12,617 | 59.18% |
| 100 | Cloverdale | 8,933 | 5,277 | 59.07% |