
Whitest cities in Connecticut research summary. We analyzed Connecticut’s most recent Census data to determine the whitest cities in Connecticut based on the percentage of White residents. Here are the results of our analysis:
-
The whitest city in Connecticut is Portland based on the most recent Census data.
-
Portland is 85.08% White.
-
The least White city in Connecticut is Hartford.
-
Hartford is 15.08% White.
-
Connecticut is 61.9% White.
-
Connecticut is the 32nd Whitest state in the United States.
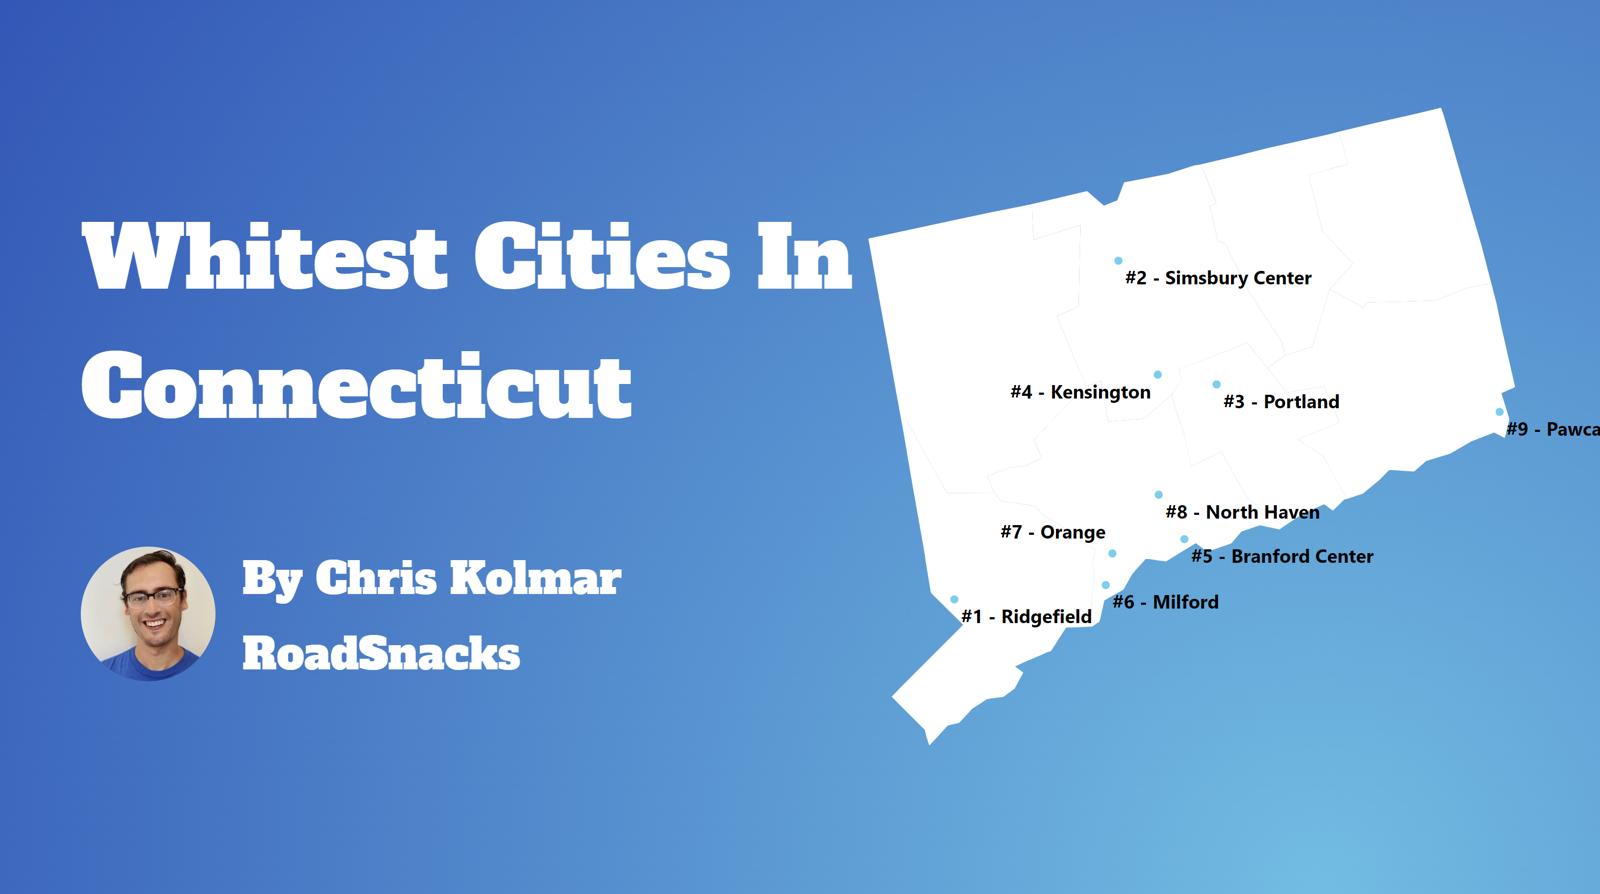
Table Of Contents: Top Ten | Methodology | Summary | Table
Today, we are looking at the whitest places in Connecticut. We won’t measure the number of Whole Foods or Pottery Barns per capita. Instead, we’ll focus on the Census data’s report of race by place in Connecticut. In particular, we ranked each place in Connecticut by the percentage of white people.
So where are the whitest cities you can live in Connecticut?
After analyzing cities with populations greater than 5,000, we came up with this list as the whitest cities in Connecticut for 2026.
Here are the 10 whites places in Connecticut for 2026:
What is the whitest city in Connecticut for 2026? According to the most recent census data Portland ranks as the whitest. If you’re wondering, Hartford is the least white city of all those we measured.
Read on below to see where your hometown ranked and why. Or check out the whitest states in America and the most diverse states in America.
For more Connecticut reading, check out:
- Worst Places To Live In Connecticut
- Best Places To Live In Connecticut
- Cheapest Places To Live In Connecticut
The 10 Whitest Cities In Connecticut For 2026

/10
Population: 5,944
% White: 85.08%
More on Portland: Data | Crime | Cost Of Living | Movers

/10
Population: 6,198
% White: 83.93%
More on Simsbury Center: Data | Cost Of Living | Movers

/10
Population: 8,115
% White: 83.86%
More on Southwood Acres: Data | Cost Of Living | Movers

/10
Population: 5,461
% White: 83.59%
More on Terryville: Data | Cost Of Living | Movers

/10
Population: 7,266
% White: 83.39%
More on Glastonbury Center: Data | Cost Of Living | Movers

/10
Population: 6,305
% White: 83.16%
More on Branford Center: Data | Cost Of Living | Movers

/10
Population: 7,120
% White: 82.72%
More on Putnam: Data | Crime | Cost Of Living | Movers

/10
Population: 6,977
% White: 82.11%
More on Winsted: Data | Cost Of Living | Movers
/10
Population: 5,577
% White: 81.87%
More on Pawcatuck: Data | Cost Of Living | Movers

/10
Population: 9,962
% White: 81.42%
More on Kensington: Data | Cost Of Living | Movers
Methodology: How we determined the whitest places in Connecticut for 2026
To rank the whitest places in Connecticut, we used Saturday Night Science to look at Census demographic data.
We had to look at the number of white people living in each city in Connecticut on a per capita basis. In other words, the percentage of white people living in each city in Connecticut.
We looked at table B03002: Hispanic OR LATINO ORIGIN BY RACE. Here are the category names as defined by the Census:
- Hispanic or Latino
- White alone*
- Black or African American alone*
- American Indian and Alaska Native alone*
- Asian alone*
- Native Hawaiian and Other Pacific Islander alone*
- Some other race alone*
- Two or more races*
Our particular column of interest here was the number of people who identified as White alone.
We limited our analysis to town with a population greater than 5,000 people. That left us with 55 cities.
We then calculated the percentage of residents that are White. The percentages ranked from 85.1% to 15.1%.
Finally, we ranked each city based on the percentage of White population, with a higher score being more White than a lower score. Portland took the distinction of being the most White, while Hartford was the least White city.
We updated this article for 2026. This report represents our eleventh time ranking the whitest cities in Connecticut.
Read on for more information on how the cities in Connecticut ranked by population of White residents or, for a more general take on diversity in America, head over to our ranking of the most diverse cities in America.
Summary: White Populations Across Connecticut
We measured the locations with the highest percentage of white people in Connecticut. According to the most recent data, this list provides accurate information on the whitest places in Connecticut.
The most White cities in Connecticut are Portland, Simsbury Center, Southwood Acres, Terryville, Glastonbury Center, Branford Center, Putnam, Winsted, Pawcatuck, and Kensington.
If you’re curious enough, here are the least White places in Connecticut:
- Hartford
- Bridgeport
- Waterbury
For more Connecticut reading, check out:
- Best Places To Raise A Family In Connecticut
- Most Dangerous Cities In Connecticut
- Safest Places In Connecticut
White Population By City In Connecticut
| Rank | City | Population | White Population | % White |
|---|---|---|---|---|
| 1 | Portland | 5,944 | 5,057 | 85.08% |
| 2 | Simsbury Center | 6,198 | 5,202 | 83.93% |
| 3 | Southwood Acres | 8,115 | 6,805 | 83.86% |
| 4 | Terryville | 5,461 | 4,565 | 83.59% |
| 5 | Glastonbury Center | 7,266 | 6,059 | 83.39% |
| 6 | Branford Center | 6,305 | 5,243 | 83.16% |
| 7 | Putnam | 7,120 | 5,890 | 82.72% |
| 8 | Winsted | 6,977 | 5,729 | 82.11% |
| 9 | Pawcatuck | 5,577 | 4,566 | 81.87% |
| 10 | Kensington | 9,962 | 8,111 | 81.42% |
| 11 | Ridgefield | 6,970 | 5,668 | 81.32% |
| 12 | Oakville | 9,276 | 7,486 | 80.7% |
| 13 | Milford | 51,023 | 40,898 | 80.16% |
| 14 | Cheshire Village | 6,172 | 4,918 | 79.68% |
| 15 | Orange | 14,315 | 11,393 | 79.59% |
| 16 | Sherwood Manor | 5,706 | 4,448 | 77.95% |
| 17 | North Haven | 24,336 | 18,624 | 76.53% |
| 18 | Old Greenwich | 6,936 | 5,305 | 76.49% |
| 19 | Wethersfield | 27,250 | 20,385 | 74.81% |
| 20 | Newington | 30,896 | 22,221 | 71.92% |
| 21 | New Milford | 8,188 | 5,854 | 71.49% |
| 22 | Windsor Locks | 12,579 | 8,847 | 70.33% |
| 23 | Torrington | 35,547 | 24,822 | 69.83% |
| 24 | Wallingford Center | 18,208 | 12,601 | 69.21% |
| 25 | East Haven | 27,806 | 19,214 | 69.1% |
| 26 | Groton | 9,490 | 6,362 | 67.04% |
| 27 | West Hartford | 63,620 | 42,650 | 67.04% |
| 28 | Shelton | 41,889 | 27,919 | 66.65% |
| 29 | Cos Cob | 7,546 | 4,863 | 64.44% |
| 30 | Greenwich | 14,792 | 9,381 | 63.42% |
| 31 | Middletown | 47,958 | 30,069 | 62.7% |
| 32 | Riverside | 8,954 | 5,542 | 61.89% |
| 33 | Bristol | 61,462 | 38,005 | 61.83% |
| 34 | Thompsonville | 7,927 | 4,872 | 61.46% |
| 35 | Storrs | 15,207 | 9,327 | 61.33% |
| 36 | Rockville | 7,072 | 4,269 | 60.36% |
| 37 | Naugatuck | 31,800 | 19,149 | 60.22% |
| 38 | Bethel | 11,404 | 6,733 | 59.04% |
| 39 | Derby | 12,487 | 7,193 | 57.6% |
| 40 | Norwich | 39,973 | 22,000 | 55.04% |
| 41 | Ansonia | 19,033 | 10,009 | 52.59% |
| 42 | Manchester | 36,759 | 19,084 | 51.92% |
| 43 | Meriden | 60,545 | 28,845 | 47.64% |
| 44 | New London | 27,625 | 12,266 | 44.4% |
| 45 | West Haven | 55,351 | 24,086 | 43.52% |
| 46 | Stamford | 137,144 | 59,210 | 43.17% |
| 47 | Norwalk | 92,187 | 39,387 | 42.73% |
| 48 | Willimantic | 18,096 | 7,566 | 41.81% |
| 49 | New Britain | 74,223 | 29,922 | 40.31% |
| 50 | Danbury | 87,263 | 35,032 | 40.15% |
| 51 | New Haven | 134,349 | 40,362 | 30.04% |
| 52 | East Hartford | 50,918 | 15,049 | 29.56% |
| 53 | Waterbury | 114,869 | 33,693 | 29.33% |
| 54 | Bridgeport | 149,153 | 36,604 | 24.54% |
| 55 | Hartford | 121,127 | 18,272 | 15.08% |