
Whitest cities in Kentucky research summary. We analyzed Kentucky’s most recent Census data to determine the whitest cities in Kentucky based on the percentage of White residents. Here are the results of our analysis:
-
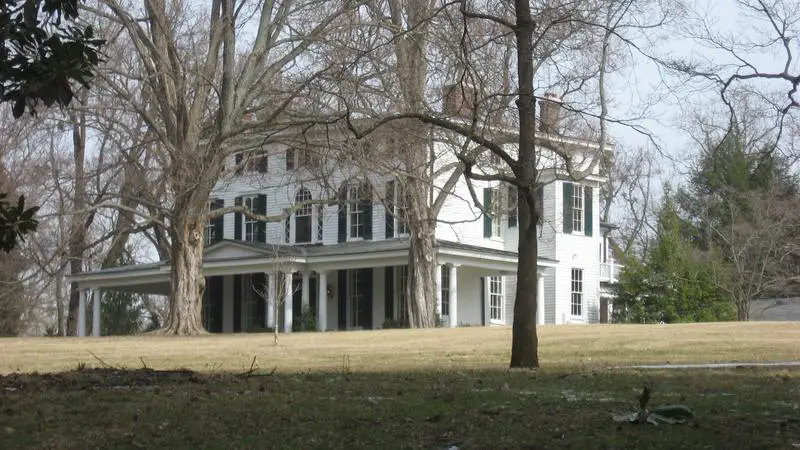
The whitest city in Kentucky is Edgewood based on the most recent Census data.
-
Edgewood is 96.32% White.
-
The least White city in Kentucky is Shively.
-
Shively is 35.56% White.
-
Kentucky is 82.3% White.
-
Kentucky is the 8th Whitest state in the United States.
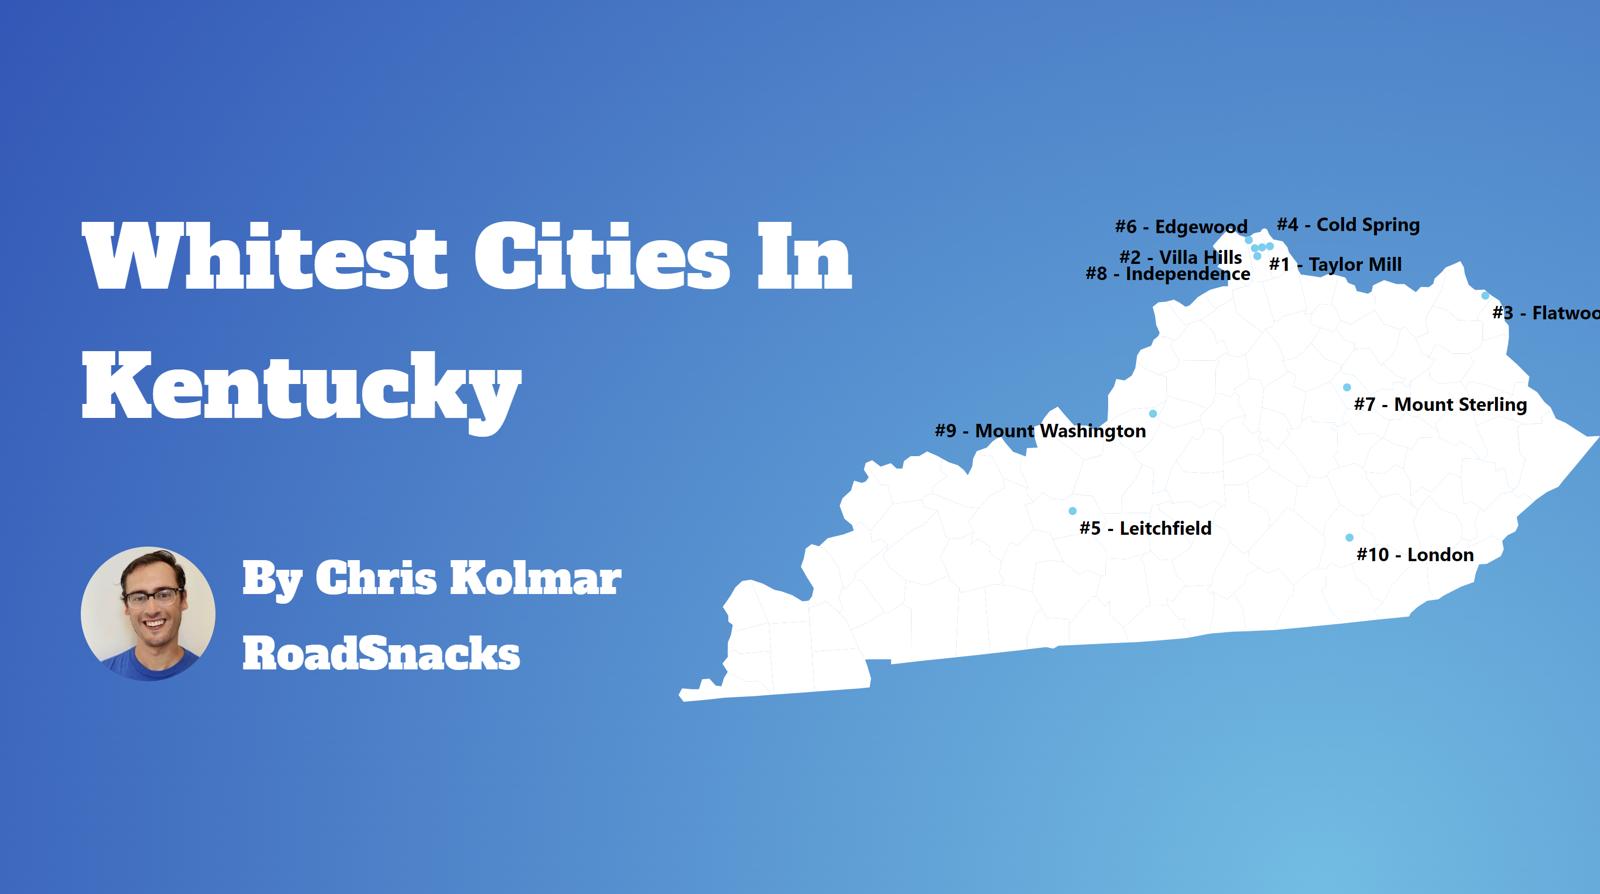
Table Of Contents: Top Ten | Methodology | Summary | Table
Today, we are looking at the whitest places in Kentucky. We won’t measure the number of Whole Foods or Pottery Barns per capita. Instead, we’ll focus on the Census data’s report of race by place in Kentucky. In particular, we ranked each place in Kentucky by the percentage of white people.
So where are the whitest cities you can live in Kentucky?
After analyzing cities with populations greater than 5,000, we came up with this list as the whitest cities in Kentucky for 2025.
Here are the 10 whites places in Kentucky for 2025:
What is the whitest city in Kentucky for 2025? According to the most recent census data Edgewood ranks as the whitest. If you’re wondering, Shively is the least white city of all those we measured.
Read on below to see where your hometown ranked and why. Or check out the whitest states in America and the most diverse states in America.
For more Kentucky reading, check out:
The 10 Whitest Cities In Kentucky For 2025

/10
Population: 8,429
% White: 96.32%
More on Edgewood: Data

/10
Population: 6,880
% White: 96.02%
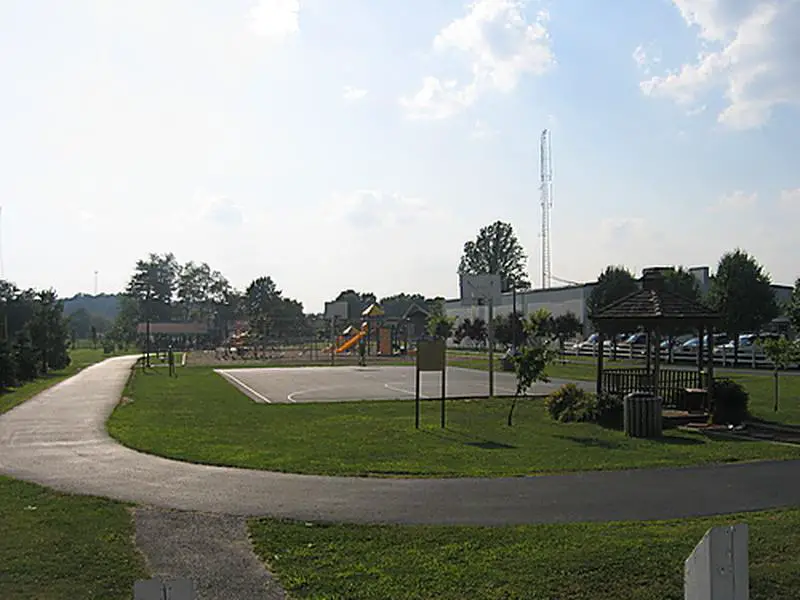
More on Taylor Mill: Data

/10
Population: 7,281
% White: 95.67%
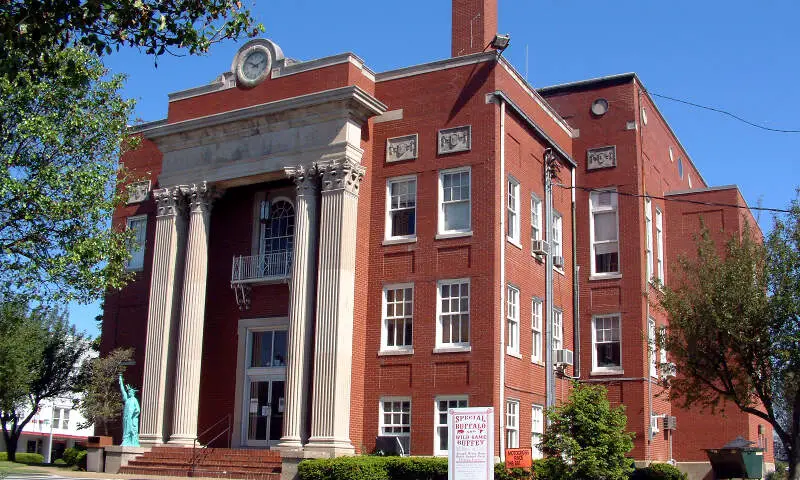
More on Flatwoods: Data

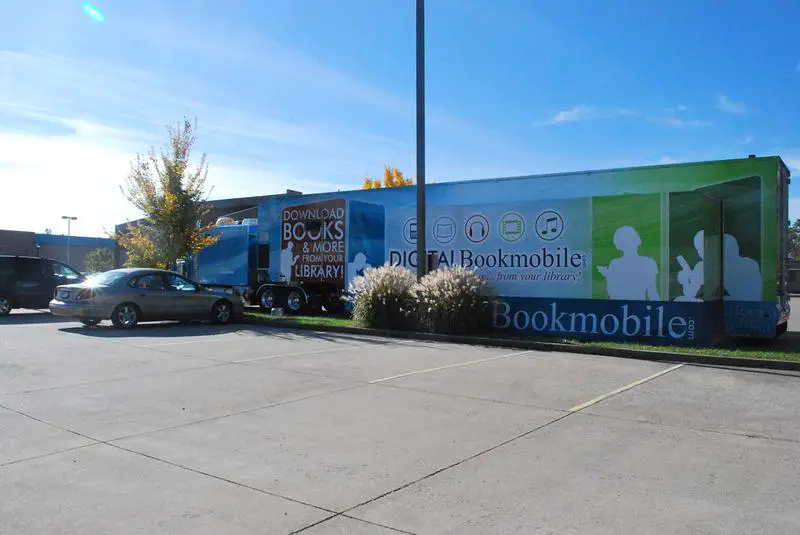
/10
Population: 6,434
% White: 95.09%
More on Leitchfield: Data

/10
Population: 7,378
% White: 94.99%
More on Villa Hills: Data

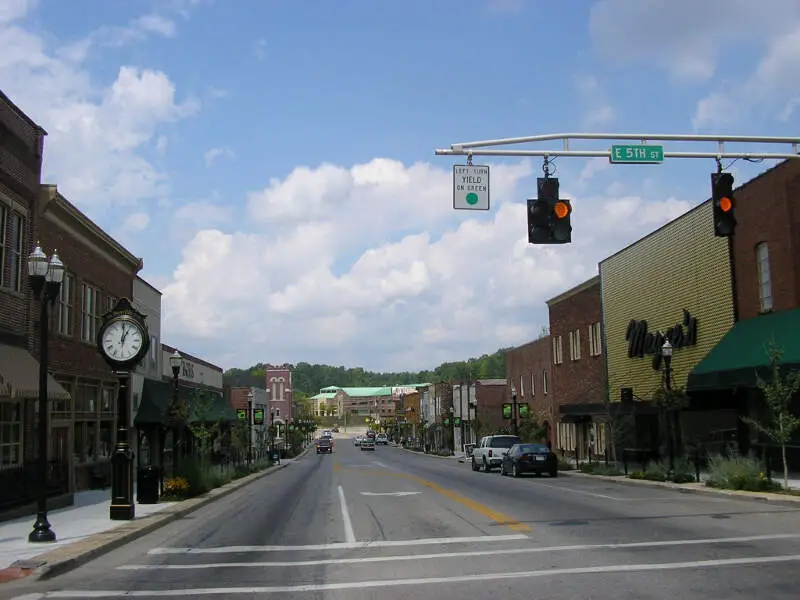
/10
Population: 7,576
% White: 93.98%
More on London: Data

/10
Population: 6,298
% White: 93.33%
More on Cold Spring: Data

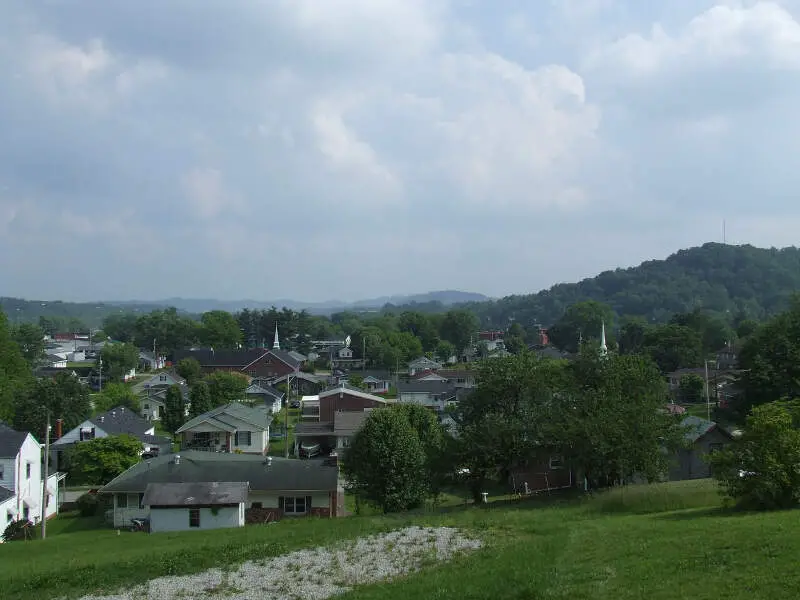
/10
Population: 8,430
% White: 92.94%
More on Corbin: Data

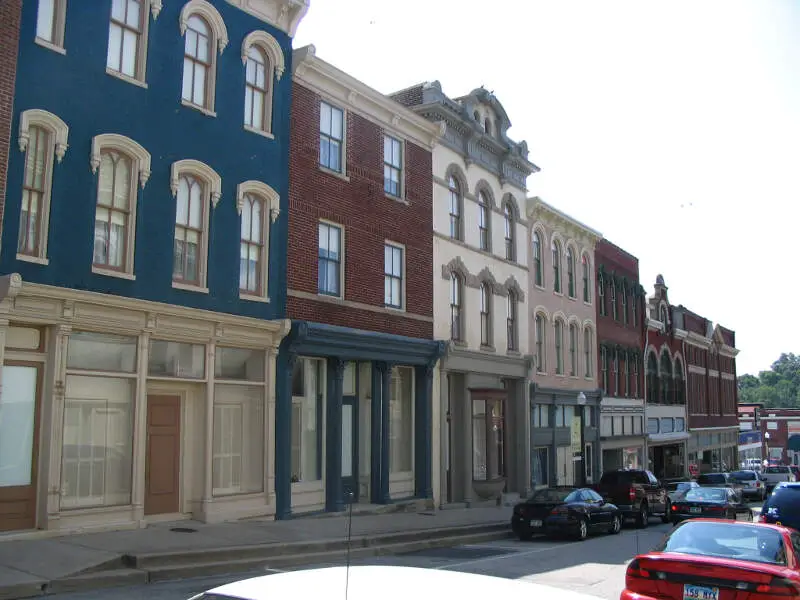
/10
Population: 7,549
% White: 92.74%
More on Mount Sterling: Data

/10
Population: 29,024
% White: 92.34%
More on Independence: Data
Methodology: How we determined the whitest places in Kentucky for 2025
To rank the whitest places in Kentucky, we used Saturday Night Science to look at Census demographic data.
We had to look at the number of white people living in each city in Kentucky on a per capita basis. In other words, the percentage of white people living in each city in Kentucky.
We looked at table B03002: Hispanic OR LATINO ORIGIN BY RACE. Here are the category names as defined by the Census:
- Hispanic or Latino
- White alone*
- Black or African American alone*
- American Indian and Alaska Native alone*
- Asian alone*
- Native Hawaiian and Other Pacific Islander alone*
- Some other race alone*
- Two or more races*
Our particular column of interest here was the number of people who identified as White alone.
We limited our analysis to town with a population greater than 5,000 people. That left us with 75 cities.
We then calculated the percentage of residents that are White. The percentages ranked from 96.3% to 35.6%.
Finally, we ranked each city based on the percentage of White population, with a higher score being more White than a lower score. Edgewood took the distinction of being the most White, while Shively was the least White city.
We updated this article for 2025. This report represents our tenth time ranking the whitest cities in Kentucky.
Read on for more information on how the cities in Kentucky ranked by population of White residents or, for a more general take on diversity in America, head over to our ranking of the most diverse cities in America.
Summary: White Populations Across Kentucky
We measured the locations with the highest percentage of white people in Kentucky. According to the most recent data, this list provides accurate information on the whitest places in Kentucky.
The most White cities in Kentucky are Edgewood, Taylor Mill, Flatwoods, Leitchfield, Villa Hills, London, Cold Spring, Corbin, Mount Sterling, and Independence.
If you’re curious enough, here are the least White places in Kentucky:
- Shively
- Oak Grove
- Radcliff
For more Kentucky reading, check out:
- Cheapest Places To Live In Kentucky
- Safest Places In Kentucky
- Best Places To Raise A Family In Kentucky
White Population By City In Kentucky
| Rank | City | Population | White Population | % White |
|---|---|---|---|---|
| 1 | Edgewood | 8,429 | 8,119 | 96.32% |
| 2 | Taylor Mill | 6,880 | 6,606 | 96.02% |
| 3 | Flatwoods | 7,281 | 6,966 | 95.67% |
| 4 | Leitchfield | 6,434 | 6,118 | 95.09% |
| 5 | Villa Hills | 7,378 | 7,008 | 94.99% |
| 6 | London | 7,576 | 7,120 | 93.98% |
| 7 | Cold Spring | 6,298 | 5,878 | 93.33% |
| 8 | Corbin | 8,430 | 7,835 | 92.94% |
| 9 | Mount Sterling | 7,549 | 7,001 | 92.74% |
| 10 | Independence | 29,024 | 26,801 | 92.34% |
| 11 | Shepherdsville | 14,351 | 13,238 | 92.24% |
| 12 | Pikeville | 7,560 | 6,959 | 92.05% |
| 13 | Union | 7,494 | 6,894 | 91.99% |
| 14 | Mount Washington | 18,228 | 16,739 | 91.83% |
| 15 | Ashland | 21,405 | 19,588 | 91.51% |
| 16 | Cynthiana | 6,412 | 5,813 | 90.66% |
| 17 | Lawrenceburg | 11,838 | 10,717 | 90.53% |
| 18 | Alexandria | 10,430 | 9,441 | 90.52% |
| 19 | Middlesborough | 9,258 | 8,366 | 90.37% |
| 20 | Bellevue | 5,598 | 5,045 | 90.12% |
| 21 | Fort Thomas | 17,242 | 15,534 | 90.09% |
| 22 | Dayton | 5,703 | 5,100 | 89.43% |
| 23 | Central City | 5,736 | 5,105 | 89.0% |
| 24 | Berea | 15,557 | 13,760 | 88.45% |
| 25 | Highland Heights | 6,531 | 5,762 | 88.23% |
| 26 | Williamsburg | 5,226 | 4,594 | 87.91% |
| 27 | Morehead | 6,924 | 6,084 | 87.87% |
| 28 | Fort Mitchell | 8,676 | 7,586 | 87.44% |
| 29 | La Grange | 10,188 | 8,826 | 86.63% |
| 30 | Fort Wright | 5,882 | 5,094 | 86.6% |
| 31 | Somerset | 12,108 | 10,419 | 86.05% |
| 32 | Erlanger | 19,677 | 16,833 | 85.55% |
| 33 | Maysville | 8,778 | 7,505 | 85.5% |
| 34 | Nicholasville | 31,625 | 26,862 | 84.94% |
| 35 | Douglass Hills | 5,437 | 4,607 | 84.73% |
| 36 | St. Matthews | 17,491 | 14,785 | 84.53% |
| 37 | Winchester | 19,133 | 16,155 | 84.44% |
| 38 | Richmond | 35,498 | 29,788 | 83.91% |
| 39 | Newport | 14,039 | 11,743 | 83.65% |
| 40 | Princeton | 6,242 | 5,208 | 83.43% |
| 41 | Campbellsville | 11,523 | 9,603 | 83.34% |
| 42 | Monticello | 5,741 | 4,736 | 82.49% |
| 43 | Murray | 17,888 | 14,704 | 82.2% |
| 44 | Georgetown | 38,206 | 31,404 | 82.2% |
| 45 | Harrodsburg | 9,126 | 7,428 | 81.39% |
| 46 | Florence | 32,334 | 25,969 | 80.31% |
| 47 | Paris | 10,107 | 8,103 | 80.17% |
| 48 | Owensboro | 60,112 | 48,191 | 80.17% |
| 49 | Franklin | 10,254 | 8,144 | 79.42% |
| 50 | Henderson | 27,994 | 22,207 | 79.33% |
| 51 | Elsmere | 9,151 | 7,252 | 79.25% |
| 52 | Bardstown | 13,673 | 10,826 | 79.18% |
| 53 | Russellville | 7,244 | 5,699 | 78.67% |
| 54 | Glasgow | 15,141 | 11,801 | 77.94% |
| 55 | Danville | 17,235 | 13,330 | 77.34% |
| 56 | Madisonville | 19,442 | 15,035 | 77.33% |
| 57 | Hillview | 8,735 | 6,687 | 76.55% |
| 58 | Covington | 40,902 | 30,591 | 74.79% |
| 59 | Jeffersontown | 28,988 | 21,506 | 74.19% |
| 60 | Versailles | 10,382 | 7,692 | 74.09% |
| 61 | Middletown | 9,622 | 7,127 | 74.07% |
| 62 | Elizabethtown | 31,870 | 23,525 | 73.82% |
| 63 | Lyndon | 10,956 | 7,938 | 72.45% |
| 64 | Frankfort | 28,452 | 20,492 | 72.02% |
| 65 | Lebanon | 6,364 | 4,502 | 70.74% |
| 66 | Paducah | 26,894 | 18,953 | 70.47% |
| 67 | Lexington-Fayette Urban County | 321,122 | 217,678 | 67.79% |
| 68 | Mayfield | 9,905 | 6,714 | 67.78% |
| 69 | Shelbyville | 17,436 | 11,296 | 64.79% |
| 70 | Bowling Green | 73,638 | 46,575 | 63.25% |
| 71 | Louisville/jefferson County Metro Government (Balance) | 627,210 | 382,456 | 60.98% |
| 72 | Hopkinsville | 31,011 | 18,343 | 59.15% |
| 73 | Radcliff | 22,967 | 13,001 | 56.61% |
| 74 | Oak Grove | 7,945 | 4,353 | 54.79% |
| 75 | Shively | 15,556 | 5,531 | 35.56% |