
Whitest cities in Michigan research summary. We analyzed Michigan’s most recent Census data to determine the whitest cities in Michigan based on the percentage of White residents. Here are the results of our analysis:
-
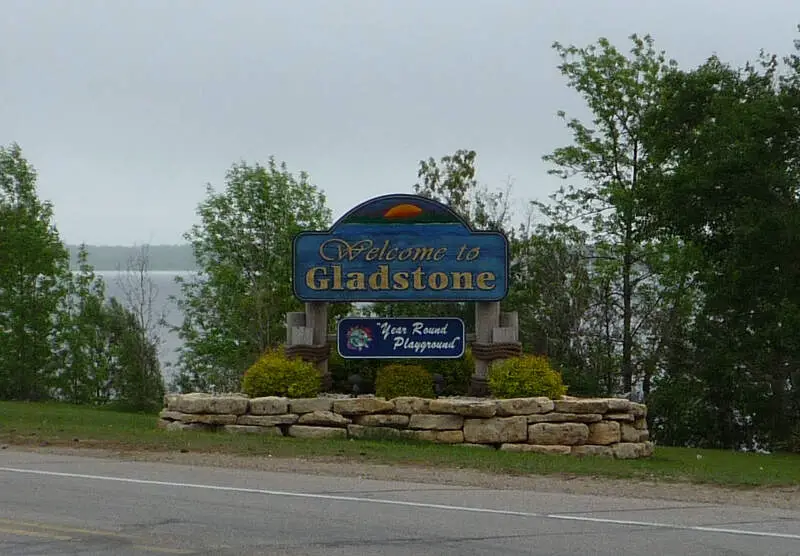
The whitest city in Michigan is Gladstone based on the most recent Census data.
-
Gladstone is 94.81% White.
-
The least White city in Michigan is Highland Park.
-
Highland Park is 9.17% White.
-
Michigan is 73.0% White.
-
Michigan is the 21st Whitest state in the United States.
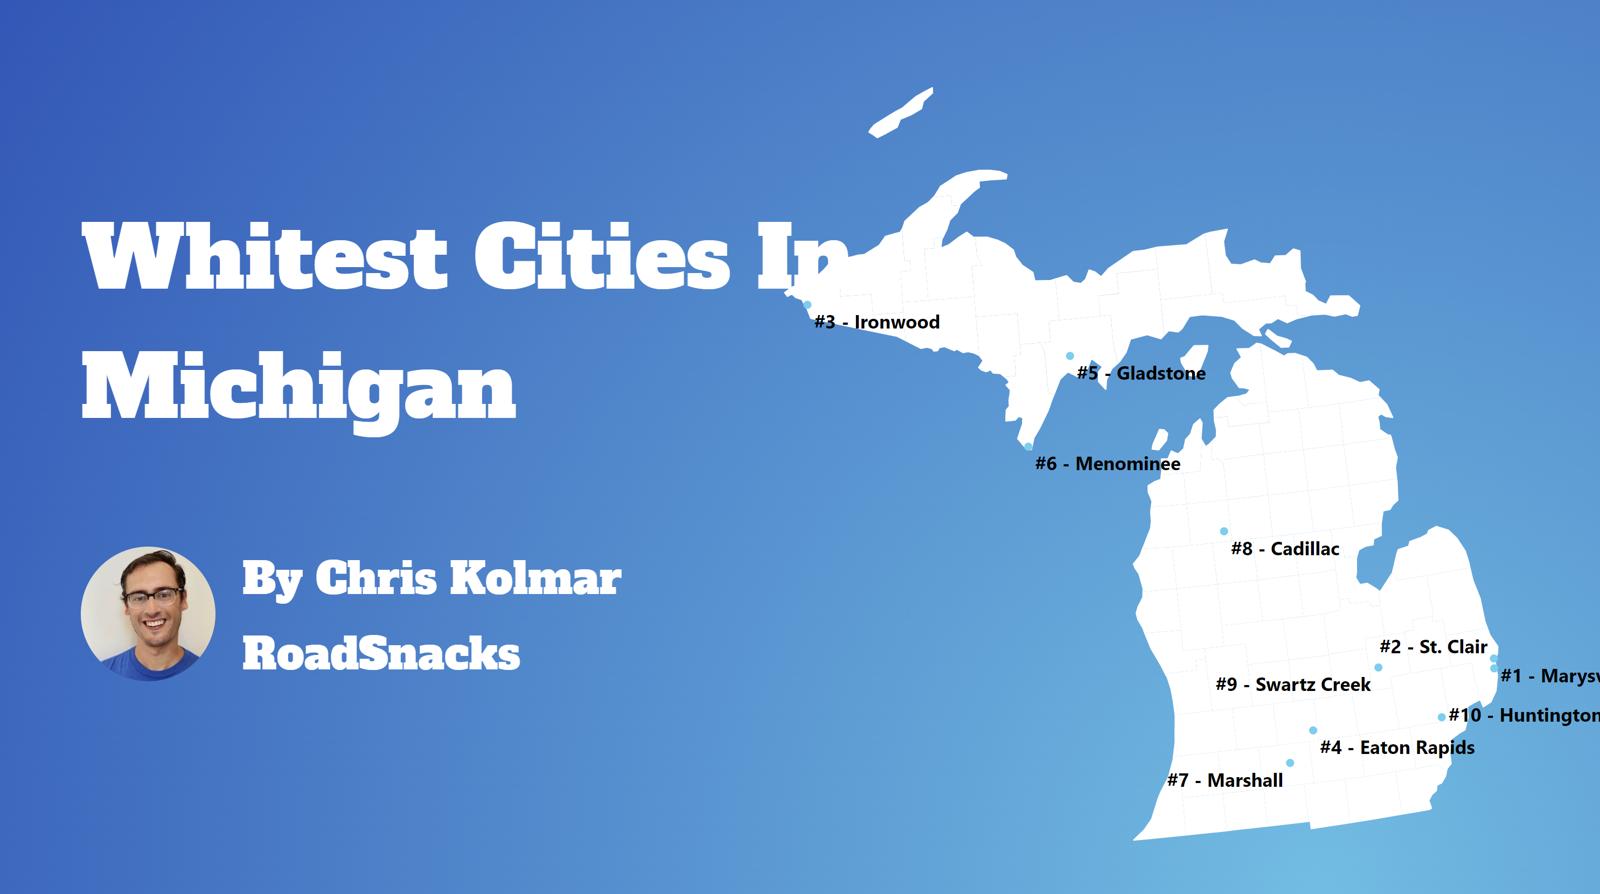
Table Of Contents: Top Ten | Methodology | Summary | Table
Today, we are looking at the whitest places in Michigan. We won’t measure the number of Whole Foods or Pottery Barns per capita. Instead, we’ll focus on the Census data’s report of race by place in Michigan. In particular, we ranked each place in Michigan by the percentage of white people.
So where are the whitest cities you can live in Michigan?
After analyzing cities with populations greater than 5,000, we came up with this list as the whitest cities in Michigan for 2025.
Here are the 10 whites places in Michigan for 2025:
What is the whitest city in Michigan for 2025? According to the most recent census data Gladstone ranks as the whitest. If you’re wondering, Highland Park is the least white city of all those we measured.
Read on below to see where your hometown ranked and why. Or check out the whitest states in America and the most diverse states in America.
For more Michigan reading, check out:
- Cheapest Places To Live In Michigan
- Most Dangerous Places in Michigan
- Worst Places To Live In Michigan
The 10 Whitest Cities In Michigan For 2025
/10
Population: 5,240
% White: 94.81%
More on Gladstone: Data

/10
Population: 8,370
% White: 94.64%
More on Menominee: Data

/10
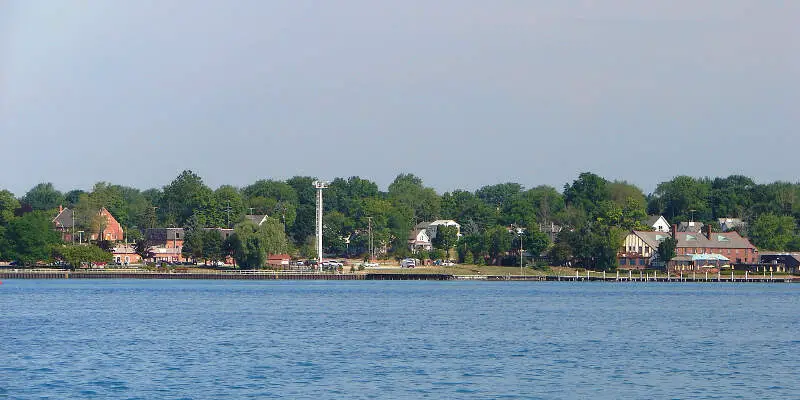
Population: 5,581
% White: 94.46%
More on St. Clair: Data

/10
Population: 7,576
% White: 93.88%
More on Brighton: Data

/10
Population: 6,322
% White: 93.53%
More on Huntington Woods: Data
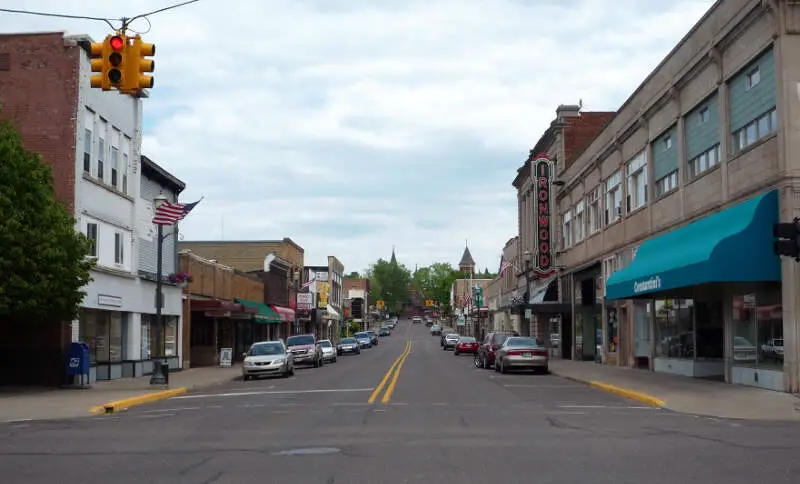
/10
Population: 5,004
% White: 93.51%
More on Ironwood: Data

/10
Population: 9,942
% White: 93.22%
More on Marysville: Data
/10
Population: 5,197
% White: 93.09%
More on Eaton Rapids: Data

/10
Population: 10,404
% White: 92.5%
More on Cadillac: Data

/10
Population: 14,658
% White: 92.05%
More on Owosso: Data
Methodology: How we determined the whitest places in Michigan for 2025
To rank the whitest places in Michigan, we used Saturday Night Science to look at Census demographic data.
We had to look at the number of white people living in each city in Michigan on a per capita basis. In other words, the percentage of white people living in each city in Michigan.
We looked at table B03002: Hispanic OR LATINO ORIGIN BY RACE. Here are the category names as defined by the Census:
- Hispanic or Latino
- White alone*
- Black or African American alone*
- American Indian and Alaska Native alone*
- Asian alone*
- Native Hawaiian and Other Pacific Islander alone*
- Some other race alone*
- Two or more races*
Our particular column of interest here was the number of people who identified as White alone.
We limited our analysis to town with a population greater than 5,000 people. That left us with 148 cities.
We then calculated the percentage of residents that are White. The percentages ranked from 94.8% to 9.2%.
Finally, we ranked each city based on the percentage of White population, with a higher score being more White than a lower score. Gladstone took the distinction of being the most White, while Highland Park was the least White city.
We updated this article for 2025. This report represents our tenth time ranking the whitest cities in Michigan.
Read on for more information on how the cities in Michigan ranked by population of White residents or, for a more general take on diversity in America, head over to our ranking of the most diverse cities in America.
Summary: White Populations Across Michigan
We measured the locations with the highest percentage of white people in Michigan. According to the most recent data, this list provides accurate information on the whitest places in Michigan.
The most White cities in Michigan are Gladstone, Menominee, St. Clair, Brighton, Huntington Woods, Ironwood, Marysville, Eaton Rapids, Cadillac, and Owosso.
If you’re curious enough, here are the least White places in Michigan:
- Highland Park
- Benton Harbor
- Detroit
For more Michigan reading, check out:
White Population By City In Michigan
| Rank | City | Population | White Population | % White |
|---|---|---|---|---|
| 1 | Gladstone | 5,240 | 4,968 | 94.81% |
| 2 | Menominee | 8,370 | 7,921 | 94.64% |
| 3 | St. Clair | 5,581 | 5,272 | 94.46% |
| 4 | Brighton | 7,576 | 7,112 | 93.88% |
| 5 | Huntington Woods | 6,322 | 5,913 | 93.53% |
| 6 | Ironwood | 5,004 | 4,679 | 93.51% |
| 7 | Marysville | 9,942 | 9,268 | 93.22% |
| 8 | Eaton Rapids | 5,197 | 4,838 | 93.09% |
| 9 | Cadillac | 10,404 | 9,624 | 92.5% |
| 10 | Owosso | 14,658 | 13,493 | 92.05% |
| 11 | Alpena | 10,178 | 9,345 | 91.82% |
| 12 | Davison | 5,082 | 4,662 | 91.74% |
| 13 | Swartz Creek | 5,856 | 5,370 | 91.7% |
| 14 | Hudsonville | 7,711 | 7,065 | 91.62% |
| 15 | Hastings | 7,515 | 6,844 | 91.07% |
| 16 | Iron Mountain | 7,508 | 6,828 | 90.94% |
| 17 | Kingsford | 5,138 | 4,668 | 90.85% |
| 18 | East Grand Rapids | 11,394 | 10,347 | 90.81% |
| 19 | Marshall | 6,797 | 6,164 | 90.69% |
| 20 | Ishpeming | 6,173 | 5,589 | 90.54% |
| 21 | New Baltimore | 12,060 | 10,883 | 90.24% |
| 22 | Grand Ledge | 7,797 | 7,004 | 89.83% |
| 23 | Grosse Pointe Farms | 9,957 | 8,944 | 89.83% |
| 24 | St. Johns | 7,712 | 6,923 | 89.77% |
| 25 | Plymouth | 9,234 | 8,269 | 89.55% |
| 26 | Rockford | 6,162 | 5,516 | 89.52% |
| 27 | Zeeland | 5,691 | 5,094 | 89.51% |
| 28 | Charlotte | 9,269 | 8,272 | 89.24% |
| 29 | South Lyon | 11,825 | 10,529 | 89.04% |
| 30 | Traverse City | 15,491 | 13,784 | 88.98% |
| 31 | Grosse Pointe | 5,561 | 4,933 | 88.71% |
| 32 | Milford | 6,467 | 5,726 | 88.54% |
| 33 | Fenton | 11,950 | 10,580 | 88.54% |
| 34 | Marquette | 20,691 | 18,285 | 88.37% |
| 35 | Ludington | 7,664 | 6,767 | 88.3% |
| 36 | St. Clair Shores | 58,287 | 51,409 | 88.2% |
| 37 | Northville | 6,080 | 5,359 | 88.14% |
| 38 | Mason | 8,239 | 7,251 | 88.01% |
| 39 | Grand Haven | 10,966 | 9,646 | 87.96% |
| 40 | Belding | 5,949 | 5,226 | 87.85% |
| 41 | Norton Shores | 25,000 | 21,922 | 87.69% |
| 42 | Holly | 5,971 | 5,234 | 87.66% |
| 43 | Grosse Pointe Woods | 16,177 | 14,143 | 87.43% |
| 44 | Milan | 6,070 | 5,289 | 87.13% |
| 45 | Hillsdale | 8,013 | 6,977 | 87.07% |
| 46 | Dearborn | 107,846 | 93,797 | 86.97% |
| 47 | Clawson | 11,314 | 9,819 | 86.79% |
| 48 | Petoskey | 5,851 | 5,071 | 86.67% |
| 49 | Midland | 42,461 | 36,727 | 86.5% |
| 50 | Saline | 8,976 | 7,758 | 86.43% |
| 51 | Manistee | 6,275 | 5,421 | 86.39% |
| 52 | Escanaba | 12,374 | 10,686 | 86.36% |
| 53 | Howell | 10,074 | 8,695 | 86.31% |
| 54 | Flushing | 8,323 | 7,157 | 85.99% |
| 55 | Berkley | 15,084 | 12,962 | 85.93% |
| 56 | Greenville | 8,897 | 7,623 | 85.68% |
| 57 | Tecumseh | 8,655 | 7,405 | 85.56% |
| 58 | Trenton | 18,242 | 15,496 | 84.95% |
| 59 | Big Rapids | 7,847 | 6,620 | 84.36% |
| 60 | Walker | 25,201 | 21,242 | 84.29% |
| 61 | St. Joseph | 7,805 | 6,565 | 84.11% |
| 62 | Wyandotte | 24,593 | 20,657 | 84.0% |
| 63 | Monroe | 20,330 | 17,065 | 83.94% |
| 64 | Grosse Pointe Park | 11,394 | 9,564 | 83.94% |
| 65 | Birmingham | 21,612 | 18,108 | 83.79% |
| 66 | Walled Lake | 7,275 | 6,090 | 83.71% |
| 67 | Livonia | 94,058 | 77,685 | 82.59% |
| 68 | Rochester | 12,939 | 10,649 | 82.3% |
| 69 | Coldwater | 13,847 | 11,382 | 82.2% |
| 70 | Garden City | 26,910 | 22,099 | 82.12% |
| 71 | Dearborn Heights | 62,099 | 50,738 | 81.71% |
| 72 | Grandville | 16,135 | 13,129 | 81.37% |
| 73 | Alma | 9,421 | 7,626 | 80.95% |
| 74 | Ferndale | 19,156 | 15,501 | 80.92% |
| 75 | Fraser | 14,604 | 11,803 | 80.82% |
| 76 | Bay City | 32,445 | 26,222 | 80.82% |
| 77 | Royal Oak | 57,880 | 46,772 | 80.81% |
| 78 | Portage | 49,015 | 39,500 | 80.59% |
| 79 | Richmond | 5,839 | 4,686 | 80.25% |
| 80 | Beverly Hills | 10,507 | 8,428 | 80.21% |
| 81 | Burton | 29,529 | 23,473 | 79.49% |
| 82 | Madison Heights | 28,411 | 22,542 | 79.34% |
| 83 | Mount Pleasant | 21,420 | 16,990 | 79.32% |
| 84 | Port Huron | 28,724 | 22,556 | 78.53% |
| 85 | Houghton | 8,341 | 6,546 | 78.48% |
| 86 | Woodhaven | 12,761 | 10,005 | 78.4% |
| 87 | Sterling Heights | 133,473 | 104,321 | 78.16% |
| 88 | Niles | 11,838 | 9,226 | 77.94% |
| 89 | Allen Park | 28,128 | 21,704 | 77.16% |
| 90 | Lapeer | 9,053 | 6,975 | 77.05% |
| 91 | Riverview | 12,269 | 9,422 | 76.8% |
| 92 | Flat Rock | 10,418 | 7,970 | 76.5% |
| 93 | Grand Blanc | 7,995 | 6,032 | 75.45% |
| 94 | Southgate | 29,551 | 22,203 | 75.13% |
| 95 | Three Rivers | 7,936 | 5,916 | 74.55% |
| 96 | Wixom | 17,126 | 12,627 | 73.73% |
| 97 | Hazel Park | 14,945 | 11,003 | 73.62% |
| 98 | Rochester Hills | 76,086 | 55,755 | 73.28% |
| 99 | East Lansing | 45,394 | 32,650 | 71.93% |
| 100 | Ionia | 12,950 | 9,312 | 71.91% |