
Whitest cities in Missouri research summary. We analyzed Missouri’s most recent Census data to determine the whitest cities in Missouri based on the percentage of White residents. Here are the results of our analysis:
-
The whitest city in Missouri is Odessa based on the most recent Census data.
-
Odessa is 95.67% White.
-
The least White city in Missouri is Jennings.
-
Jennings is 4.6% White.
-
Missouri is 76.8% White.
-
Missouri is the 13th Whitest state in the United States.
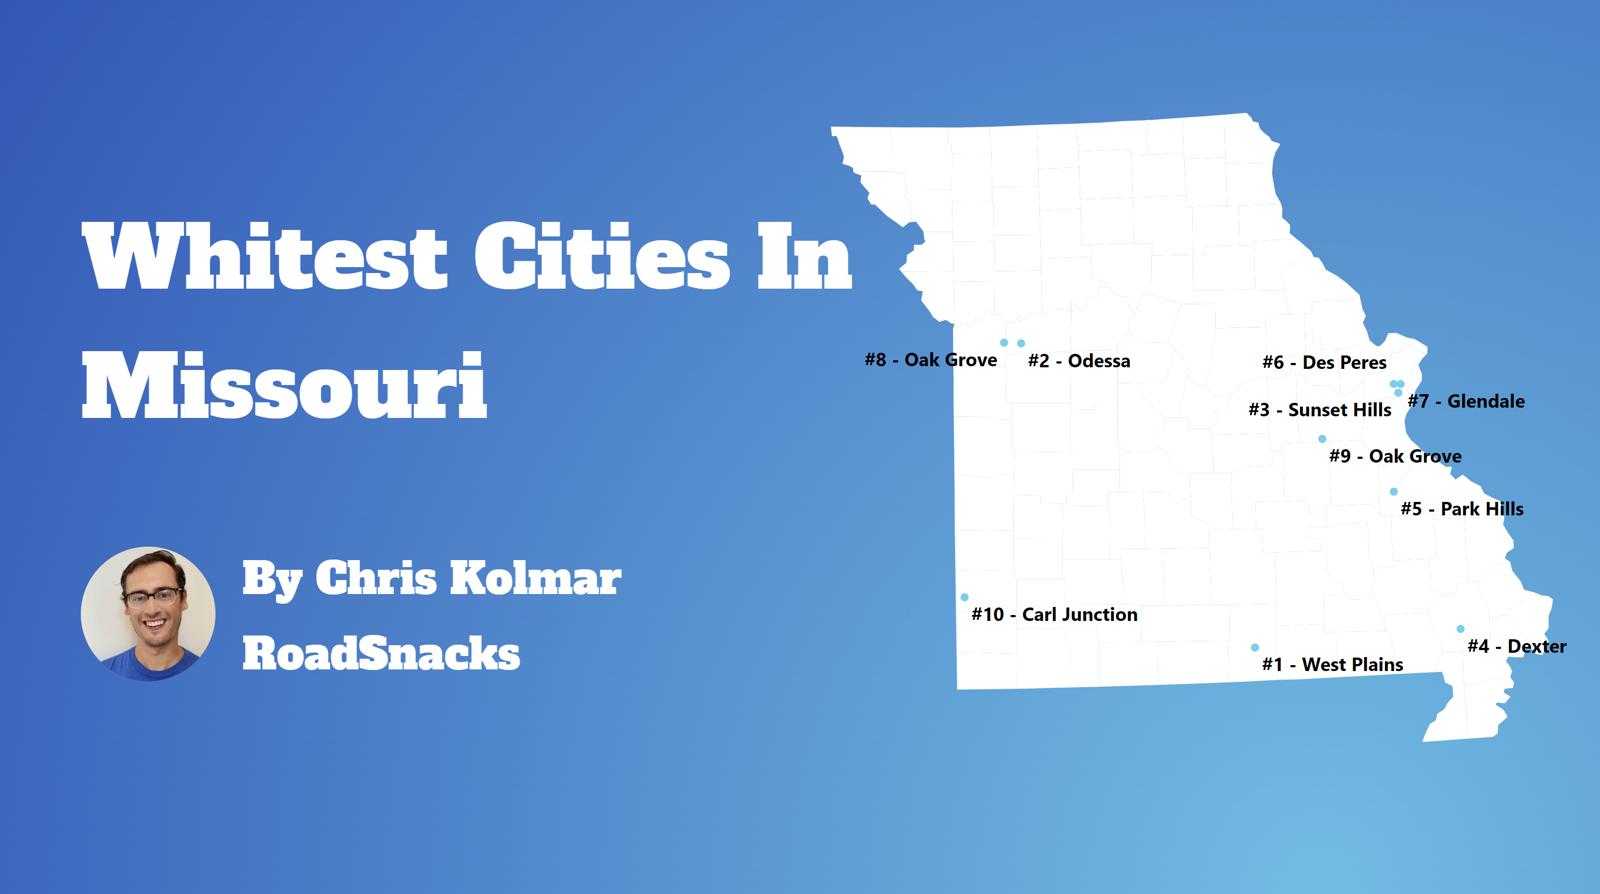
Table Of Contents: Top Ten | Methodology | Summary | Table
Today, we are looking at the whitest places in Missouri. We won’t measure the number of Whole Foods or Pottery Barns per capita. Instead, we’ll focus on the Census data’s report of race by place in Missouri. In particular, we ranked each place in Missouri by the percentage of white people.
So where are the whitest cities you can live in Missouri?
After analyzing cities with populations greater than 5,000, we came up with this list as the whitest cities in Missouri for 2025.
Here are the 10 whites places in Missouri for 2025:
What is the whitest city in Missouri for 2025? According to the most recent census data Odessa ranks as the whitest. If you’re wondering, Jennings is the least white city of all those we measured.
Read on below to see where your hometown ranked and why. Or check out the whitest states in America and the most diverse states in America.
For more Missouri reading, check out:
- Best Places To Raise A Family In Missouri
- Cheapest Places To Live In Missouri
- Worst Places To Live In Missouri
The 10 Whitest Cities In Missouri For 2025
/10
Population: 5,589
% White: 95.67%
More on Odessa: Data

/10
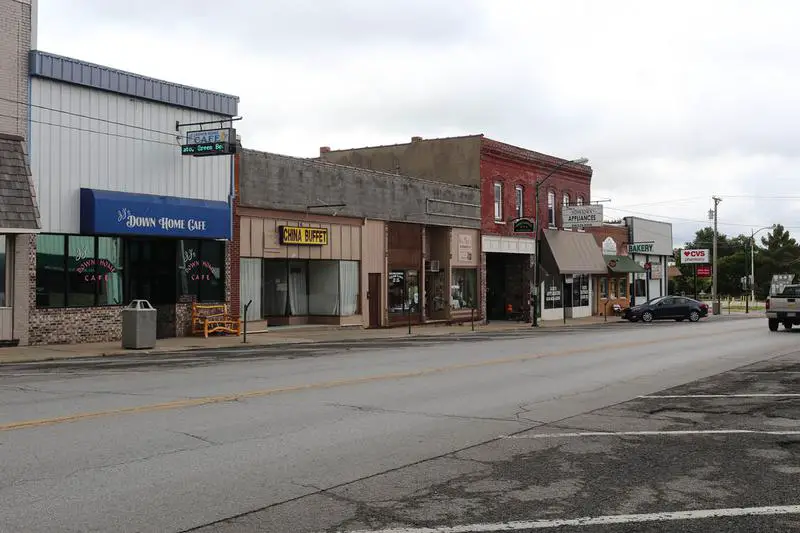
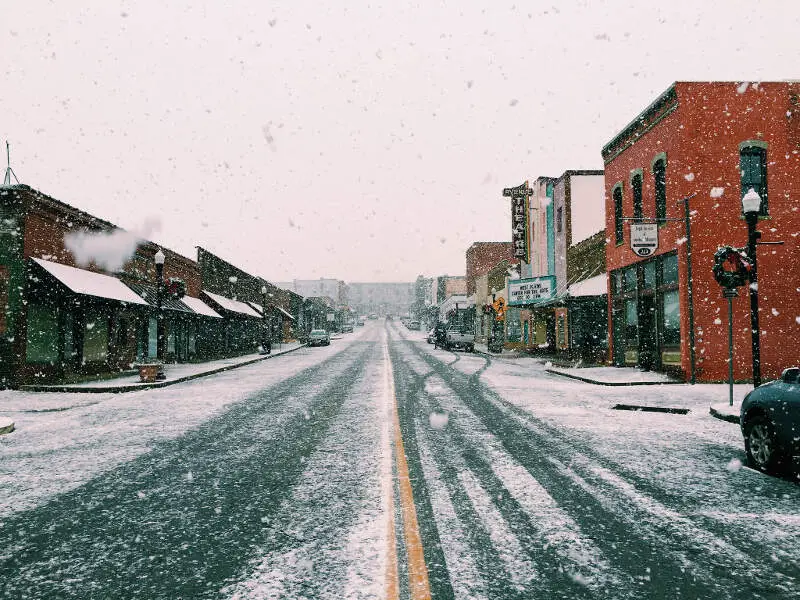
Population: 12,341
% White: 94.98%
More on West Plains: Data

/10
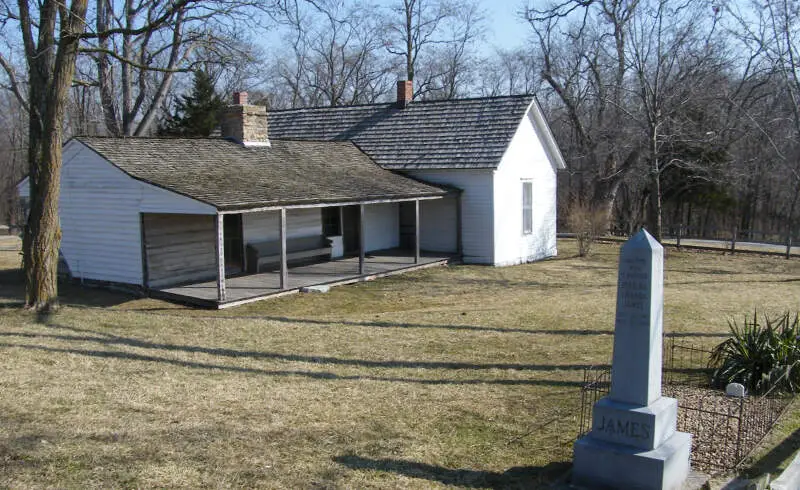
Population: 10,696
% White: 94.97%
More on Kearney: Data

/10
Population: 10,552
% White: 94.11%
More on Smithville: Data

/10
Population: 6,111
% White: 93.93%
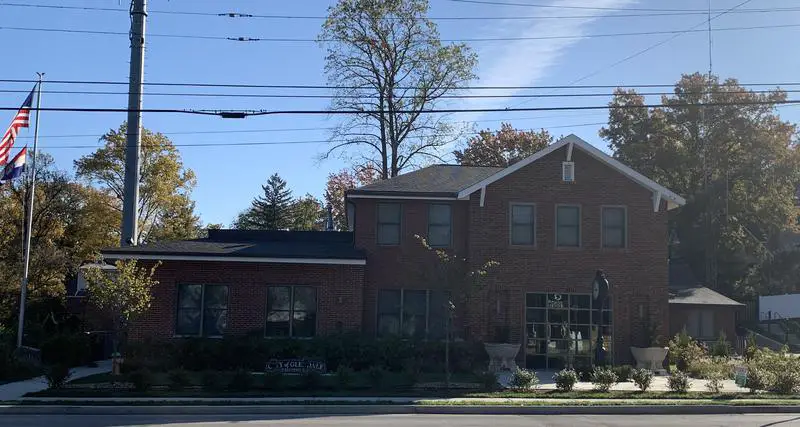
More on Glendale: Data

/10
Population: 8,257
% White: 93.8%
More on Carl Junction: Data

/10
Population: 10,002
% White: 93.67%
More on Harrisonville: Data

/10
Population: 5,979
% White: 92.46%
More on Richmond: Data

/10
Population: 9,113
% White: 92.26%
More on Sunset Hills: Data

/10
Population: 12,298
% White: 92.22%
More on Crestwood: Data
Methodology: How we determined the whitest places in Missouri for 2025
To rank the whitest places in Missouri, we used Saturday Night Science to look at Census demographic data.
We had to look at the number of white people living in each city in Missouri on a per capita basis. In other words, the percentage of white people living in each city in Missouri.
We looked at table B03002: Hispanic OR LATINO ORIGIN BY RACE. Here are the category names as defined by the Census:
- Hispanic or Latino
- White alone*
- Black or African American alone*
- American Indian and Alaska Native alone*
- Asian alone*
- Native Hawaiian and Other Pacific Islander alone*
- Some other race alone*
- Two or more races*
Our particular column of interest here was the number of people who identified as White alone.
We limited our analysis to town with a population greater than 5,000 people. That left us with 121 cities.
We then calculated the percentage of residents that are White. The percentages ranked from 95.7% to 4.6%.
Finally, we ranked each city based on the percentage of White population, with a higher score being more White than a lower score. Odessa took the distinction of being the most White, while Jennings was the least White city.
We updated this article for 2025. This report represents our tenth time ranking the whitest cities in Missouri.
Read on for more information on how the cities in Missouri ranked by population of White residents or, for a more general take on diversity in America, head over to our ranking of the most diverse cities in America.
Summary: White Populations Across Missouri
We measured the locations with the highest percentage of white people in Missouri. According to the most recent data, this list provides accurate information on the whitest places in Missouri.
The most White cities in Missouri are Odessa, West Plains, Kearney, Smithville, Glendale, Carl Junction, Harrisonville, Richmond, Sunset Hills, and Crestwood.
If you’re curious enough, here are the least White places in Missouri:
- Jennings
- Berkeley
- Black Jack
For more Missouri reading, check out:
White Population By City In Missouri
| Rank | City | Population | White Population | % White |
|---|---|---|---|---|
| 1 | Odessa | 5,589 | 5,347 | 95.67% |
| 2 | West Plains | 12,341 | 11,721 | 94.98% |
| 3 | Kearney | 10,696 | 10,158 | 94.97% |
| 4 | Smithville | 10,552 | 9,930 | 94.11% |
| 5 | Glendale | 6,111 | 5,740 | 93.93% |
| 6 | Carl Junction | 8,257 | 7,745 | 93.8% |
| 7 | Harrisonville | 10,002 | 9,369 | 93.67% |
| 8 | Richmond | 5,979 | 5,528 | 92.46% |
| 9 | Sunset Hills | 9,113 | 8,408 | 92.26% |
| 10 | Crestwood | 12,298 | 11,341 | 92.22% |
| 11 | Des Peres | 9,145 | 8,427 | 92.15% |
| 12 | Weldon Spring | 5,291 | 4,872 | 92.08% |
| 13 | Bolivar | 10,996 | 10,123 | 92.06% |
| 14 | Dexter | 7,906 | 7,278 | 92.06% |
| 15 | Troy | 13,467 | 12,361 | 91.79% |
| 16 | Oak Grove | 8,477 | 7,771 | 91.67% |
| 17 | Washington | 14,948 | 13,693 | 91.6% |
| 18 | Clinton | 9,047 | 8,280 | 91.52% |
| 19 | Pevely | 6,037 | 5,477 | 90.72% |
| 20 | Pleasant Hill | 8,853 | 8,003 | 90.4% |
| 21 | Lebanon | 15,157 | 13,639 | 89.98% |
| 22 | Arnold | 20,884 | 18,789 | 89.97% |
| 23 | Farmington | 17,999 | 16,145 | 89.7% |
| 24 | Aurora | 7,331 | 6,565 | 89.55% |
| 25 | Park Hills | 8,667 | 7,753 | 89.45% |
| 26 | Maryville | 10,556 | 9,439 | 89.42% |
| 27 | Nevada | 7,998 | 7,147 | 89.36% |
| 28 | Chillicothe | 9,129 | 8,144 | 89.21% |
| 29 | Battlefield | 6,095 | 5,428 | 89.06% |
| 30 | Trenton | 5,542 | 4,927 | 88.9% |
| 31 | Perryville | 8,530 | 7,554 | 88.56% |
| 32 | Dardenne Prairie | 13,137 | 11,613 | 88.4% |
| 33 | Jackson | 15,532 | 13,670 | 88.01% |
| 34 | Republic | 19,233 | 16,902 | 87.88% |
| 35 | Warrenton | 8,870 | 7,783 | 87.75% |
| 36 | Nixa | 24,131 | 21,133 | 87.58% |
| 37 | Ozark | 21,953 | 19,215 | 87.53% |
| 38 | Macon | 5,457 | 4,756 | 87.15% |
| 39 | Union | 12,560 | 10,907 | 86.84% |
| 40 | Eureka | 12,371 | 10,730 | 86.74% |
| 41 | Lake St. Louis | 17,538 | 15,204 | 86.69% |
| 42 | Sullivan | 6,355 | 5,499 | 86.53% |
| 43 | Ladue | 8,948 | 7,729 | 86.38% |
| 44 | Webb City | 13,139 | 11,340 | 86.31% |
| 45 | Wentzville | 45,734 | 39,389 | 86.13% |
| 46 | Festus | 12,965 | 11,143 | 85.95% |
| 47 | Hannibal | 16,825 | 14,456 | 85.92% |
| 48 | Fulton | 12,611 | 10,824 | 85.83% |
| 49 | Marshfield | 7,599 | 6,489 | 85.39% |
| 50 | Kirksville | 17,493 | 14,862 | 84.96% |
| 51 | St. Peters | 58,200 | 49,385 | 84.85% |
| 52 | De Soto | 6,452 | 5,461 | 84.64% |
| 53 | Grain Valley | 15,967 | 13,488 | 84.47% |
| 54 | Cameron | 8,721 | 7,335 | 84.11% |
| 55 | Mexico | 11,487 | 9,634 | 83.87% |
| 56 | Liberty | 30,446 | 25,526 | 83.84% |
| 57 | Excelsior Springs | 10,502 | 8,707 | 82.91% |
| 58 | Boonville | 7,682 | 6,367 | 82.88% |
| 59 | Springfield | 169,432 | 140,349 | 82.84% |
| 60 | Wildwood | 35,168 | 29,127 | 82.82% |
| 61 | Valley Park | 6,817 | 5,625 | 82.51% |
| 62 | Joplin | 52,218 | 42,841 | 82.04% |
| 63 | Richmond Heights | 9,179 | 7,526 | 81.99% |
| 64 | Moberly | 13,634 | 11,167 | 81.91% |
| 65 | Rolla | 20,144 | 16,474 | 81.78% |
| 66 | Parkville | 8,022 | 6,544 | 81.58% |
| 67 | Kirkwood | 29,302 | 23,891 | 81.53% |
| 68 | O’fallon | 92,697 | 75,454 | 81.4% |
| 69 | Ellisville | 9,908 | 8,060 | 81.35% |
| 70 | Warrensburg | 19,437 | 15,701 | 80.78% |
| 71 | Branson | 12,760 | 10,304 | 80.75% |
| 72 | Webster Groves | 23,771 | 19,167 | 80.63% |
| 73 | Town And Country | 11,605 | 9,320 | 80.31% |
| 74 | Pacific | 7,299 | 5,785 | 79.26% |
| 75 | Brentwood | 8,151 | 6,416 | 78.71% |
| 76 | St. Joseph | 71,542 | 56,265 | 78.65% |
| 77 | Belton | 24,618 | 19,314 | 78.45% |
| 78 | Blue Springs | 59,416 | 46,566 | 78.37% |
| 79 | Poplar Bluff | 16,243 | 12,608 | 77.62% |
| 80 | Lee’s Summit | 102,583 | 79,574 | 77.57% |
| 81 | St. Charles | 71,048 | 55,044 | 77.47% |
| 82 | Raymore | 23,849 | 18,421 | 77.24% |
| 83 | Shrewsbury | 6,328 | 4,837 | 76.44% |
| 84 | Ballwin | 30,835 | 23,538 | 76.34% |
| 85 | Bonne Terre | 6,773 | 5,141 | 75.9% |
| 86 | Cape Girardeau | 40,047 | 29,894 | 74.65% |
| 87 | Sedalia | 21,869 | 16,229 | 74.21% |
| 88 | Kennett | 10,236 | 7,565 | 73.91% |
| 89 | Chesterfield | 49,591 | 36,446 | 73.49% |
| 90 | Gladstone | 27,069 | 19,866 | 73.39% |
| 91 | Manchester | 18,189 | 13,303 | 73.14% |
| 92 | Columbia | 127,200 | 92,225 | 72.5% |
| 93 | Neosho | 12,857 | 9,262 | 72.04% |
| 94 | Maplewood | 8,154 | 5,840 | 71.62% |
| 95 | Jefferson City | 42,565 | 30,310 | 71.21% |
| 96 | Creve Coeur | 18,643 | 13,246 | 71.05% |
| 97 | Independence | 121,944 | 84,342 | 69.16% |
| 98 | Marshall | 13,699 | 9,449 | 68.98% |
| 99 | Clayton | 17,282 | 11,587 | 67.05% |
| 100 | Sikeston | 16,231 | 10,733 | 66.13% |