
Whitest cities in Oregon research summary. We analyzed Oregon’s most recent Census data to determine the whitest cities in Oregon based on the percentage of White residents. Here are the results of our analysis:
-
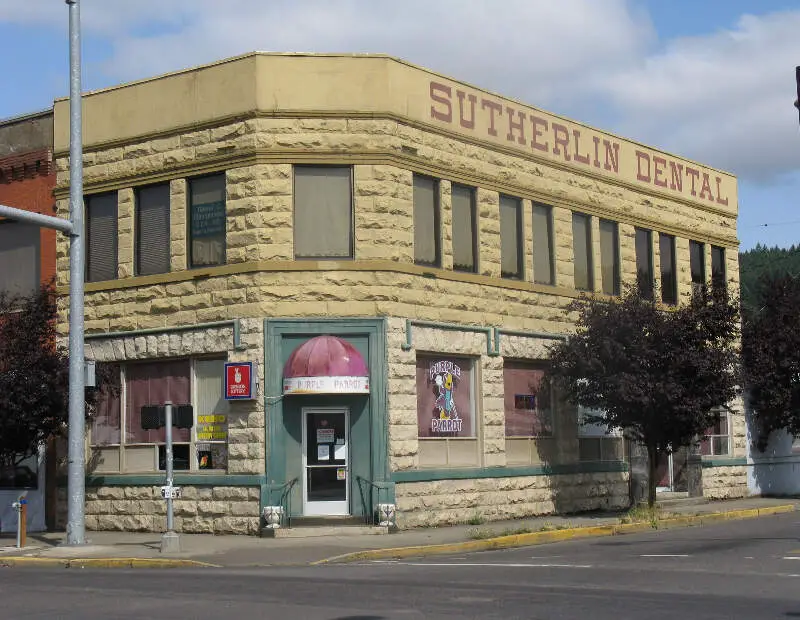
The whitest city in Oregon is Sutherlin based on the most recent Census data.
-
Sutherlin is 91.51% White.
-
The least White city in Oregon is Woodburn.
-
Woodburn is 32.84% White.
-
Oregon is 72.3% White.
-
Oregon is the 22nd Whitest state in the United States.
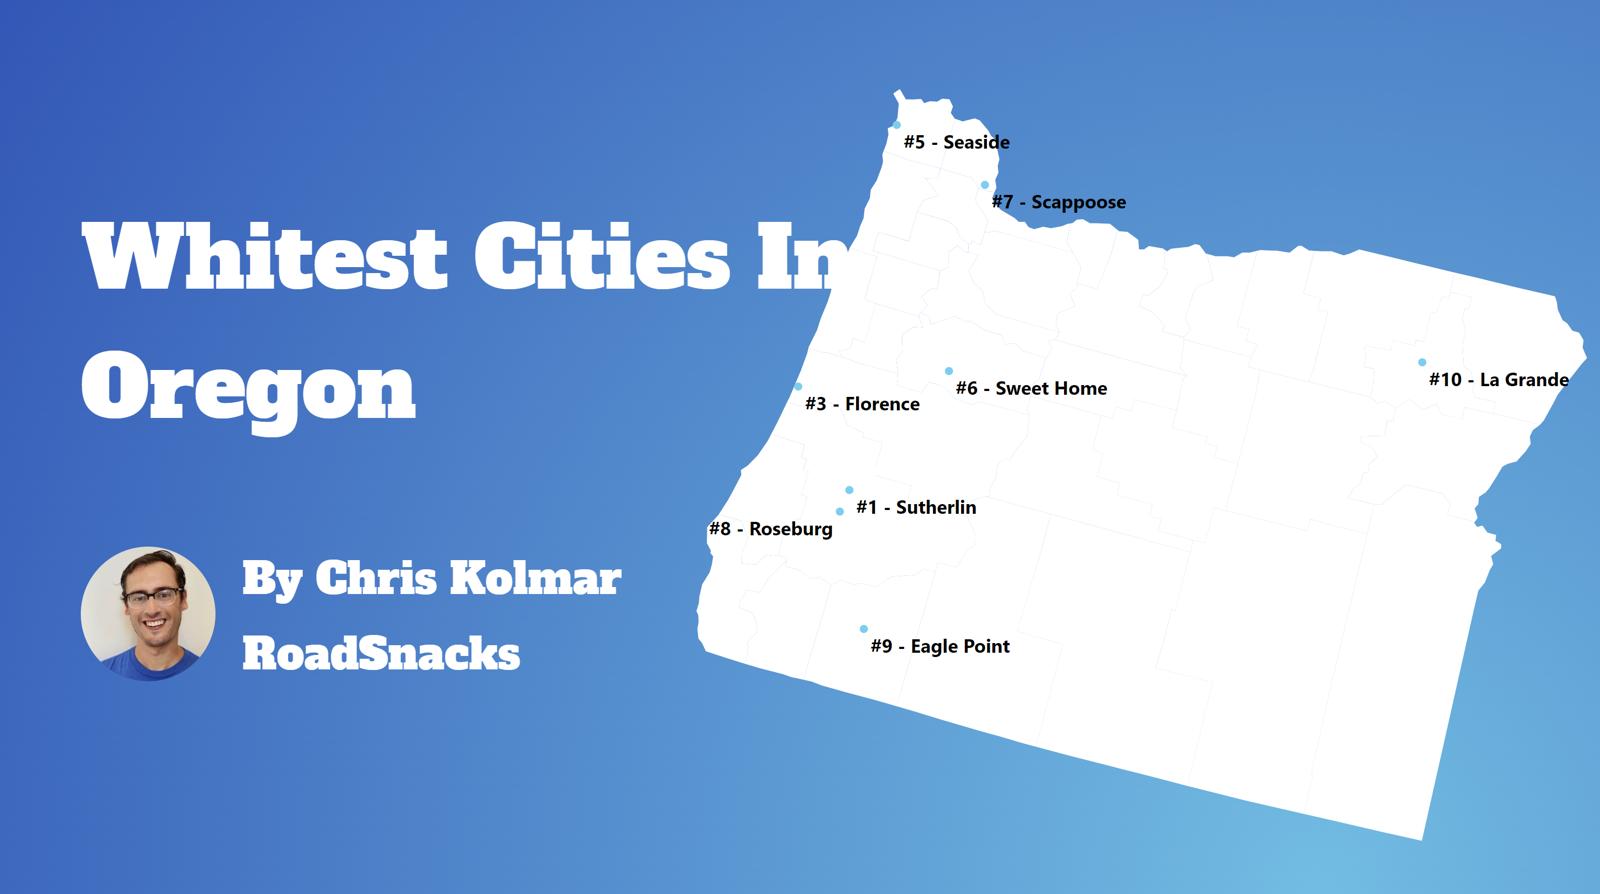
Table Of Contents: Top Ten | Methodology | Summary | Table
Today, we are looking at the whitest places in Oregon. We won’t measure the number of Whole Foods or Pottery Barns per capita. Instead, we’ll focus on the Census data’s report of race by place in Oregon. In particular, we ranked each place in Oregon by the percentage of white people.
So where are the whitest cities you can live in Oregon?
After analyzing cities with populations greater than 5,000, we came up with this list as the whitest cities in Oregon for 2025.
Here are the 10 whites places in Oregon for 2025:
What is the whitest city in Oregon for 2025? According to the most recent census data Sutherlin ranks as the whitest. If you’re wondering, Woodburn is the least white city of all those we measured.
Read on below to see where your hometown ranked and why. Or check out the whitest states in America and the most diverse states in America.
For more Oregon reading, check out:
The 10 Whitest Cities In Oregon For 2025

/10
Population: 8,574
% White: 91.51%
More on Sutherlin: Data

/10
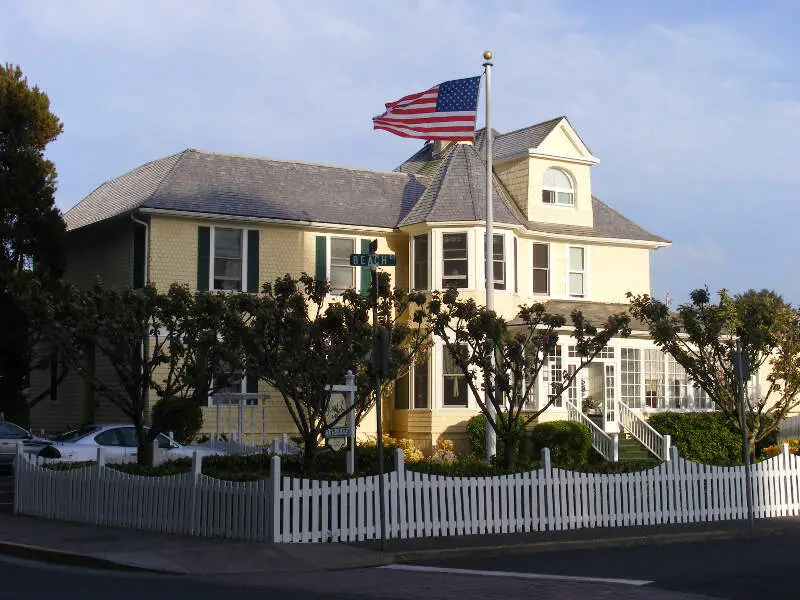
Population: 7,210
% White: 89.75%
More on Seaside: Data
/10
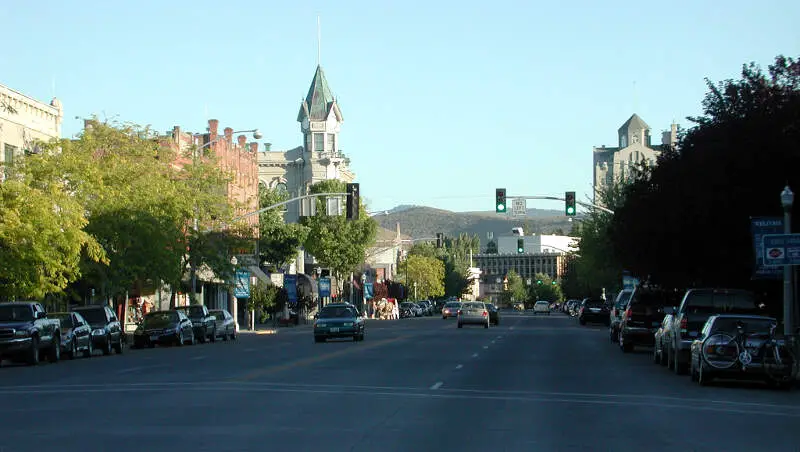
Population: 10,177
% White: 89.48%
More on Baker City: Data

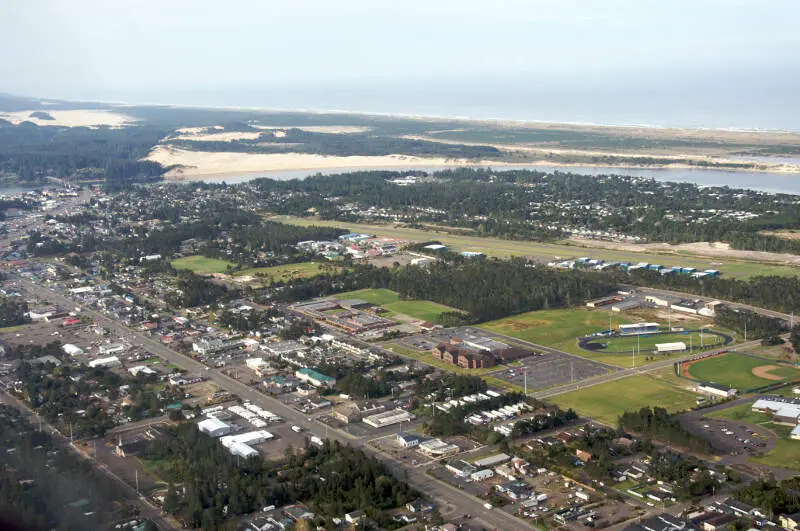
/10
Population: 9,483
% White: 88.26%
More on Florence: Data
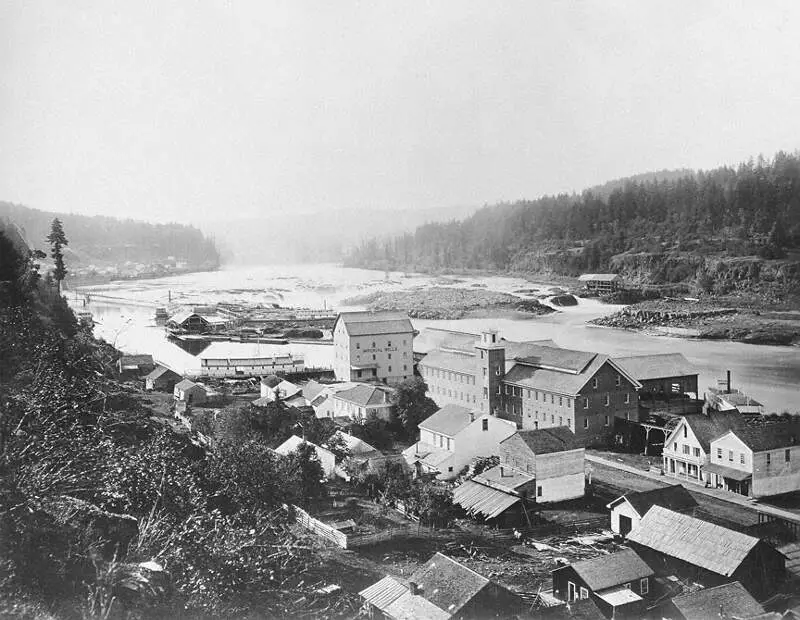
/10
Population: 37,482
% White: 86.04%
More on Oregon City: Data


/10
Population: 10,168
% White: 85.12%
More on Molalla: Data

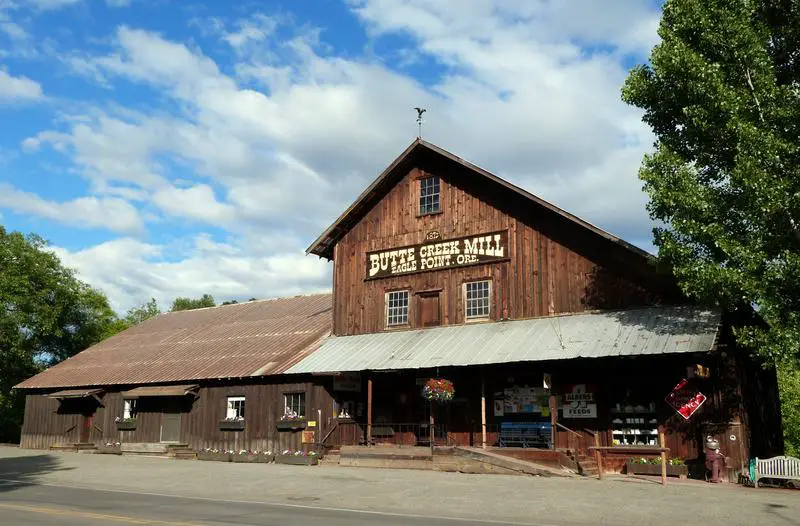
/10
Population: 9,783
% White: 85.05%
More on Eagle Point: Data

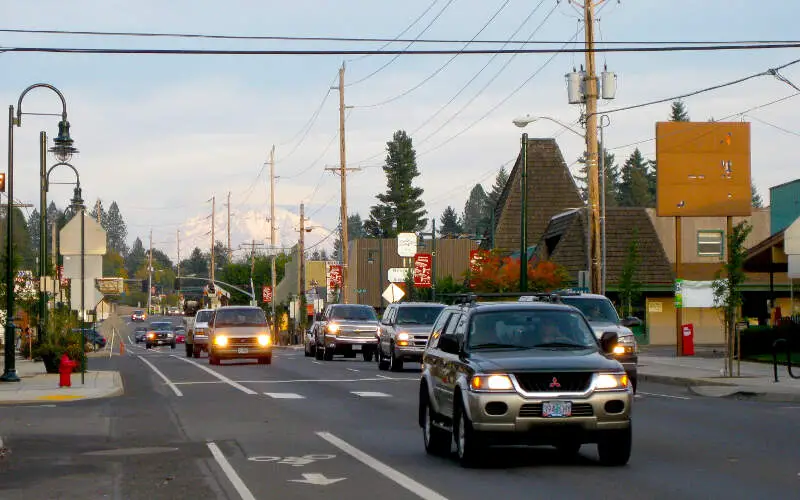
/10
Population: 12,738
% White: 84.93%
More on Sandy: Data

/10
Population: 23,773
% White: 84.75%
More on Roseburg: Data

/10
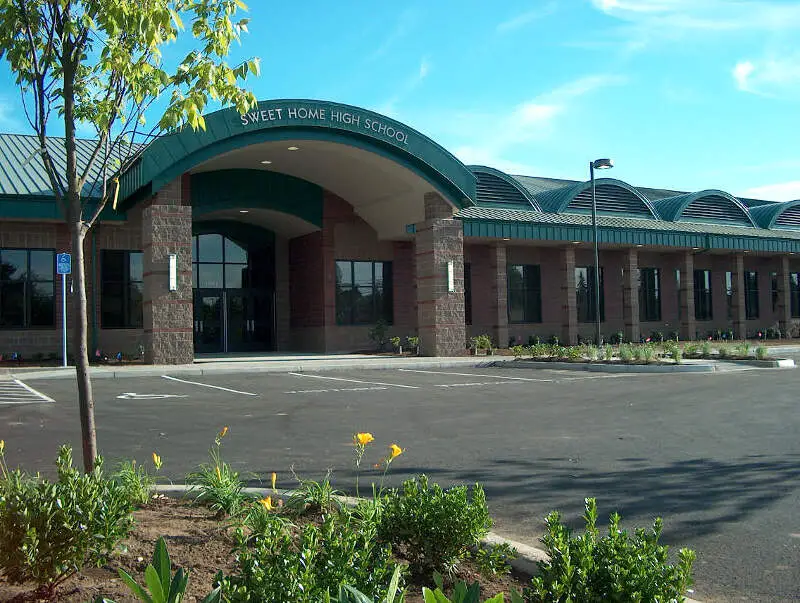
Population: 9,977
% White: 84.39%
More on Sweet Home: Data
Methodology: How we determined the whitest places in Oregon for 2025
To rank the whitest places in Oregon, we used Saturday Night Science to look at Census demographic data.
We had to look at the number of white people living in each city in Oregon on a per capita basis. In other words, the percentage of white people living in each city in Oregon.
We looked at table B03002: Hispanic OR LATINO ORIGIN BY RACE. Here are the category names as defined by the Census:
- Hispanic or Latino
- White alone*
- Black or African American alone*
- American Indian and Alaska Native alone*
- Asian alone*
- Native Hawaiian and Other Pacific Islander alone*
- Some other race alone*
- Two or more races*
Our particular column of interest here was the number of people who identified as White alone.
We limited our analysis to town with a population greater than 5,000 people. That left us with 73 cities.
We then calculated the percentage of residents that are White. The percentages ranked from 91.5% to 32.8%.
Finally, we ranked each city based on the percentage of White population, with a higher score being more White than a lower score. Sutherlin took the distinction of being the most White, while Woodburn was the least White city.
We updated this article for 2025. This report represents our tenth time ranking the whitest cities in Oregon.
Read on for more information on how the cities in Oregon ranked by population of White residents or, for a more general take on diversity in America, head over to our ranking of the most diverse cities in America.
Summary: White Populations Across Oregon
We measured the locations with the highest percentage of white people in Oregon. According to the most recent data, this list provides accurate information on the whitest places in Oregon.
The most White cities in Oregon are Sutherlin, Seaside, Baker City, Florence, Oregon City, Molalla, Eagle Point, Sandy, Roseburg, and Sweet Home.
If you’re curious enough, here are the least White places in Oregon:
- Woodburn
- Hermiston
- Cornelius
For more Oregon reading, check out:
White Population By City In Oregon
| Rank | City | Population | White Population | % White |
|---|---|---|---|---|
| 1 | Sutherlin | 8,574 | 7,846 | 91.51% |
| 2 | Seaside | 7,210 | 6,471 | 89.75% |
| 3 | Baker City | 10,177 | 9,106 | 89.48% |
| 4 | Florence | 9,483 | 8,370 | 88.26% |
| 5 | Oregon City | 37,482 | 32,249 | 86.04% |
| 6 | Molalla | 10,168 | 8,655 | 85.12% |
| 7 | Eagle Point | 9,783 | 8,320 | 85.05% |
| 8 | Sandy | 12,738 | 10,818 | 84.93% |
| 9 | Roseburg | 23,773 | 20,148 | 84.75% |
| 10 | Sweet Home | 9,977 | 8,420 | 84.39% |
| 11 | Lebanon | 18,978 | 15,935 | 83.97% |
| 12 | La Grande | 13,059 | 10,950 | 83.85% |
| 13 | Junction City | 6,926 | 5,774 | 83.37% |
| 14 | Bend | 101,472 | 84,471 | 83.25% |
| 15 | Coos Bay | 15,867 | 13,111 | 82.63% |
| 16 | Prineville | 11,187 | 9,205 | 82.28% |
| 17 | Scappoose | 8,099 | 6,647 | 82.07% |
| 18 | Ashland | 21,343 | 17,479 | 81.9% |
| 19 | Grants Pass | 39,183 | 32,005 | 81.68% |
| 20 | St. Helens | 14,152 | 11,559 | 81.68% |
| 21 | Brookings | 6,733 | 5,495 | 81.61% |
| 22 | West Linn | 27,065 | 21,851 | 80.74% |
| 23 | Dallas | 17,214 | 13,730 | 79.76% |
| 24 | Redmond | 35,161 | 28,023 | 79.7% |
| 25 | Cottage Grove | 10,630 | 8,334 | 78.4% |
| 26 | Sherwood | 20,227 | 15,826 | 78.24% |
| 27 | Pendleton | 17,070 | 13,327 | 78.07% |
| 28 | Lake Oswego | 40,367 | 31,461 | 77.94% |
| 29 | North Bend | 10,231 | 7,874 | 76.96% |
| 30 | Talent | 6,271 | 4,825 | 76.94% |
| 31 | Gladstone | 11,986 | 9,206 | 76.81% |
| 32 | Albany | 56,773 | 43,549 | 76.71% |
| 33 | Silverton | 10,445 | 7,958 | 76.19% |
| 34 | Lincoln City | 9,890 | 7,514 | 75.98% |
| 35 | Milwaukie | 21,256 | 16,108 | 75.78% |
| 36 | Eugene | 177,520 | 133,828 | 75.39% |
| 37 | Newport | 10,393 | 7,828 | 75.32% |
| 38 | Springfield | 61,642 | 46,408 | 75.29% |
| 39 | Astoria | 10,162 | 7,641 | 75.19% |
| 40 | Canby | 18,103 | 13,585 | 75.04% |
| 41 | Medford | 85,794 | 64,109 | 74.72% |
| 42 | Winston | 5,663 | 4,219 | 74.5% |
| 43 | Monmouth | 11,176 | 8,303 | 74.29% |
| 44 | Corvallis | 60,424 | 44,424 | 73.52% |
| 45 | Newberg | 25,622 | 18,821 | 73.46% |
| 46 | Central Point | 19,183 | 13,998 | 72.97% |
| 47 | Stayton | 8,223 | 5,996 | 72.92% |
| 48 | The Dalles | 15,973 | 11,479 | 71.87% |
| 49 | Klamath Falls | 21,879 | 15,537 | 71.01% |
| 50 | Mcminnville | 34,493 | 24,470 | 70.94% |
| 51 | Sheridan | 6,462 | 4,569 | 70.71% |
| 52 | Wilsonville | 26,183 | 18,411 | 70.32% |
| 53 | Tigard | 55,395 | 38,075 | 68.73% |
| 54 | Troutdale | 16,000 | 10,871 | 67.94% |
| 55 | Keizer | 39,013 | 26,326 | 67.48% |
| 56 | Portland | 642,715 | 430,596 | 67.0% |
| 57 | Tualatin | 27,710 | 17,899 | 64.59% |
| 58 | Hood River | 8,360 | 5,383 | 64.39% |
| 59 | Salem | 176,666 | 112,909 | 63.91% |
| 60 | Happy Valley | 25,572 | 15,982 | 62.5% |
| 61 | Gresham | 112,818 | 69,091 | 61.24% |
| 62 | Forest Grove | 26,406 | 15,980 | 60.52% |
| 63 | Beaverton | 97,502 | 58,772 | 60.28% |
| 64 | Independence | 10,088 | 5,496 | 54.48% |
| 65 | Umatilla | 7,531 | 4,064 | 53.96% |
| 66 | Milton-Freewater | 7,096 | 3,741 | 52.72% |
| 67 | Hillsboro | 107,050 | 56,122 | 52.43% |
| 68 | Fairview | 10,627 | 5,329 | 50.15% |
| 69 | Ontario | 11,728 | 5,873 | 50.08% |
| 70 | Madras | 7,596 | 3,288 | 43.29% |
| 71 | Cornelius | 13,700 | 5,725 | 41.79% |
| 72 | Hermiston | 19,406 | 8,044 | 41.45% |
| 73 | Woodburn | 26,845 | 8,815 | 32.84% |