
Columbus’s neighborhoods conjure up too many stereotypes to count. You’ve got hipster areas, preppy places, neighborhoods where college kids thrive, and of course, ghettos.
It seems as if there’s a neighborhood for everyone in Columbus.
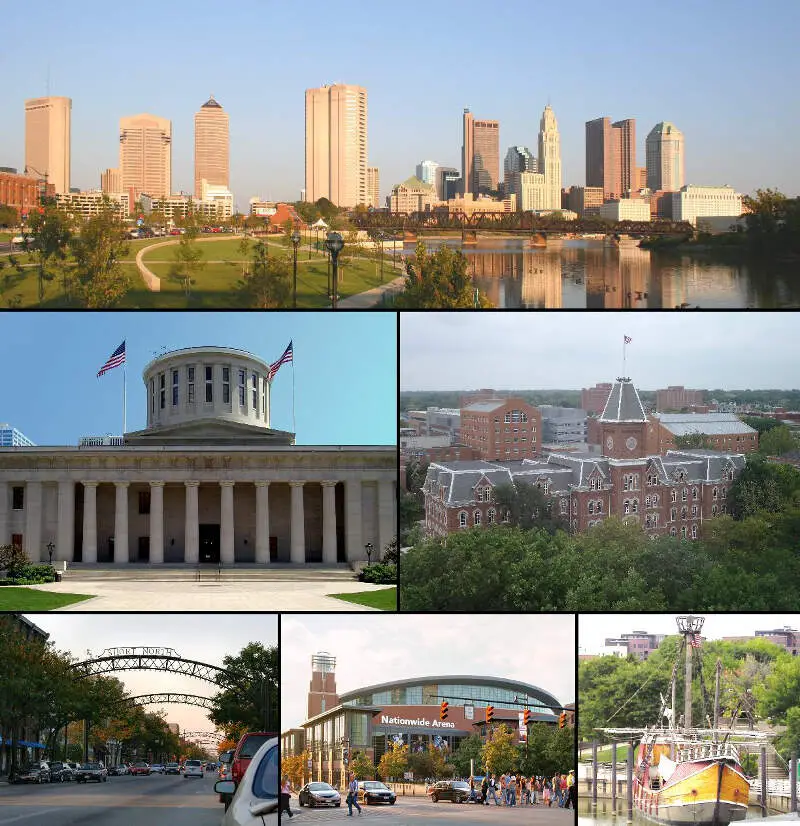
And while the city consistently ranks as one of the best places to live in Ohio thanks in part to tons of entertainment and jobs, it’s not all rainbows and sunshine in Columbus. Some neighborhoods aren’t as safe as others.
So the question arises, which Columbus neighborhoods are the most dangerous and which are the safest?
Today, we’ll use Saturday Night Science to determine which Columbus hoods need a little tender loving care – the sore thumbs of the Columbus area if you will. Realistically, you can’t expect all the neighborhoods to be amazing, although Harrison West ranks way above the rest.
We examined 39 of Columbus’s neighborhoods to find out the most dangerous places to live. These places don’t quite measure up to Columbus’s reputation.
Table Of Contents: Top 10 | Methodology | Summary | Table
So what’s the worst neighborhood to live in Columbus for 2025? According to the most recent census data, Milo Grogan looks to be the worst neighborhood in Columbus.
Read on to see how we determined the places around Columbus that need a pick-me-up. And remember, don’t blame the messenger.
For more Ohio reading, check out:
The 10 Most Dangerous Neighborhoods In Columbus For 2025
1. Milo Grogan
/10
Population: 1,513
Violent Crimes Per 100k: 814
Property Crime Per 100k: 4,586
Median Home Value: $76,300 (10th worst)
Median Income: $24,311 (3rd worst)
2. Fort Columbus Airport
/10
Population: 3,184
Violent Crimes Per 100k: 883
Property Crime Per 100k: 4,972
Median Home Value: $31,675 (2nd worst)
Median Income: $28,221 (5th worst)
3. Olentangy River Road
/10
Population: 3,967
Violent Crimes Per 100k: 880
Property Crime Per 100k: 4,959
Median Home Value: $28,529 (worst)
Median Income: $23,333 (worst)
4. Tri-South
/10
Population: 4,051
Violent Crimes Per 100k: 750
Property Crime Per 100k: 4,226
Median Home Value: $65,500 (6th worst)
Median Income: $33,916 (11th worst)
5. South Linden
/10
Population: 9,828
Violent Crimes Per 100k: 867
Property Crime Per 100k: 4,886
Median Home Value: $64,136 (4th worst)
Median Income: $26,075 (4th worst)
6. North Central
/10
Population: 9,534
Violent Crimes Per 100k: 803
Property Crime Per 100k: 4,526
Median Home Value: $64,230 (5th worst)
Median Income: $31,482 (8th worst)
7. Near Southside
/10
Population: 16,697
Violent Crimes Per 100k: 814
Property Crime Per 100k: 4,588
Median Home Value: $58,285 (3rd worst)
Median Income: $29,952 (7th worst)
8. South Side
/10
Population: 14,750
Violent Crimes Per 100k: 751
Property Crime Per 100k: 4,233
Median Home Value: $75,823 (9th worst)
Median Income: $33,791 (10th worst)
9. Franklinton

/10
Population: 8,060
Violent Crimes Per 100k: 889
Property Crime Per 100k: 5,009
Median Home Value: $74,150 (7th worst)
Median Income: $24,247 (2nd worst)
10. South Alum Creek
/10
Population: 4,981
Violent Crimes Per 100k: 695
Property Crime Per 100k: 3,913
Median Home Value: $95,450 (19th worst)
Median Income: $49,726 (20th worst)
Methodology: How we determined the most dangerous Columbus neighborhoods in 2025
To figure out how bad a place is to live in, we only needed to know what kinds of things people like and then decide what places have the least amount of those things. We plugged the following criteria into Saturday Night Science to get the worst neighborhoods in Columbus:
- High crime (Estimated)
- High unemployment (Less jobs)
- Low median income (Less pay)
- Low population density (No things to do)
- Low home values (No one’s willing to pay to live here)
Then, we ranked each neighborhood in Columbus, Ohio for each of these criteria from worst to best.
Next, we averaged the individual rankings for each criterion into a “Worst Score.”
The neighborhood with the lowest “Worst Score” ranks as the most dangerous neighborhood of Columbus.
The article is an opinion based on facts and is meant as infotainment. We updated this article for 2025. This report is our time ranking the worst neighborhoods to live in Columbus.
Skip to the end to see the list of all 39 neighborhoods ranked from worst to best.
Summary: The Worst Neighborhoods Around Columbus
Well, there you have it — the worst of the neighborhoods in Columbus with Milo Grogan landing at the bottom of the pack.
The worst neighborhoods in Columbus are Milo Grogan, Fort Columbus Airport, Olentangy River Road, Tri-South, South Linden, North Central, Near Southside, South Side, Franklinton, and South Alum Creek.
As mentioned earlier, the neighborhoods in Columbus aren’t all bad. Harrison West takes the cake as the best place to live in Columbus.
The best neighborhoods in Columbus are Harrison West, Bexley, Clintonville, Upper Arlington, and Victorican Village.
We ranked the neighborhoods from worst to best in the chart below.
For more Ohio reading, check out:
Most Dangerous Neighborhoods To Live In Columbus For 2025?
| Rank | Neighborhood | Population | Home Value | Median Income |
|---|---|---|---|---|
| 1 | Milo Grogan | 1,513 | $76,300 | $24,311 |
| 2 | Fort Columbus Airport | 3,184 | $31,675 | $28,221 |
| 3 | Olentangy River Road | 3,967 | $28,529 | $23,333 |
| 4 | Tri-South | 4,051 | $65,500 | $33,916 |
| 5 | South Linden | 9,828 | $64,136 | $26,075 |
| 6 | North Central | 9,534 | $64,230 | $31,482 |
| 7 | Near Southside | 16,697 | $58,285 | $29,952 |
| 8 | South Side | 14,750 | $75,823 | $33,791 |
| 9 | Franklinton | 8,060 | $74,150 | $24,247 |
| 10 | South Alum Creek | 4,981 | $95,450 | $49,726 |
| 11 | Far South | 13,301 | $78,615 | $39,897 |
| 12 | Northeast | 29,406 | $81,032 | $34,150 |
| 13 | Whitehall | 18,878 | $77,695 | $39,753 |
| 14 | Greater Hilltop | 65,257 | $74,258 | $37,375 |
| 15 | South Central Accord | 2,511 | $151,800 | $53,556 |
| 16 | University | 35,689 | $77,338 | $28,806 |
| 17 | Near East | 17,159 | $93,138 | $32,468 |
| 18 | Southeast | 2,922 | $88,860 | $47,200 |
| 19 | North Linden | 30,894 | $86,266 | $40,367 |
| 20 | Westland | 36,756 | $113,830 | $49,688 |
| 21 | Southwest | 8,116 | $86,075 | $55,392 |
| 22 | Southside | 15,464 | $99,115 | $53,356 |
| 23 | Brice-Tussing | 27,035 | $113,760 | $51,585 |
| 24 | Weinland Park | 4,287 | $243,900 | $41,409 |
| 25 | Northland | 122,528 | $123,442 | $54,666 |
| 26 | Mckinley Avenue Corridor | 5,558 | $129,933 | $50,635 |
| 27 | West Columbus Interim | 53,633 | $162,432 | $72,645 |
| 28 | Far North | 33,986 | $189,350 | $77,465 |
| 29 | Rocky-Fork Blacklick Accord | 8,709 | $186,386 | $80,400 |
| 30 | Downtown | 7,097 | $245,240 | $58,670 |
| 31 | Northwest | 79,502 | $176,663 | $71,352 |
| 32 | Worthington | 14,074 | $235,220 | $87,419 |
| 33 | Brewery | 1,967 | $331,050 | $75,120 |
| 34 | Italian Village | 3,530 | $320,000 | $72,750 |
| 35 | Victorican Village | 3,989 | $264,575 | $69,438 |
| 36 | Upper Arlington | 43,520 | $335,316 | $102,607 |
| 37 | Clintonville | 9,039 | $270,860 | $87,515 |
| 38 | Bexley | 13,485 | $337,683 | $114,868 |
| 39 | Harrison West | 3,364 | $394,425 | $93,488 |
I think this list is asinine and classist. Or is this list so you push the poor and or people of color out to make the “hood”cool. You know like what happened with Victorian Village and Short North. Hold out concern,care and resources until the rich youth start to live there.
Do you just mean the ten neighborhoods gentrifiers haven’t managed to kick black folk out of?
There is no Fort Columbus Airport. There is a PORT Columbus Airport. Also, what is the difference between the South Side which is listed at #6, and the Southside which is listed at #36?
North Linden between Weber and Hudson is a bombed out ghetto worthy of Detroit status. They should rename Cleveland Ave as Martin Luther King Blvd there. And Weber should be renamed Rosa Parks Ave. You know you’re in a bad neighborhood when you have a mosque across from a Caribbean Kitchen, and everything else is boarded up because of the bullet holes. Our own little East St Louis.
Damn you are one sick individual dude.. But with a name like Donald Trump says it all.. Come and stop by have a plate of the best Caribbean food Columbus has to offer. And come an enjoy the beautiful souls that are at Madrid sahaba before you write us off my friend, I promise you would have a change of heart. My name is Hamsa and I invite you to the “ghetto”. I promise it wont disappoint once you see the great people that call this side of town home. Peace and love my friend!!!
I got offered cocaine from a stranger on the street as I waited at a traffic light. Take off your rose-colored glasses dude and stop glossing over the problems that exist there. I grew up in poor neighborhoods like that so don’t you dare tell me I can’t relate.
many people are way quick to judge. although the bullet holes (unless he exaggerated) would sort of be an issue.
This is hilarious. I Love it. Because due to depression and poor planning. I now live. In the ghetto south side of Columbus.
Franklinton has began to get better while areas like northwest columbus and whitehall have gotten worse. Almost all neighborhoods in columbus tend to go up and down most dont stay ghetto like german village used to be considered slums and now its considered one of the best neighborhoods.
Columbus east-side is the worst, pound for pound, in murders, crime, and just over negrosity. The north side (161 to Shrock Rd) has been overtaken by section 8 and the trash that came with it.
“Negrosity” Wow really are you serious right now? Like this article has showed me some really really sad people do live in Columbus. Look this city is beautiful and among one of the best places to live in the world and I am happy to call it home. But I see you are in sad man. I hope you will get thru what ever you are going thru and I will pray for you my friend because what you said says a whole lot about what can of person you are and you are hurt so I will pray for you. Get well soon buddy….
its called ignorance…. some people have no upbringing. I grew up in Columbus and now currently live in the southeastern part of the United States. People from both races where I live get along and we do not have the racial problems that one would think being as it is a “southern” town. It amazes me how I ran into more prejudice up north than I have down south.
Also, those are not photos of anywhere in Columbus. Palm trees? Mountains?
The worst place to go at night is easily Livingston Ave in the summer at night. Be alone, any color, look like you have something, and you will get stomped. Forget neighborhoods, streets wise? Livingston at night in the summer. Worst part is South Park apartments. Be white, dont know anyone, dare you.
Does anyone have tips for someone moving to Columbus from out of state? We are being relocated for work. I have 2 young children so I’m not looking to be near the slum areas but not looking for hatred and bigotry either. Is there a happy medium??
I grew up in what they call the Short North and Victorian Village area now. I went to Hubbard Elementary, Everett Jr High and Central and guess what I was a poor white kid. I saw alot! And yes they have cleaned up the buildings. Sandy Woods
was a smart man. He saw the opportunity to make a lot money on a area that had lost its life,
Its funny I drive down there now and I have to laugh thinking about what people are paying to
Live there. Still drunks, gays, prostitutes. Just people with more money that brains.
what side of town is richmond road or monarche green community? 43223
From out of town family: low budget ($750 per month) north Linden north of Huy. High budget – Upper Arlington, Hilliard, Dublin, Grove City. Diversity – Clintonville and German Village (also high budget). Wanting open mind – Avoid Bottoms, Hilltop, Parsons Ave.
If you are working for a larger company, ask for advice before you pick a neighborhood. There are edge cases. If kids are K-12 age, go high budget if possible.
Thank you for this list. I’m considering a move to Columbus and am looking for potential locations. Like the OP for this question, I want a diverse neighborhood, but one that is safe as I live alone. I appreciate the guidance. (And yes, I will also be checking with my employer) Thanks again.
Look at the school district “Hamilton meadows” in Columbus or it may be obetz not sure. It used to be fairly good although all areas are plagued with drugs now. It knows no socioeconomic factor. You definitely do not want to be around kids who drive nicer cars to school than you could ever afford to own in your wildest dreams. Those kids tend to make less affluent children feel insignificant. Same with some of the private schools. Look up the public report of the schools and see the makeup of the scores the children get on their tests and also you can make sure it is adequately diversified so your children receive a well rounded education and are not learning prejudices or snotty attitudes towards others. My goal was to always have children who were accepting and tolerant of all people, yet still had the morals we instilled in them. There are many different religions and ethnic people in Columbus. It is a beautiful city
WHAT ABOUT GAHANNA?.l grew up there in the late 60′ s and early 70’s and it’s still a great place. More businesses. More housing. More apts. But boy did me and my friends love growing up there!! Yesss!
I’ve worked in Columbus most of my life, although I come from a small community in Union County, I finally moved to Columbus 2 weeks ago boys wanted to move here it’s got everything I always considered Columbus my hometown. Live in the Linden area as long as you get along with different types of people mind your business not prejudiced racist we should have no problems if we all work together things boys seem to be more smooth, I did 9 years in prison 15 years ago now I work an live an honest life, love Columbus Ohio go Buckeyes.
If you have the money, try living in one of the suburbs that are just outside of Columbus or surrounded by it, like Gahanna, Reynoldsburg, Pickerington, Lewis Center, Powell, etc. Most people are going to find Bexley out of their price range. Neighborhoods do change. German Village used to be a ghetto; now it’s filled with very high priced homes. Whitehall used to be family friendly; now it’s a horrible place to live, yet it’s adjacent to Bexley. All larger cities have their good and bad sections and those sections have their good and bad points. You’ll find great people in Franklinton and bad people and crime in Bexley. But overall, Columbus is a great place to live with a lot to see and do. It’s affordable, and is quickly becoming the IT mecca of the Midwest and Great Lakes regions. It has many parks and places of interest. It has many beautiful homes, and housing is affordable. Crime is lower than in cities half its size. Food is affordable. OSU is there. The Gallery of Fine Art. The Center of Science and Industry. I think the Ohio State Fair is the second largest in the country. Just choose your location carefully. Columbus has a great relationship with its very good police force. The worst thing about Columbus is the weather. Very cold in the long winters, and very hot and humid in the equally long summers. Very changeable weather, too. But better than droughts, earthquakes, and hurricanes!