
Gayest places in California research summary. We used Saturday Night Science to research the cities in California with the highest percent of same-sex households for 2026. The data comes from the American Community Survey 2020-2024 5-year vintage, which counts same-sex married spouses and same-sex unmarried partners at the city level.
-
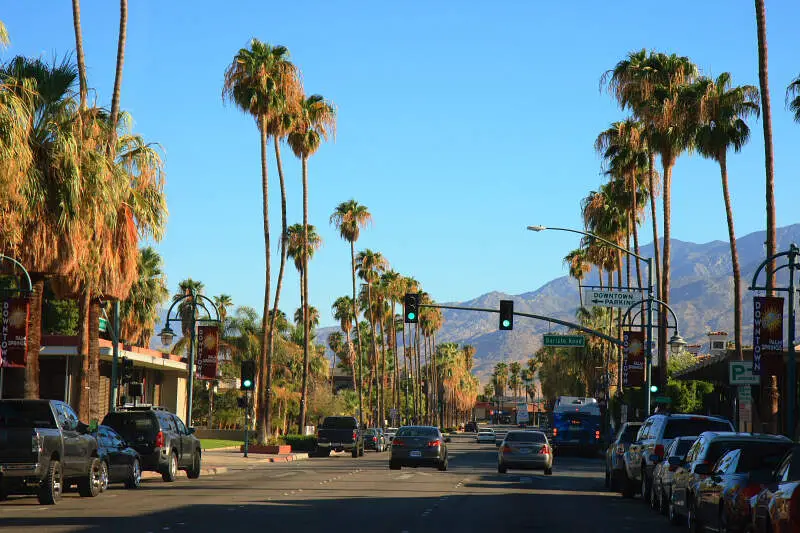
The city with the highest rate of same-sex houesholds in California is Palm Springs. 16.71% of households in Palm Springs are gay.
-
The city in California with the most same-sex houesholds is Los Angeles with 22,148 gay households.
-
California is the 9th most gay in the United States.
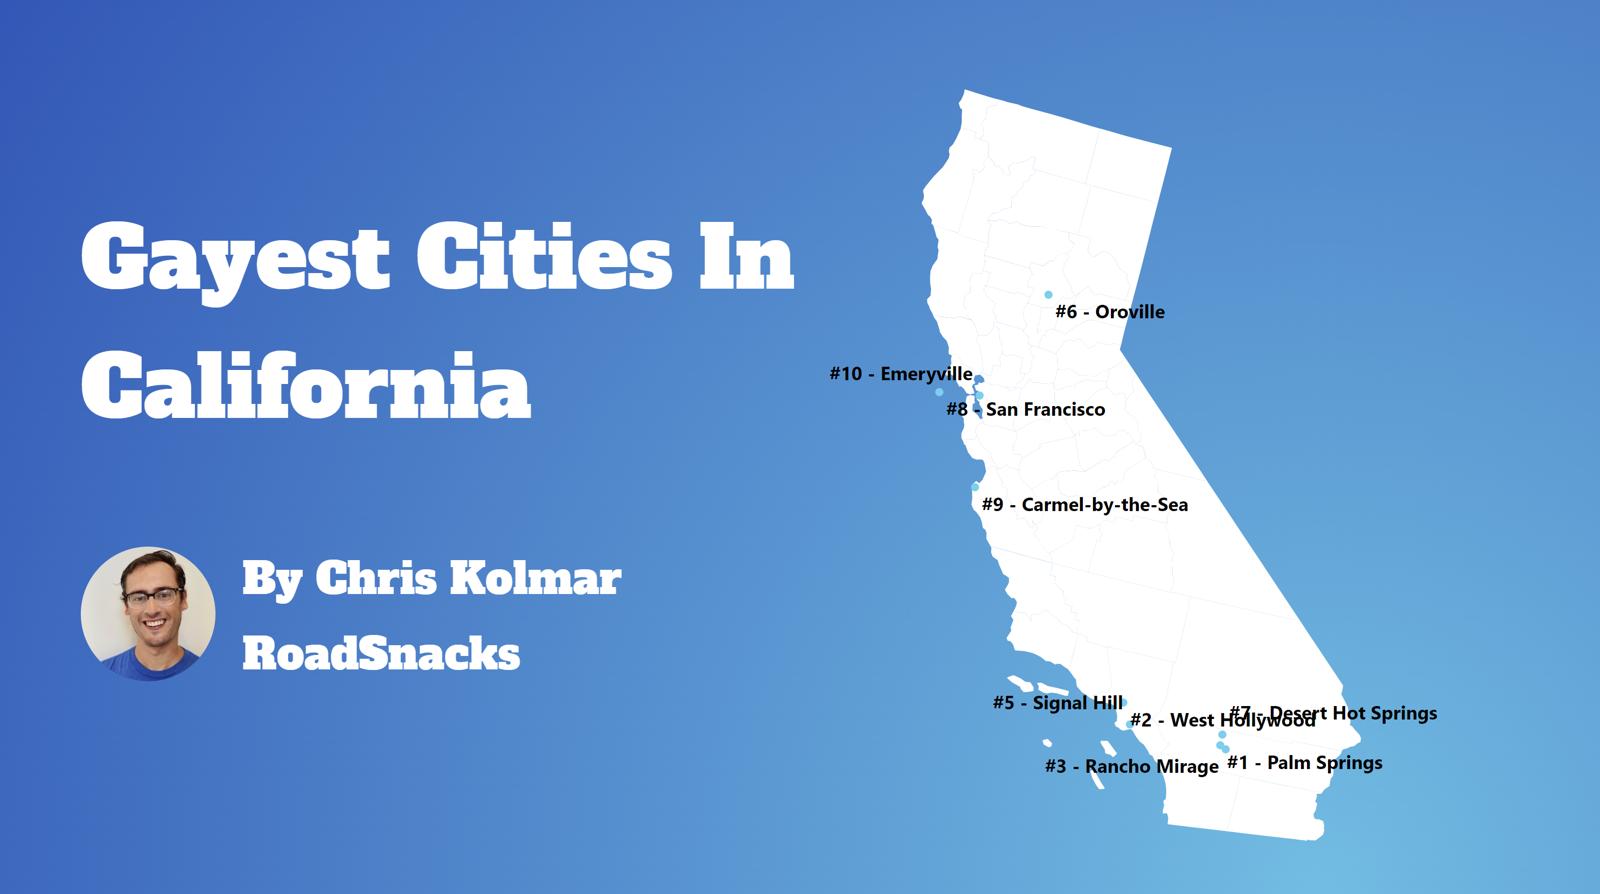
Table Of Contents: Top Ten | Methodology | Summary | Table
An estimated 1.22% of California residents are gay.
That means there are a total of 164,869 gay households in The Golden State.
Our goal with this post is to use Saturday Night Science and data to determine the gayest cities in California.
After analyzing 450 cities with over 1,000 households, we’ve determined these are The Gayest Cities in California for 2026.
The 10 Gayest Places In California For 2026
- Palm Springs
- Rancho Mirage
- Cathedral City
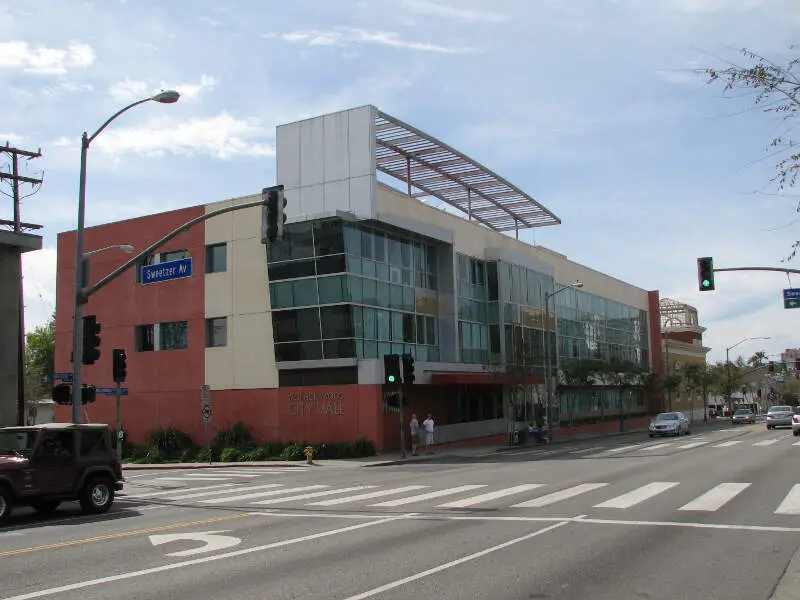
- West Hollywood
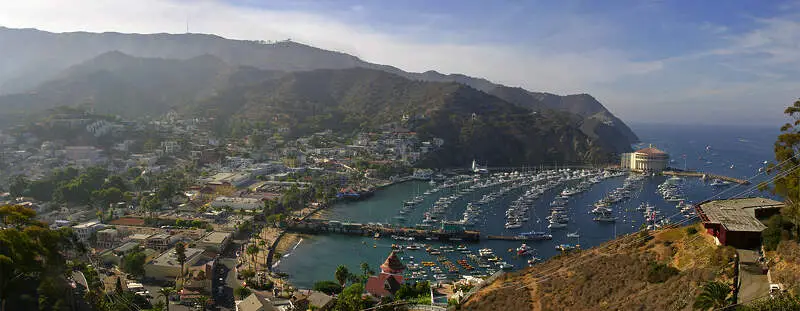
- Avalon
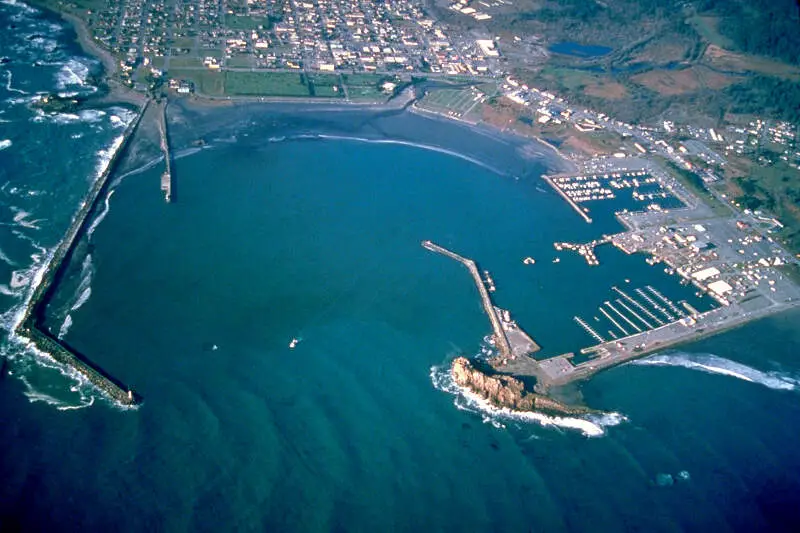
- Crescent City
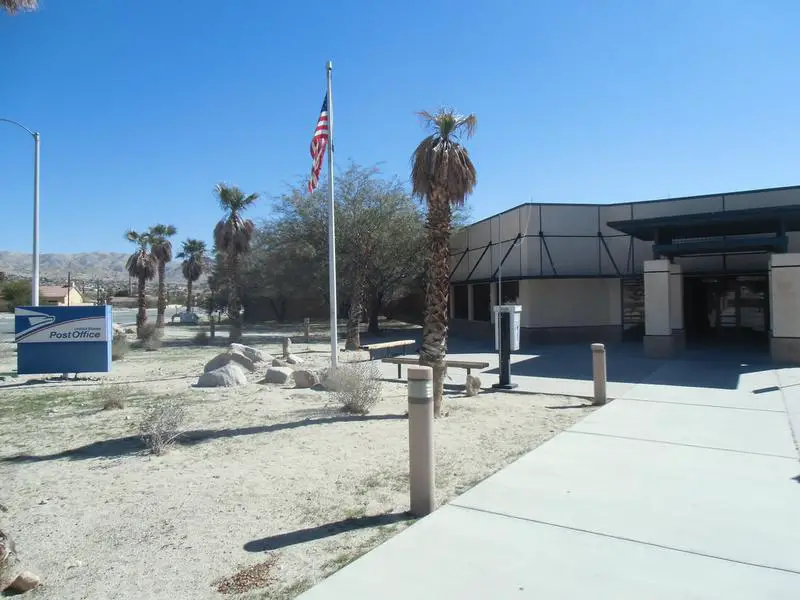
- Desert Hot Springs
- Signal Hill
- South San Francisco
- Laguna Beach
What’s the gayest place in California? According to the facts, Palm Springs is the gayest place in California for 2026.
For more on how we calculated the top ten, and for more information about these places, read on.
For more California reading, check out:
- Gayest cities in the United States
- Best Places To Live In California
- Cheapest Places To Live In California
- Most Dangerous Cities In California
The 10 Gayest Cities In California For 2026

/10
Households: 24,567
Gay Households: 4,105 (6th highest)
% Gay Households: 16.71% (1st highest)
More on Palm Springs: Data | Crime | Cost Of Living | Movers

/10
Households: 9,003
Gay Households: 1,122 (15th highest)
% Gay Households: 12.46% (2nd highest)
More on Rancho Mirage: Data | Crime | Cost Of Living | Movers

/10
Households: 18,979
Gay Households: 1,484 (10th highest)
% Gay Households: 7.82% (3rd highest)
More on Cathedral City: Data | Crime | Cost Of Living | Movers

/10
Households: 22,920
Gay Households: 1,717 (9th highest)
% Gay Households: 7.49% (4th highest)
More on West Hollywood: Data | Crime | Cost Of Living | Movers
5. Avalon
/10
Households: 1,374
Gay Households: 101 (216th highest)
% Gay Households: 7.35% (5th highest)
More on Avalon: Crime | Movers
/10
Households: 1,693
Gay Households: 64 (281st highest)
% Gay Households: 3.78% (6th highest)
More on Crescent City: Data | Crime | Cost Of Living | Movers

/10
Households: 11,379
Gay Households: 406 (70th highest)
% Gay Households: 3.57% (7th highest)
More on Desert Hot Springs: Data | Crime | Cost Of Living | Movers

/10
Households: 4,545
Gay Households: 153 (169th highest)
% Gay Households: 3.37% (8th highest)
More on Signal Hill: Data | Crime | Cost Of Living | Movers

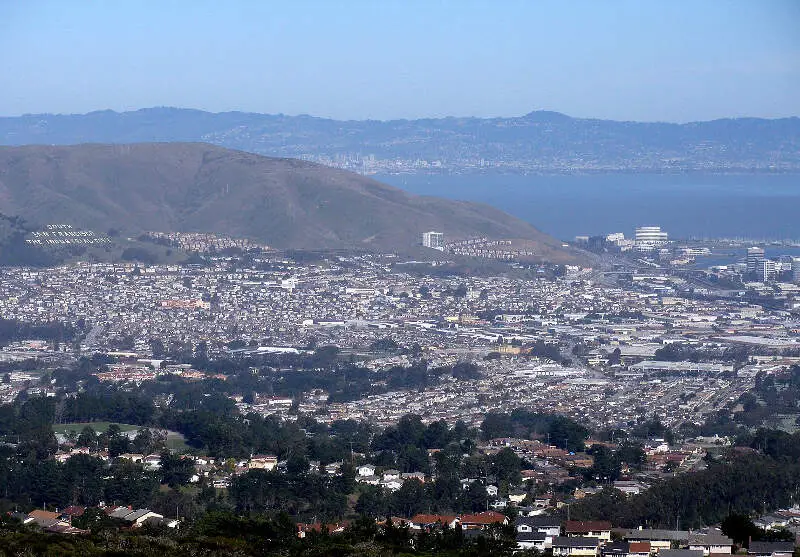
/10
Households: 21,838
Gay Households: 650 (29th highest)
% Gay Households: 2.98% (9th highest)
More on South San Francisco: Data | Crime | Cost Of Living | Movers

/10
Households: 10,839
Gay Households: 317 (94th highest)
% Gay Households: 2.92% (10th highest)
More on Laguna Beach: Data | Crime | Cost Of Living | Movers
How do you determine the best cities for same-sex households in California for 2026
In order to rank the gayest cities in California, we used Saturday Night Science and the 2020-2024 American Community Survey 5-year estimates from the U.S. Census. We looked at:
- Percentage of all households that are unmarried, same sex partners
We limited the analysis to non-CDPs that have over 1,000 households.
We ranked each place from 1 to 450 with the city containing the highest percentage of unmarried, same sex partners households being the most gay.
In the end, ended up being the the most gay place with 16.71% gay households.
Skip to the end to see the list of all the places in the state from gayest to straighest.
We updated this report for 2026. This report is our eleventh time ranking the gayest places in California.
There You Have It – The Most LGBT Friendly Cities In California For 2026
If you’re looking at the number of gay households in California, this is an accurate list.
The gayest cities in California are .
If you’re curious enough, here are the least gay places in California:
- Alturas
- San Anselmo
- Newman
For more California reading, check out:
- Richest Cities In California
- Safest Places In California
- Worst Places To Live In California
- Most Expensive Places To Live In California
Table: Gayest Places To Live In California
| Rank | City | Households | % Gay Households |
|---|---|---|---|
| 1 | Palm Springs | 24,567 | 16.71% |
| 2 | Rancho Mirage | 9,003 | 12.46% |
| 3 | Cathedral City | 18,979 | 7.82% |
| 4 | West Hollywood | 22,920 | 7.49% |
| 5 | Avalon | 1,374 | 7.35% |
| 6 | Crescent City | 1,693 | 3.78% |
| 7 | Desert Hot Springs | 11,379 | 3.57% |
| 8 | Signal Hill | 4,545 | 3.37% |
| 9 | South San Francisco | 21,838 | 2.98% |
| 10 | Laguna Beach | 10,839 | 2.92% |
| 11 | Palm Desert | 24,690 | 2.92% |
| 12 | Del Mar | 1,855 | 2.91% |
| 13 | Sonoma | 5,285 | 2.88% |
| 14 | San Francisco | 363,970 | 2.87% |
| 15 | Orinda | 7,277 | 2.83% |
| 16 | Healdsburg | 4,651 | 2.77% |
| 17 | Berkeley | 47,135 | 2.54% |
| 18 | Oakland | 176,584 | 2.53% |
| 19 | Mammoth Lakes | 3,318 | 2.5% |
| 20 | Twentynine Palms | 9,291 | 2.5% |
| 21 | Hillsborough | 3,610 | 2.44% |
| 22 | Long Beach | 170,927 | 2.41% |
| 23 | Fairfax | 3,265 | 2.39% |
| 24 | Nevada City | 1,323 | 2.34% |
| 25 | Santa Cruz | 21,713 | 2.22% |
| 26 | Cloverdale | 3,462 | 2.2% |
| 27 | Emeryville | 7,838 | 2.19% |
| 28 | Dos Palos | 2,099 | 2.19% |
| 29 | Claremont | 11,950 | 2.18% |
| 30 | Grand Terrace | 4,736 | 2.13% |
| 31 | Willits | 2,162 | 2.13% |
| 32 | Indian Wells | 2,468 | 2.11% |
| 33 | Brentwood | 21,295 | 2.1% |
| 34 | San Pablo | 9,743 | 2.07% |
| 35 | La Quinta | 15,962 | 2.07% |
| 36 | Loma Linda | 9,386 | 2.07% |
| 37 | El Cerrito | 10,831 | 2.05% |
| 38 | Yountville | 1,489 | 2.01% |
| 39 | Alameda | 29,988 | 2.01% |
| 40 | Albany | 7,631 | 1.95% |
| 41 | Redwood City | 29,951 | 1.92% |
| 42 | Santa Rosa | 68,321 | 1.92% |
| 43 | Corte Madera | 4,036 | 1.88% |
| 44 | Sacramento | 200,321 | 1.87% |
| 45 | La Mesa | 25,038 | 1.86% |
| 46 | San Diego | 530,412 | 1.84% |
| 47 | Scotts Valley | 5,036 | 1.83% |
| 48 | Corcoran | 4,226 | 1.82% |
| 49 | Azusa | 14,870 | 1.81% |
| 50 | Woodside | 1,784 | 1.79% |
| 51 | Pasadena | 57,425 | 1.78% |
| 52 | Sebastopol | 3,319 | 1.78% |
| 53 | San Rafael | 22,910 | 1.78% |
| 54 | Richmond | 40,806 | 1.75% |
| 55 | Beverly Hills | 14,449 | 1.74% |
| 56 | Auburn | 6,055 | 1.73% |
| 57 | Larkspur | 6,018 | 1.73% |
| 58 | Escalon | 2,854 | 1.72% |
| 59 | Fortuna | 4,925 | 1.71% |
| 60 | Palo Alto | 26,021 | 1.7% |
| 61 | Shafter | 5,677 | 1.67% |
| 62 | Orange Cove | 2,403 | 1.66% |
| 63 | Piedmont | 3,864 | 1.66% |
| 64 | Rio Dell | 1,480 | 1.62% |
| 65 | Yucaipa | 18,506 | 1.61% |
| 66 | Sierra Madre | 4,620 | 1.6% |
| 67 | Calexico | 10,069 | 1.59% |
| 68 | Waterford | 2,581 | 1.59% |
| 69 | West Sacramento | 19,367 | 1.57% |
| 70 | Marysville | 4,901 | 1.57% |
| 71 | Culver City | 17,529 | 1.56% |
| 72 | Merced | 27,950 | 1.56% |
| 73 | Los Angeles | 1,439,097 | 1.54% |
| 74 | Petaluma | 24,239 | 1.53% |
| 75 | Chico | 42,943 | 1.52% |
| 76 | Westlake Village | 2,967 | 1.52% |
| 77 | Arcata | 7,884 | 1.48% |
| 78 | Burbank | 42,995 | 1.47% |
| 79 | Davis | 25,358 | 1.47% |
| 80 | Atascadero | 11,579 | 1.47% |
| 81 | Jackson | 2,385 | 1.47% |
| 82 | San Marcos | 31,350 | 1.46% |
| 83 | Mcfarland | 3,570 | 1.46% |
| 84 | Apple Valley | 25,184 | 1.45% |
| 85 | Tiburon | 3,510 | 1.45% |
| 86 | Duarte | 7,515 | 1.45% |
| 87 | South Pasadena | 10,220 | 1.45% |
| 88 | Mountain View | 35,767 | 1.44% |
| 89 | Oakley | 13,685 | 1.43% |
| 90 | Monterey Park | 20,646 | 1.4% |
| 91 | East Palo Alto | 8,267 | 1.4% |
| 92 | La Habra | 20,538 | 1.4% |
| 93 | Bell Gardens | 9,713 | 1.39% |
| 94 | Grass Valley | 6,769 | 1.39% |
| 95 | Santa Fe Springs | 5,716 | 1.38% |
| 96 | Novato | 20,056 | 1.37% |
| 97 | Barstow | 9,145 | 1.37% |
| 98 | Martinez | 14,723 | 1.37% |
| 99 | Pleasant Hill | 13,258 | 1.36% |
| 100 | Glendora | 16,734 | 1.36% |