
Gayest places in Illinois research summary. We used Saturday Night Science to research the cities in Illinois with the highest percent of same-sex households for 2025. The data comes from the American Community Survey 2013-2018 vintage, which breaks down sex by household status. Unfortunately, the Census has stopped reporting at the city level, so this report reflects the most recent data.
-
The city with the highest rate of same-sex houesholds in Illinois is Coal Valley. 3.72% of households in Coal Valley are gay.
-
The city in Illinois with the most same-sex houesholds is Chicago with 6,583 gay households.
-
Illinois is the 47th most gay in the United States.
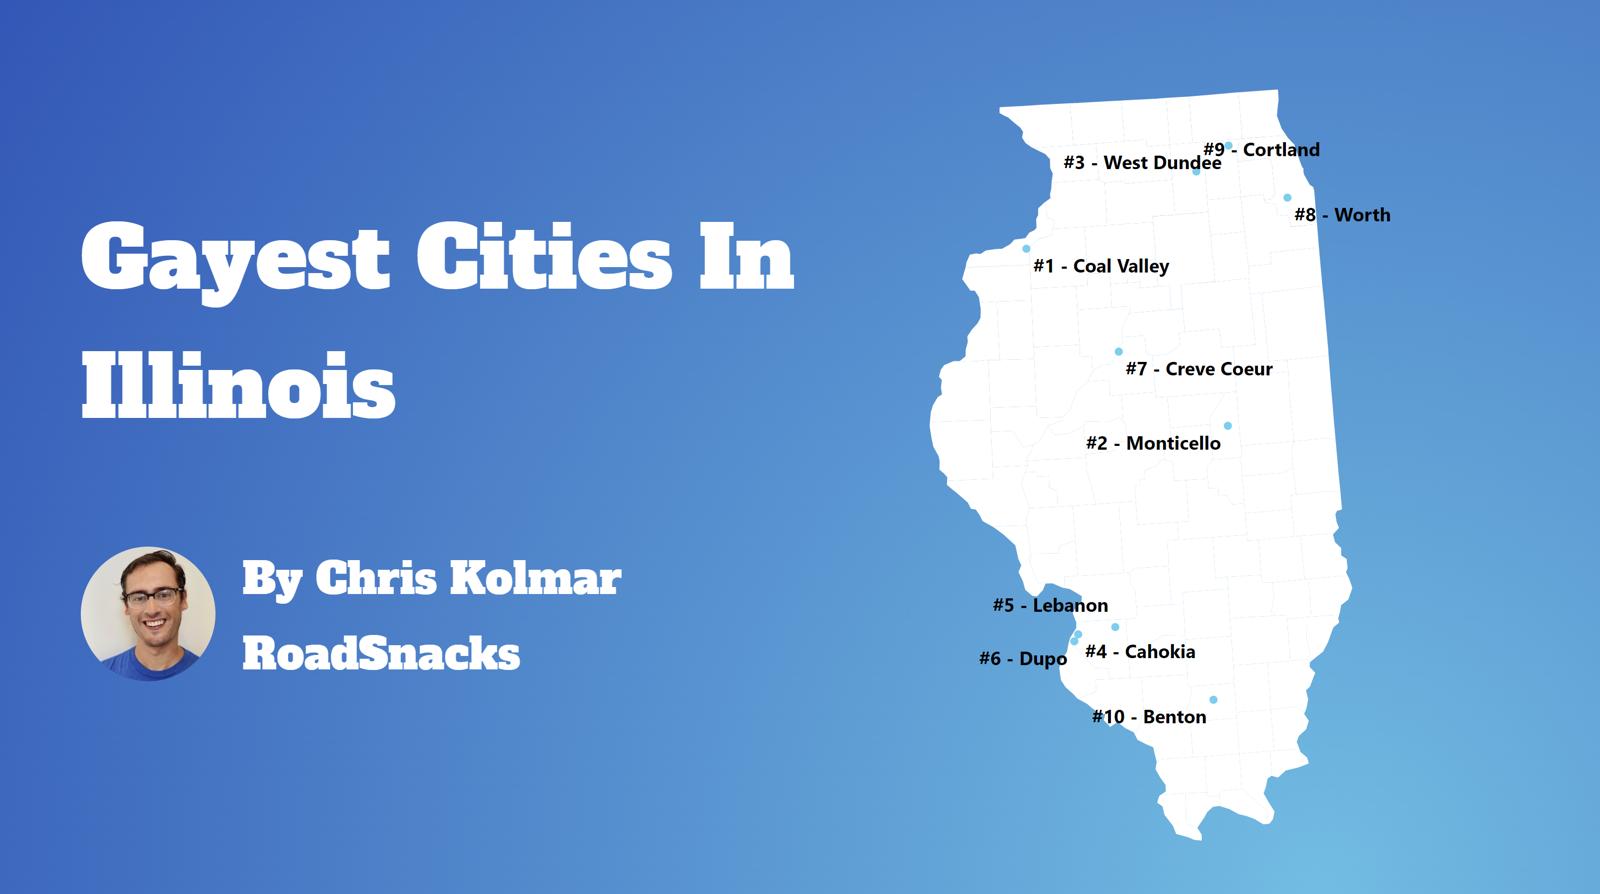
Table Of Contents: Top Ten | Methodology | Summary | Table
An estimated 4.5% of Illinois residents are gay.
That means there are a total of 446,600 gay households in The Prairie State.
Our goal with this post is to use Saturday Night Science and data to determine the gayest cities in Illinois.
After analyzing 438 cities with over 1,000 households, we’ve determined these are The Gayest Cities in Illinois for 2025.
The 10 Gayest Places In Illinois For 2025
- Coal Valley
- Monticello
- West Dundee
- Cahokia
- Lebanon
- Dupo
- Creve Coeur
- Worth
- Cortland
- Benton
What’s the gayest place in Illinois? According to the facts, Coal Valley is the gayest place in Illinois for 2025.
For more on how we calculated the top ten, and for more information about these places, read on.
For more Illinois reading, check out:
- Gayest cities in the United States
- Best Places To Live In Illinois
- Cheapest Places To Live In Illinois
- Most Dangerous Cities In Illinois
The 10 Gayest Cities In Illinois For 2025
1. Coal Valley
/10
Households: 1,560
Gay Households: 29 (74th highest)
% Gay Households: 3.72% (1st highest)
More on Coal Valley:

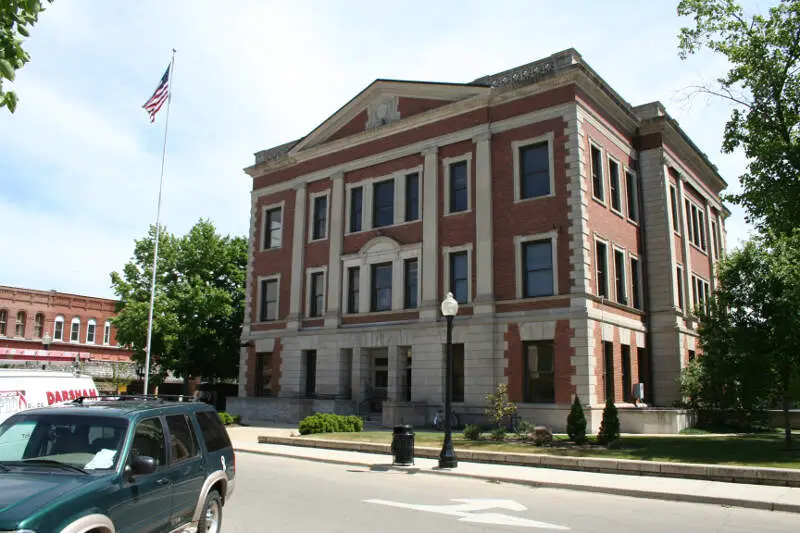
/10
Households: 2,425
Gay Households: 52 (40th highest)
% Gay Households: 2.97% (2nd highest)
More on Monticello: Data

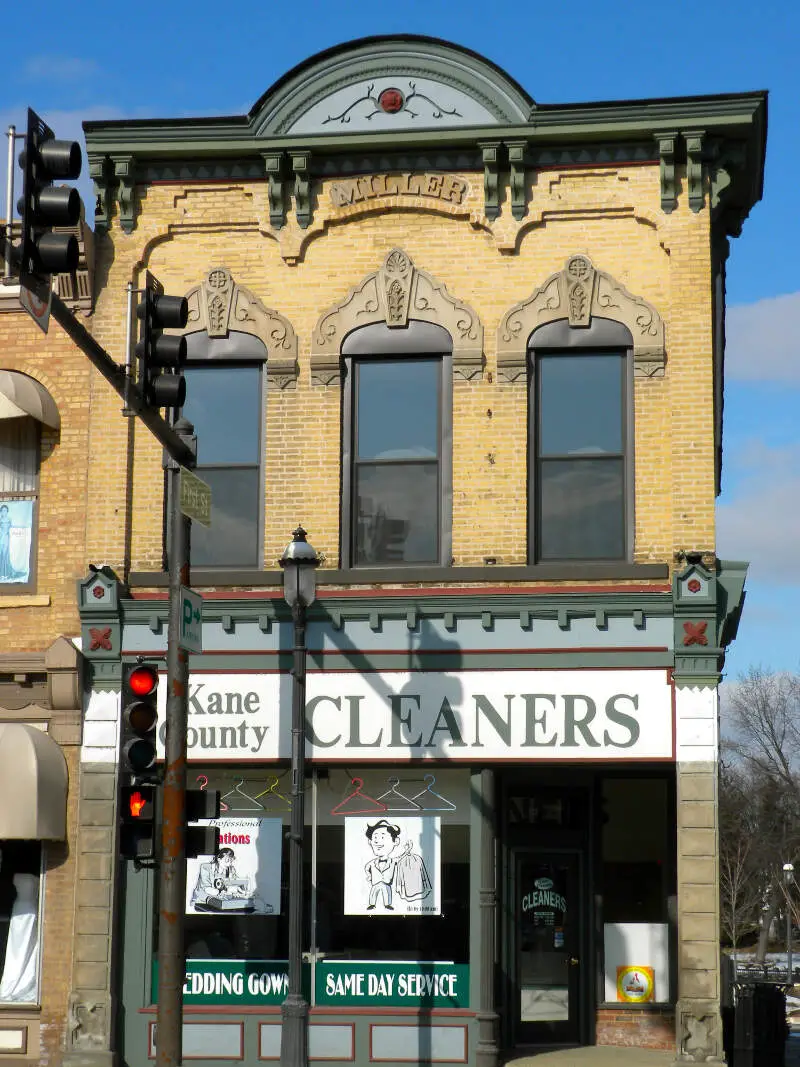
/10
Households: 3,156
Gay Households: 60 (30th highest)
% Gay Households: 2.41% (3rd highest)
More on West Dundee: Data
4. Cahokia

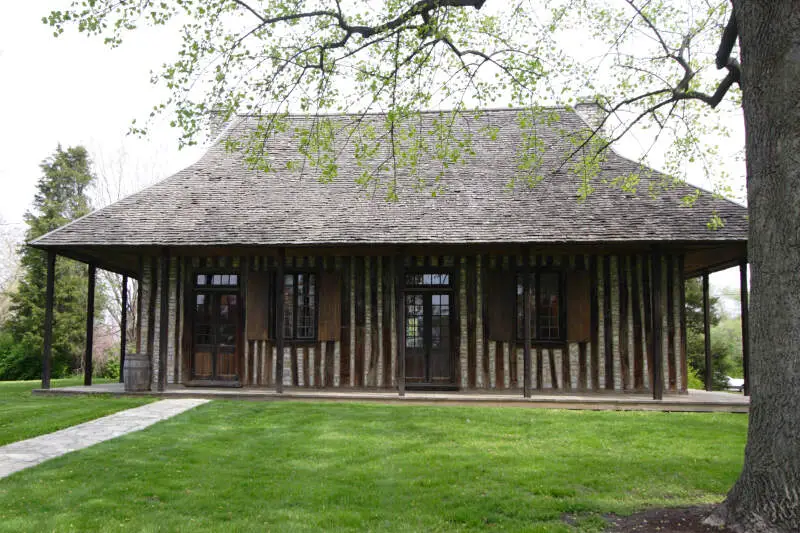
/10
Households: 4,910
Gay Households: 54 (36th highest)
% Gay Households: 2.2% (4th highest)
More on Cahokia:
5. Lebanon
/10
Households: 1,656
Gay Households: 18 (108th highest)
% Gay Households: 2.17% (5th highest)
More on Lebanon:
6. Dupo
/10
Households: 1,621
Gay Households: 17 (116th highest)
% Gay Households: 2.1% (6th highest)
More on Dupo:

/10
Households: 2,146
Gay Households: 22 (90th highest)
% Gay Households: 2.05% (7th highest)
More on Creve Coeur: Data

/10
Households: 3,999
Gay Households: 41 (55th highest)
% Gay Households: 1.75% (8th highest)
More on Worth: Data
9. Cortland
/10
Households: 1,342
Gay Households: 11 (155th highest)
% Gay Households: 1.64% (9th highest)
More on Cortland:

/10
Households: 2,873
Gay Households: 29 (74th highest)
% Gay Households: 1.6% (10th highest)
More on Benton: Data
How do you determine the best cities for same-sex households in Illinois for 2025
In order to rank the gayest cities in Illinois, we used Saturday Night Science and the 2013-2018 American Community Survey from the U.S. Census. We looked at:
- Percentage of all households that are unmarried, same sex partners
We limited the analysis to non-CDPs that have over 1,000 households.
We ranked each place from 1 to 438 with the city containing the highest percentage of unmarried, same sex partners households being the most gay.
In the end, ended up being the the most gay place with 3.72% gay households.
Skip to the end to see the list of all the places in the state from gayest to straighest.
We updated this report for 2025. This report is our tenth time ranking the gayest places in Illinois.
There You Have It – The Most LGBT Friendly Cities In Illinois For 2025
If you’re looking at the number of gay households in Illinois, this is an accurate list.
The gayest cities in Illinois are .
If you’re curious enough, here are the least gay places in Illinois:
- Pingree Grove
- Virden
- Trenton
For more Illinois reading, check out:
- Richest Cities In Illinois
- Safest Places In Illinois
- Worst Places To Live In Illinois
- Most Expensive Places To Live In Illinois
Table: Gayest Places To Live In Illinois
| Rank | City | Households | % Gay Households |
|---|---|---|---|
| 1 | Coal Valley | 1,560 | 3.72% |
| 2 | Monticello | 2,425 | 2.97% |
| 3 | West Dundee | 3,156 | 2.41% |
| 4 | Cahokia | 4,910 | 2.2% |
| 5 | Lebanon | 1,656 | 2.17% |
| 6 | Dupo | 1,621 | 2.1% |
| 7 | Creve Coeur | 2,146 | 2.05% |
| 8 | Worth | 3,999 | 1.75% |
| 9 | Cortland | 1,342 | 1.64% |
| 10 | Benton | 2,873 | 1.6% |
| 11 | Shiloh | 5,149 | 1.59% |
| 12 | Yorkville | 6,175 | 1.39% |
| 13 | Westchester | 6,557 | 1.19% |
| 14 | Casey | 1,189 | 1.18% |
| 15 | Swansea | 5,579 | 1.04% |
| 16 | Crystal Lake | 14,701 | 1.02% |
| 17 | Round Lake | 5,747 | 1.01% |
| 18 | Troy | 3,874 | 0.98% |
| 19 | Palos Heights | 4,710 | 0.98% |
| 20 | Calumet City | 13,769 | 0.97% |
| 21 | Carpentersville | 10,824 | 0.96% |
| 22 | Oswego | 11,114 | 0.95% |
| 23 | Godfrey | 7,362 | 0.92% |
| 24 | Crestwood | 4,988 | 0.92% |
| 25 | Sparta | 1,978 | 0.91% |
| 26 | Eldorado | 1,812 | 0.88% |
| 27 | Maryville | 3,455 | 0.87% |
| 28 | Chicago | 1,056,118 | 0.87% |
| 29 | Oak Park | 21,684 | 0.85% |
| 30 | Sleepy Hollow | 1,218 | 0.82% |
| 31 | Riverside | 3,190 | 0.82% |
| 32 | Alton | 11,492 | 0.8% |
| 33 | Savoy | 3,523 | 0.79% |
| 34 | Park City | 2,274 | 0.79% |
| 35 | University Park | 2,584 | 0.77% |
| 36 | Evanston | 28,524 | 0.76% |
| 37 | Belvidere | 8,992 | 0.76% |
| 38 | Berwyn | 18,225 | 0.75% |
| 39 | West Frankfort | 3,391 | 0.71% |
| 40 | Heyworth | 1,153 | 0.69% |
| 41 | Quincy | 17,308 | 0.69% |
| 42 | Carol Stream | 14,119 | 0.67% |
| 43 | Midlothian | 5,385 | 0.63% |
| 44 | Dolton | 7,690 | 0.62% |
| 45 | Lindenhurst | 5,145 | 0.62% |
| 46 | Winthrop Harbor | 2,610 | 0.61% |
| 47 | Melrose Park | 7,678 | 0.6% |
| 48 | Washington | 6,530 | 0.58% |
| 49 | Peoria | 46,280 | 0.58% |
| 50 | Henry | 1,040 | 0.58% |
| 51 | Bloomingdale | 8,581 | 0.56% |
| 52 | Moline | 18,254 | 0.55% |
| 53 | St. Charles | 12,708 | 0.54% |
| 54 | Forest Park | 7,115 | 0.53% |
| 55 | Vernon Hills | 9,752 | 0.53% |
| 56 | Niles | 10,966 | 0.53% |
| 57 | Alsip | 7,213 | 0.53% |
| 58 | Macomb | 6,128 | 0.52% |
| 59 | Lincolnwood | 4,260 | 0.52% |
| 60 | Grayslake | 7,940 | 0.5% |
| 61 | North Chicago | 7,219 | 0.5% |
| 62 | Cicero | 22,226 | 0.49% |
| 63 | Antioch | 5,035 | 0.48% |
| 64 | Champaign | 34,463 | 0.48% |
| 65 | Streamwood | 13,193 | 0.47% |
| 66 | Crete | 3,063 | 0.46% |
| 67 | Bolingbrook | 22,483 | 0.45% |
| 68 | Lincolnshire | 3,097 | 0.45% |
| 69 | Kewanee | 5,006 | 0.44% |
| 70 | Markham | 4,174 | 0.43% |
| 71 | Edwardsville | 8,554 | 0.42% |
| 72 | Rantoul | 5,088 | 0.39% |
| 73 | Rock Island | 15,412 | 0.39% |
| 74 | Mundelein | 10,842 | 0.39% |
| 75 | Skokie | 22,446 | 0.38% |
| 76 | Herrin | 5,241 | 0.38% |
| 77 | Island Lake | 3,149 | 0.38% |
| 78 | Springfield | 50,890 | 0.38% |
| 79 | Orland Park | 22,307 | 0.38% |
| 80 | Paris | 3,722 | 0.38% |
| 81 | Oak Lawn | 21,415 | 0.37% |
| 82 | Dekalb | 15,015 | 0.37% |
| 83 | Rockford | 59,403 | 0.37% |
| 84 | Lisle | 9,857 | 0.37% |
| 85 | Hickory Hills | 4,957 | 0.36% |
| 86 | Pekin | 13,892 | 0.36% |
| 87 | Wheeling | 14,019 | 0.36% |
| 88 | Fairview Heights | 6,957 | 0.34% |
| 89 | Glenview | 17,482 | 0.34% |
| 90 | Homewood | 7,604 | 0.34% |
| 91 | La Grange | 5,306 | 0.34% |
| 92 | Downers Grove | 20,268 | 0.32% |
| 93 | Shorewood | 5,816 | 0.31% |
| 94 | South Holland | 7,219 | 0.3% |
| 95 | Villa Park | 8,101 | 0.3% |
| 96 | Des Plaines | 22,036 | 0.28% |
| 97 | Elgin | 36,682 | 0.28% |
| 98 | Maywood | 7,690 | 0.26% |
| 99 | Decatur | 31,062 | 0.26% |
| 100 | Bloomington | 31,952 | 0.26% |