
Gayest places in Michigan research summary. We used Saturday Night Science to research the cities in Michigan with the highest percent of same-sex households for 2025. The data comes from the American Community Survey 2013-2018 vintage, which breaks down sex by household status. Unfortunately, the Census has stopped reporting at the city level, so this report reflects the most recent data.
-
The city with the highest rate of same-sex houesholds in Michigan is Pleasant Ridge. 6.57% of households in Pleasant Ridge are gay.
-
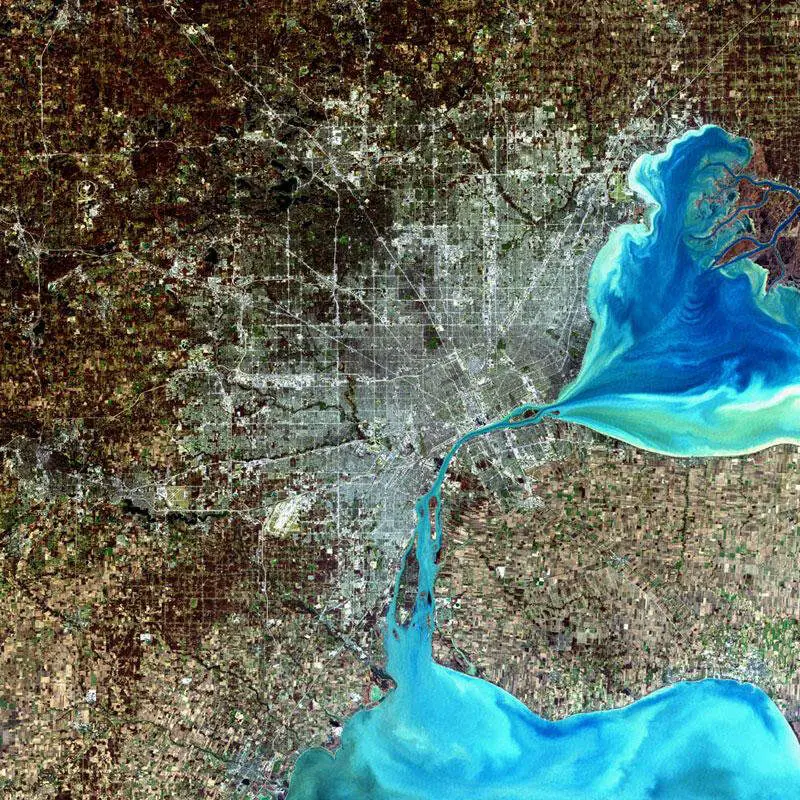
The city in Michigan with the most same-sex houesholds is Detroit with 629 gay households.
-
Michigan is the 16th most gay in the United States.
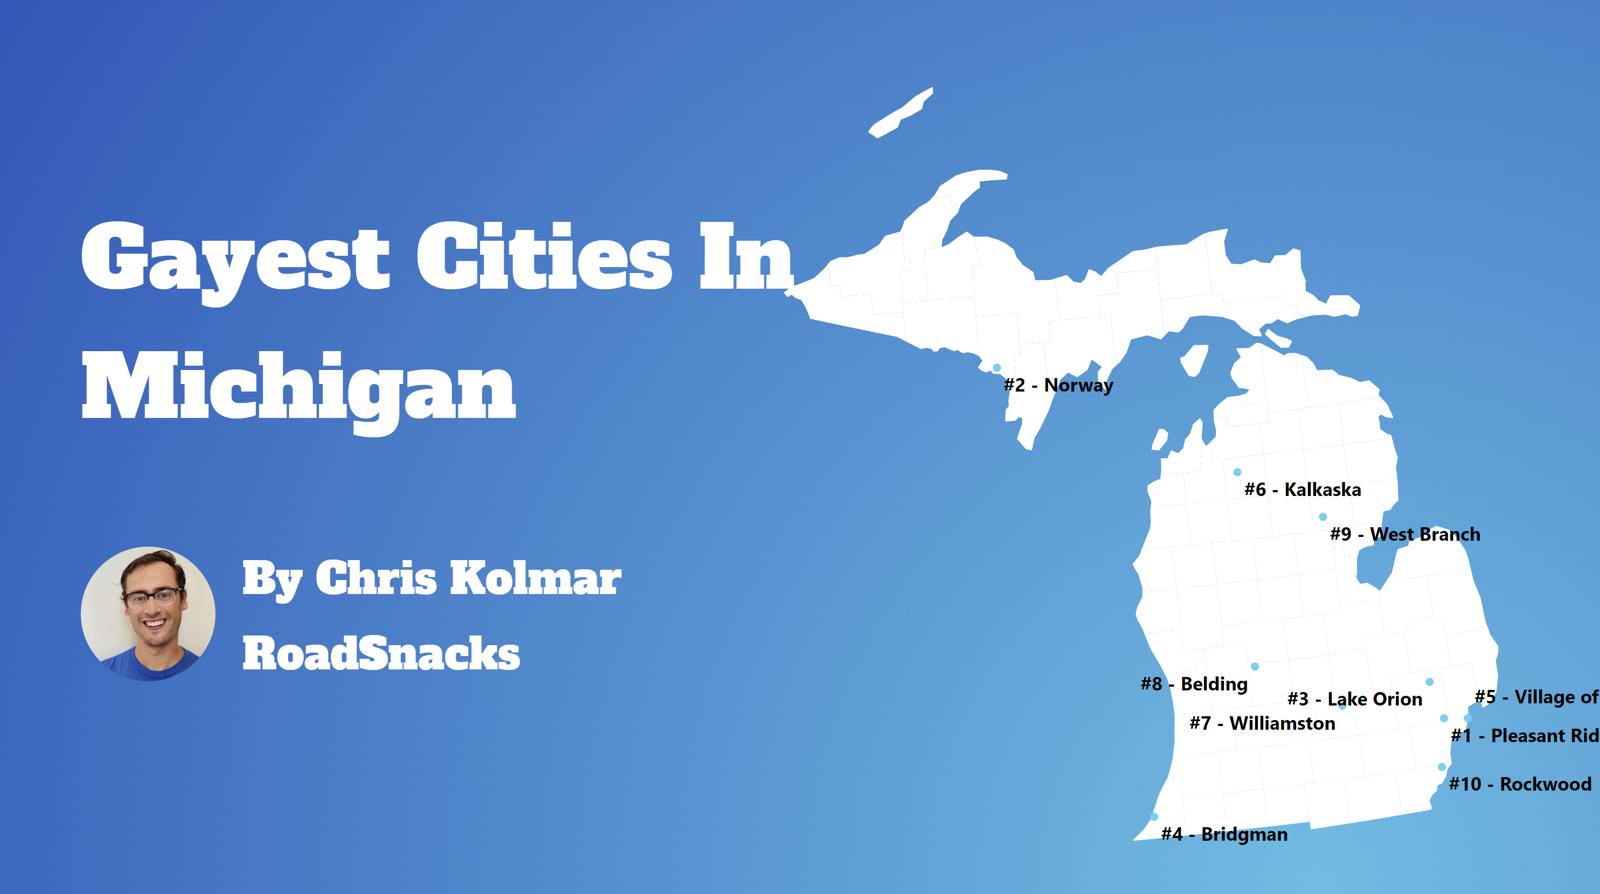
Table Of Contents: Top Ten | Methodology | Summary | Table
An estimated 6.0% of Michigan residents are gay.
That means there are a total of 467,300 gay households in The Wolverine State.
Our goal with this post is to use Saturday Night Science and data to determine the gayest cities in Michigan.
After analyzing 226 cities with over 1,000 households, we’ve determined these are The Gayest Cities in Michigan for 2025.
The 10 Gayest Places In Michigan For 2025
- Pleasant Ridge
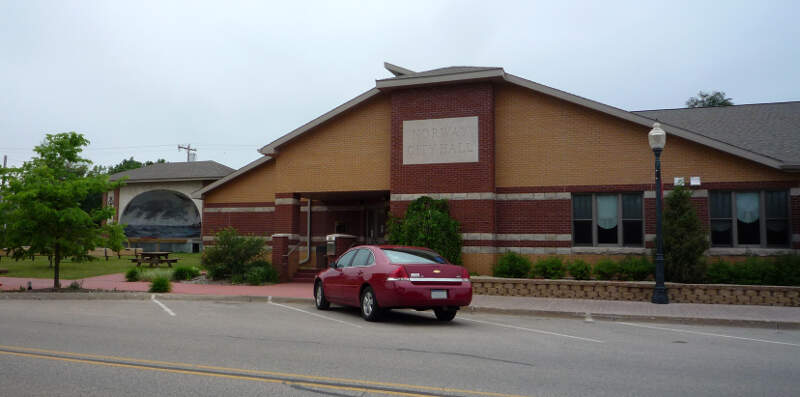
- Norway
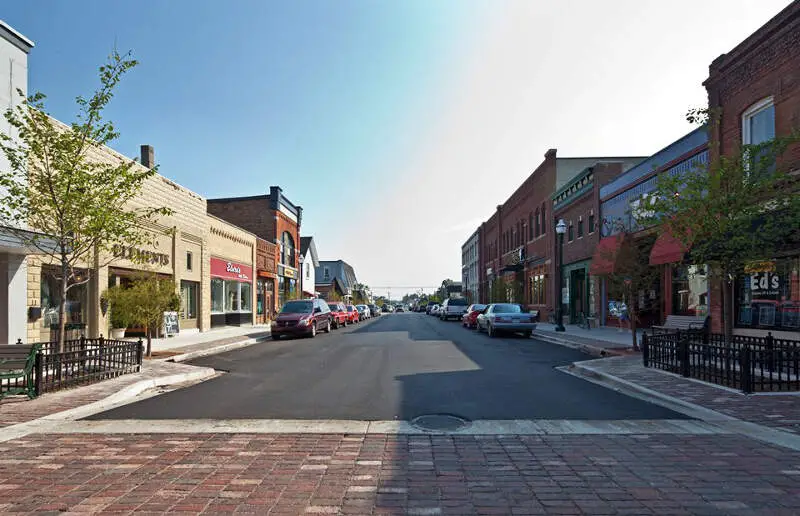
- Lake Orion
- Bridgman
- Village of Grosse Pointe Shores
- Kalkaska
- Williamston
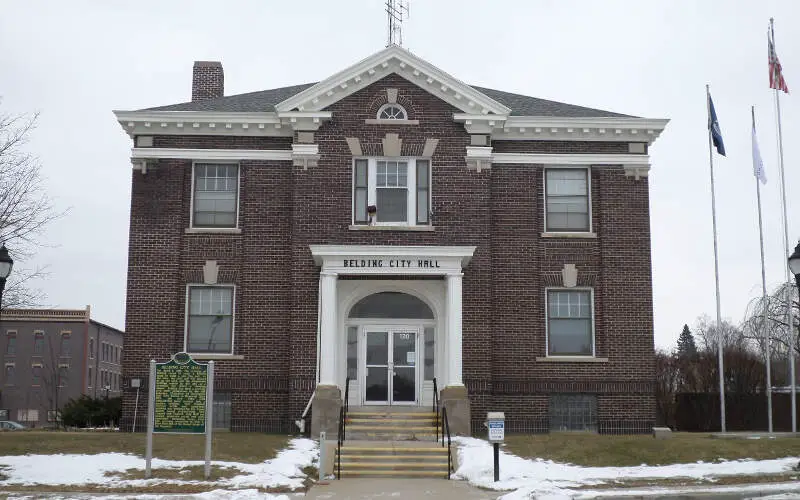
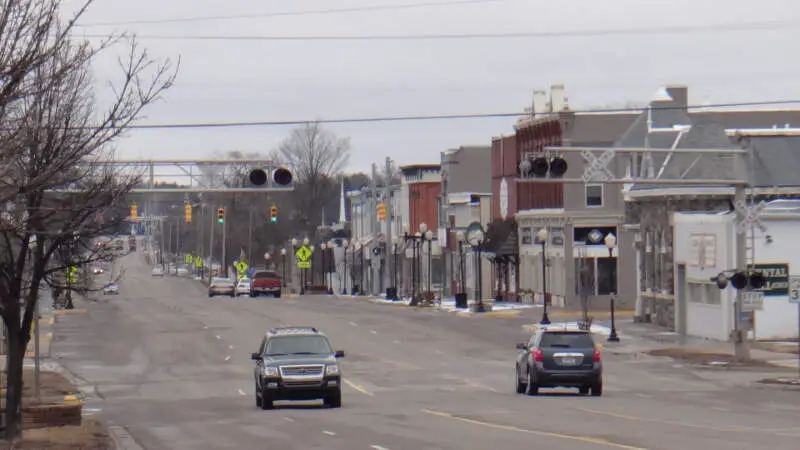
- Belding
- West Branch
- Rockwood
What’s the gayest place in Michigan? According to the facts, Pleasant Ridge is the gayest place in Michigan for 2025.
For more on how we calculated the top ten, and for more information about these places, read on.
For more Michigan reading, check out:
- Gayest cities in the United States
- Best Places To Live In Michigan
- Cheapest Places To Live In Michigan
- Most Dangerous Places in Michigan
The 10 Gayest Cities In Michigan For 2025
/10
Households: 1,035
Gay Households: 61 (27th highest)
% Gay Households: 6.57% (1st highest)
More on Pleasant Ridge: Data
/10
Households: 1,447
Gay Households: 32 (56th highest)
% Gay Households: 4.42% (2nd highest)
More on Norway: Data
/10
Households: 1,345
Gay Households: 39 (47th highest)
% Gay Households: 2.97% (3rd highest)
More on Lake Orion: Data
/10
Households: 1,051
Gay Households: 14 (86th highest)
% Gay Households: 2.66% (4th highest)
More on Bridgman: Data
/10
Households: 1,165
Gay Households: 14 (86th highest)
% Gay Households: 2.4% (5th highest)
More on Village Of Grosse Pointe Shores: Data
/10
Households: 1,023
Gay Households: 9 (106th highest)
% Gay Households: 1.76% (6th highest)
More on Kalkaska: Data
/10
Households: 1,662
Gay Households: 24 (66th highest)
% Gay Households: 1.56% (7th highest)
More on Williamston: Data

/10
Households: 2,200
Gay Households: 28 (61st highest)
% Gay Households: 1.45% (8th highest)
More on Belding: Data
/10
Households: 1,028
Gay Households: 7 (116th highest)
% Gay Households: 1.36% (9th highest)
More on West Branch: Data

/10
Households: 1,373
Gay Households: 9 (106th highest)
% Gay Households: 1.31% (10th highest)
More on Rockwood: Data
How do you determine the best cities for same-sex households in Michigan for 2025
In order to rank the gayest cities in Michigan, we used Saturday Night Science and the 2013-2018 American Community Survey from the U.S. Census. We looked at:
- Percentage of all households that are unmarried, same sex partners
We limited the analysis to non-CDPs that have over 1,000 households.
We ranked each place from 1 to 226 with the city containing the highest percentage of unmarried, same sex partners households being the most gay.
In the end, ended up being the the most gay place with 6.57% gay households.
Skip to the end to see the list of all the places in the state from gayest to straighest.
We updated this report for 2025. This report is our tenth time ranking the gayest places in Michigan.
There You Have It – The Most LGBT Friendly Cities In Michigan For 2025
If you’re looking at the number of gay households in Michigan, this is an accurate list.
The gayest cities in Michigan are .
If you’re curious enough, here are the least gay places in Michigan:
- Almont
- Franklin
- Grandville
For more Michigan reading, check out:
- Richest Cities In Michigan
- Safest Places In Michigan
- Worst Places To Live In Michigan
- Most Expensive Places To Live In Michigan
Table: Gayest Places To Live In Michigan
| Rank | City | Households | % Gay Households |
|---|---|---|---|
| 1 | Pleasant Ridge | 1,035 | 6.57% |
| 2 | Norway | 1,447 | 4.42% |
| 3 | Lake Orion | 1,345 | 2.97% |
| 4 | Bridgman | 1,051 | 2.66% |
| 5 | Village Of Grosse Pointe Shores | 1,165 | 2.4% |
| 6 | Kalkaska | 1,023 | 1.76% |
| 7 | Williamston | 1,662 | 1.56% |
| 8 | Belding | 2,200 | 1.45% |
| 9 | West Branch | 1,028 | 1.36% |
| 10 | Rockwood | 1,373 | 1.31% |
| 11 | Wayland | 1,562 | 1.28% |
| 12 | Oak Park | 12,088 | 1.27% |
| 13 | Fowlerville | 1,278 | 1.25% |
| 14 | Huntington Woods | 2,328 | 1.2% |
| 15 | Benton Harbor | 4,189 | 1.19% |
| 16 | Grosse Pointe | 2,150 | 1.12% |
| 17 | Bloomfield Hills | 1,313 | 1.07% |
| 18 | Lowell | 1,508 | 1.06% |
| 19 | Owosso | 6,014 | 1.03% |
| 20 | Ishpeming | 2,797 | 0.93% |
| 21 | East Lansing | 13,461 | 0.92% |
| 22 | Greenville | 3,483 | 0.92% |
| 23 | Gibraltar | 1,769 | 0.9% |
| 24 | Bay City | 13,880 | 0.89% |
| 25 | Ann Arbor | 47,791 | 0.88% |
| 26 | Marine City | 1,832 | 0.87% |
| 27 | Mount Clemens | 6,814 | 0.85% |
| 28 | Grand Rapids | 74,202 | 0.77% |
| 29 | Sandusky | 1,041 | 0.77% |
| 30 | Lathrup Village | 1,586 | 0.76% |
| 31 | Hazel Park | 7,244 | 0.75% |
| 32 | Manistee | 2,684 | 0.75% |
| 33 | Berkley | 6,643 | 0.69% |
| 34 | St. Joseph | 4,204 | 0.62% |
| 35 | Marshall | 3,294 | 0.61% |
| 36 | Birmingham | 9,117 | 0.59% |
| 37 | Flint | 40,035 | 0.55% |
| 38 | Charlotte | 3,675 | 0.54% |
| 39 | Lansing | 48,926 | 0.54% |
| 40 | Fenton | 5,247 | 0.53% |
| 41 | Hamtramck | 6,120 | 0.52% |
| 42 | Tecumseh | 3,630 | 0.5% |
| 43 | Harper Woods | 5,339 | 0.49% |
| 44 | Mount Pleasant | 7,911 | 0.46% |
| 45 | St. Clair Shores | 26,639 | 0.44% |
| 46 | Midland | 17,552 | 0.43% |
| 47 | Rochester Hills | 28,779 | 0.43% |
| 48 | Grand Ledge | 3,576 | 0.39% |
| 49 | Wayne | 6,675 | 0.39% |
| 50 | East Jordan | 1,029 | 0.39% |
| 51 | Ypsilanti | 7,784 | 0.39% |
| 52 | Ferndale | 10,195 | 0.37% |
| 53 | Dearborn | 30,897 | 0.36% |
| 54 | Kentwood | 20,343 | 0.34% |
| 55 | Portage | 19,649 | 0.32% |
| 56 | Roseville | 19,912 | 0.31% |
| 57 | Alpena | 4,507 | 0.31% |
| 58 | Garden City | 10,681 | 0.3% |
| 59 | Royal Oak | 28,467 | 0.29% |
| 60 | Norton Shores | 9,929 | 0.28% |
| 61 | Wyoming | 27,731 | 0.27% |
| 62 | Jackson | 13,123 | 0.26% |
| 63 | Allen Park | 10,819 | 0.26% |
| 64 | Troy | 31,368 | 0.26% |
| 65 | Southfield | 32,235 | 0.25% |
| 66 | Kalamazoo | 28,665 | 0.25% |
| 67 | Livonia | 37,107 | 0.25% |
| 68 | Escanaba | 5,754 | 0.24% |
| 69 | Port Huron | 12,381 | 0.24% |
| 70 | Novi | 23,117 | 0.23% |
| 71 | Farmington Hills | 33,957 | 0.21% |
| 72 | Fraser | 6,043 | 0.2% |
| 73 | Romulus | 8,533 | 0.19% |
| 74 | Warren | 53,674 | 0.17% |
| 75 | Detroit | 260,383 | 0.16% |
| 76 | Burton | 11,509 | 0.16% |
| 77 | Muskegon | 13,941 | 0.14% |
| 78 | Taylor | 23,706 | 0.14% |
| 79 | Madison Heights | 12,816 | 0.14% |
| 80 | Pontiac | 23,143 | 0.12% |
| 81 | Westland | 35,144 | 0.11% |
| 82 | Lincoln Park | 14,265 | 0.11% |
| 83 | Saginaw | 19,682 | 0.11% |
| 84 | Marquette | 7,607 | 0.11% |
| 85 | Sterling Heights | 50,023 | 0.1% |
| 86 | Dearborn Heights | 20,428 | 0.1% |
| 87 | Wyandotte | 11,166 | 0.09% |
| 88 | Battle Creek | 20,697 | 0.08% |
| 89 | Eastpointe | 12,483 | 0.0% |
| 90 | Oxford | 1,515 | 0.0% |
| 91 | Durand | 1,494 | 0.0% |
| 92 | Trenton | 7,860 | 0.0% |
| 93 | Otsego | 1,670 | 0.0% |
| 94 | Auburn Hills | 9,295 | 0.0% |
| 95 | Marysville | 4,205 | 0.0% |
| 96 | New Baltimore | 4,705 | 0.0% |
| 97 | Utica | 2,262 | 0.0% |
| 98 | Southgate | 12,692 | 0.0% |
| 99 | Milan | 2,168 | 0.0% |
| 100 | Farmington | 4,721 | 0.0% |