
Most African American cities in California research summary. We used Saturday Night Science to analyze California’s most recent Census data to determine the blackest cities in California based on the percentage of Black residents. Here are the results of our analysis:
-
The city with the largest African American population in California is Inglewood based on the most recent Census data.
-
Inglewood is 38.87% Black.
-
The least African American city in California is Los Altos Hills.
-
Los Altos Hills is 0.0% Black.
-
California is 5.3% Black.
-
California is the 29th blackest state in the United States.
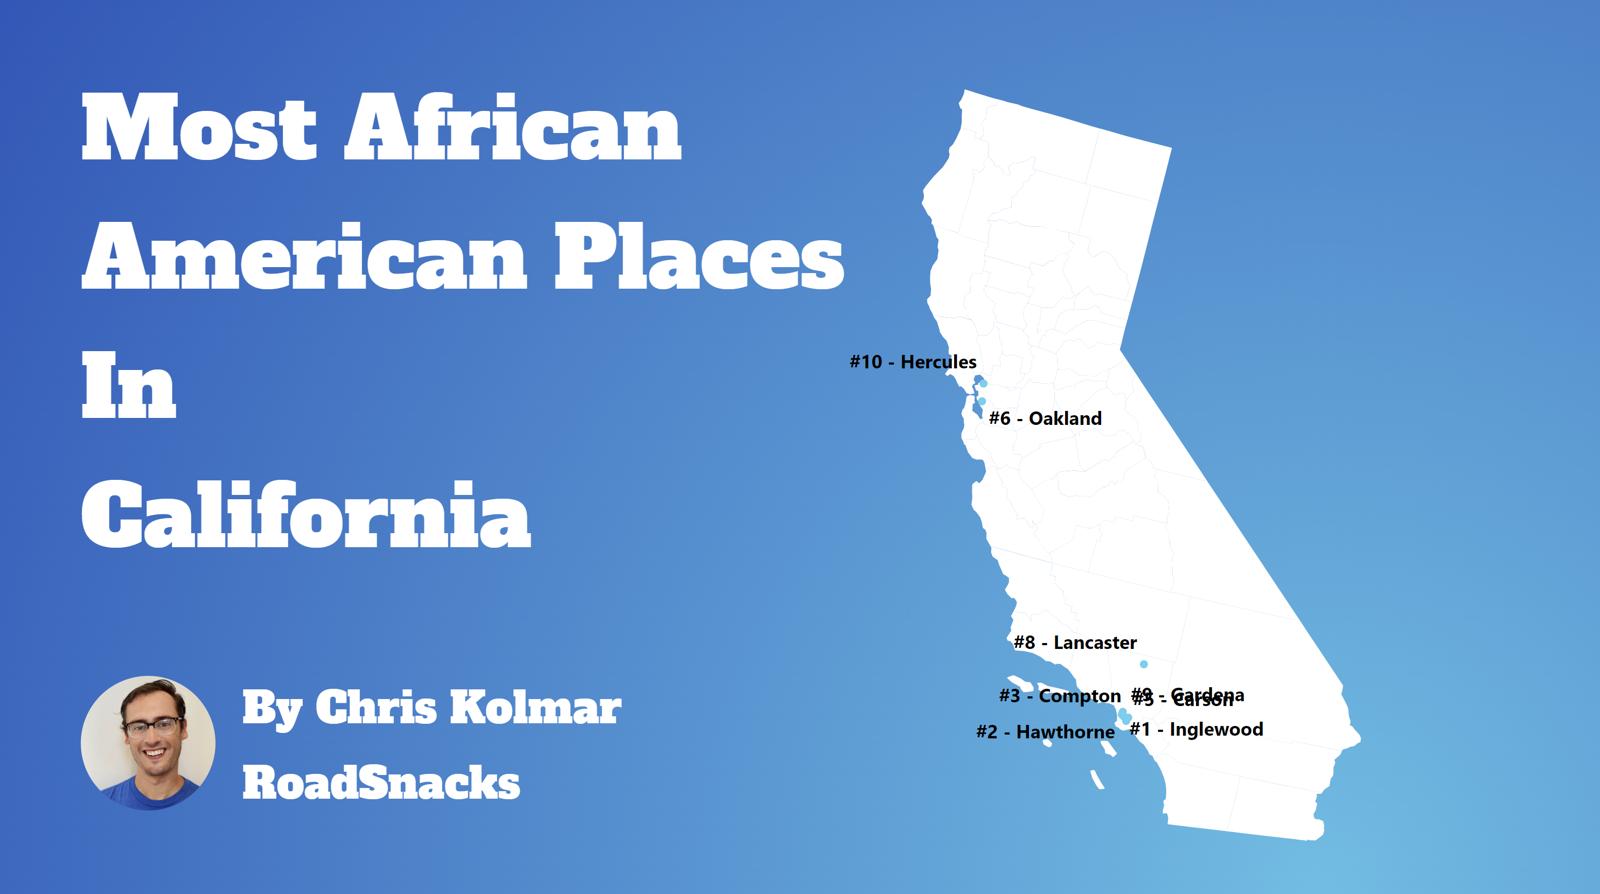
Table Of Contents: Top Ten | Methodology | Summary | Table
The Black community is one of the fastest-growing communities in America this decade.
Roughly 42 million people identifying as Black or African American live in the United States, making up 12% of the total population. According to the most recent American Community Survey, the Black population in California is 2,076,395 – at 5.3% of the total population of California.
The percentage growth of Blacks in America is the third largest percentage change for any race according to the Census’s race and ethnicity definition. Most scholars and historians agree that increasing diversity in America is a good thing.
We agree.
But how has the increase in the black population impacted California? Which cities and towns in California have seen the greatest increase in its Black population?
We broke down the most recent census data to determine the cities in California with the largest African American population in 2025:
Most African American Places In California
What’s the blackest city in California? The city with the largest Black population in California for 2025 is Inglewood. See if Inglewood ranked as one of the most african american places in America.
And if you already knew these places were Black, check out the best places to live in California or the most diverse places in California.
The 10 Blackest Cities In California For 2025
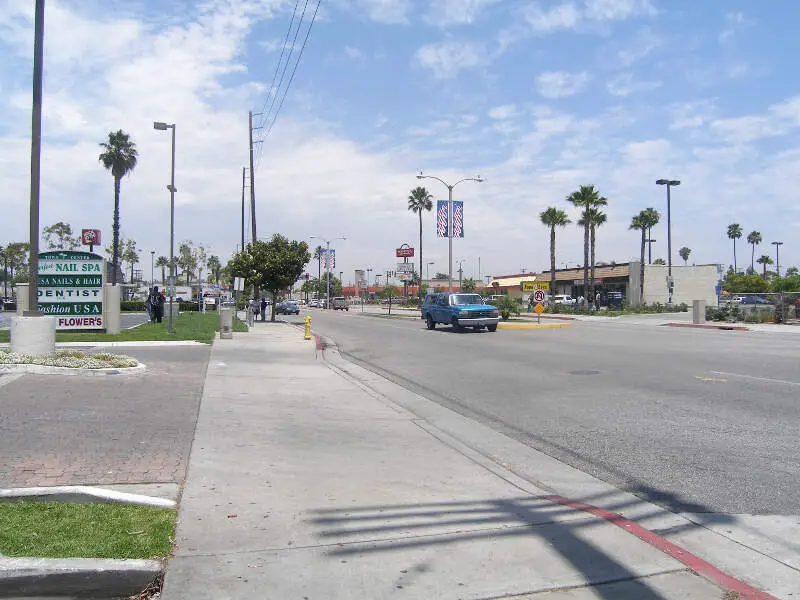
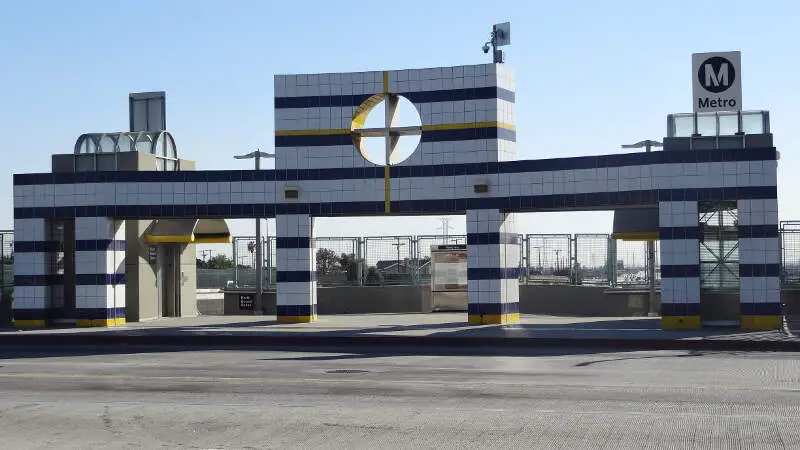
1. Inglewood
/10
Population: 105,575
% African American: 38.87%
# Of African American Residents: 41,036
Percent Change Since 2010: -12.81%
More on Inglewood: Data
2. Compton
/10
Population: 93,525
% African American: 24.92%
# Of African American Residents: 23,309
Percent Change Since 2010: -25.96%
More on Compton: Data
3. Hawthorne
/10
Population: 85,933
% African American: 24.57%
# Of African American Residents: 21,112
Percent Change Since 2010: -10.49%
More on Hawthorne: Data
4. Carson
/10
Population: 93,523
% African American: 22.28%
# Of African American Residents: 20,838
Percent Change Since 2010: -0.31%
More on Carson: Data
5. California City
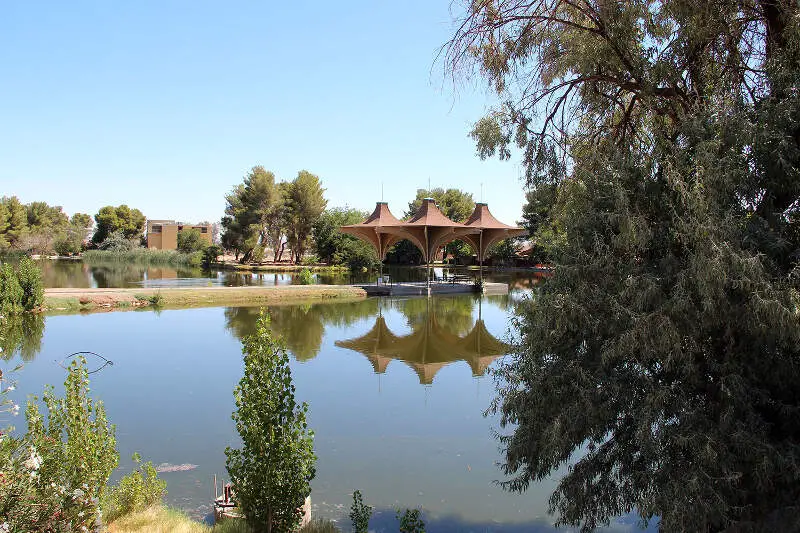
/10
Population: 14,821
% African American: 22.26%
# Of African American Residents: 3,299
Percent Change Since 2010: 85.03%
More on California City: Data
6. Lancaster
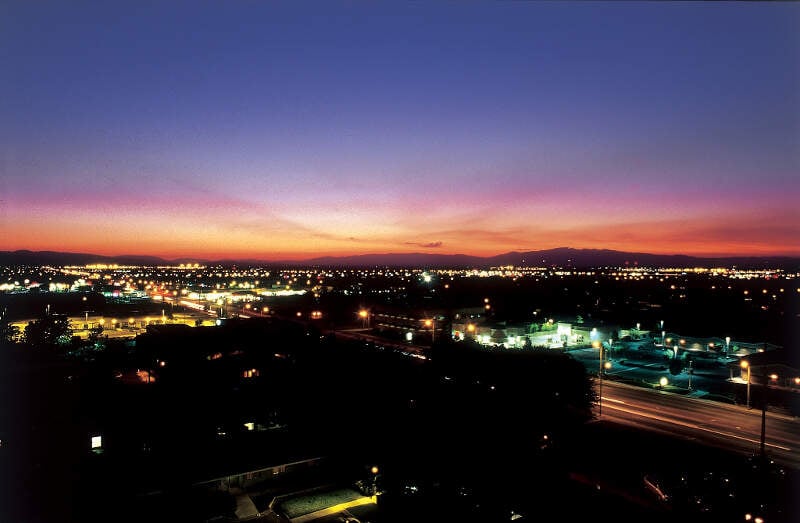
/10
Population: 170,013
% African American: 21.0%
# Of African American Residents: 35,707
Percent Change Since 2010: 28.4%
More on Lancaster: Data
7. Oakland
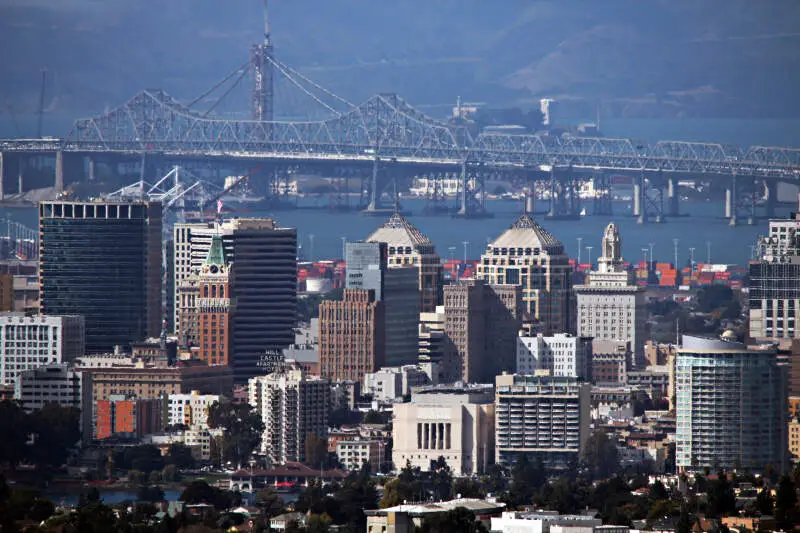
/10
Population: 438,072
% African American: 20.54%
# Of African American Residents: 89,973
Percent Change Since 2010: -17.06%
More on Oakland: Data
8. Suisun City
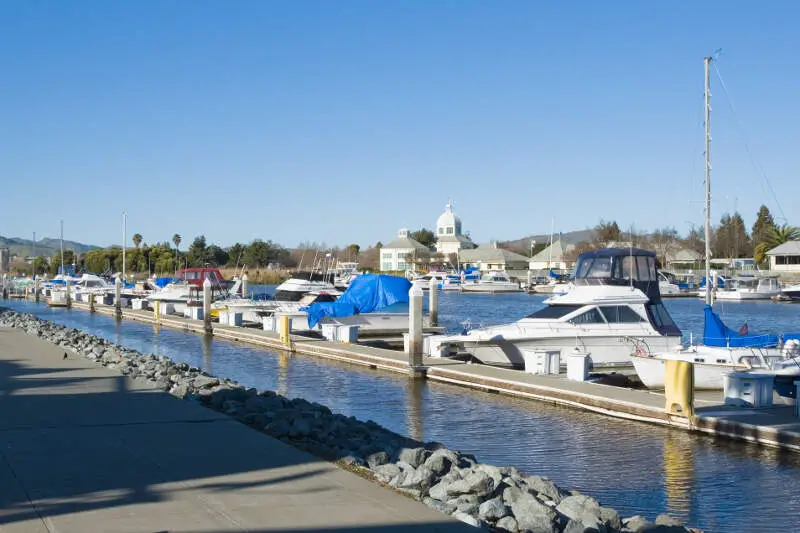
/10
Population: 29,205
% African American: 20.26%
# Of African American Residents: 5,918
Percent Change Since 2010: 3.97%
More on Suisun City: Data
9. Antioch
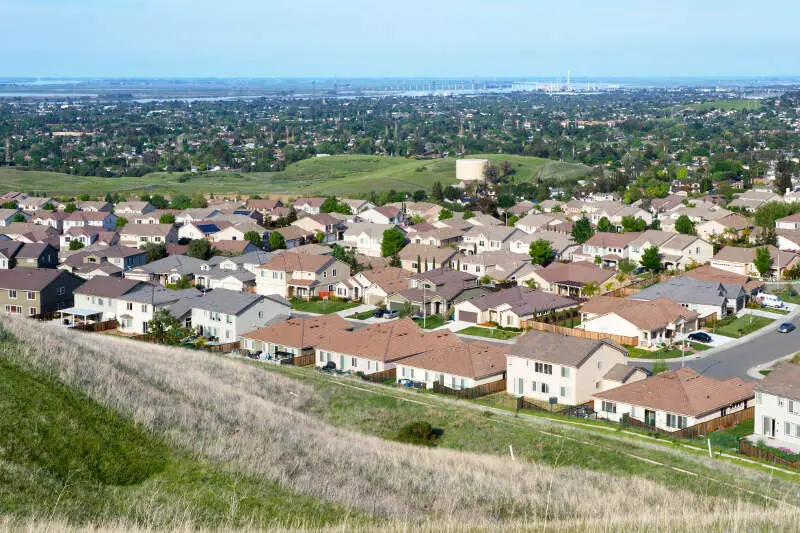
/10
Population: 115,759
% African American: 19.13%
# Of African American Residents: 22,142
Percent Change Since 2010: 33.76%
More on Antioch: Data
10. Gardena
/10
Population: 59,765
% African American: 18.45%
# Of African American Residents: 11,028
Percent Change Since 2010: -15.23%
More on Gardena: Data
Methodology: How We Determined The Cities In California With The Largest Black Population For 2025
We still believe in the accuracy of data — especially from the Census. So that’s where we went to get the race breakdown across California.
That leads us to the Census’s most recently available data, the 2019-2023 American Community Survey data from the US Census.
Specifically, we looked at table B03002: Hispanic OR LATINO ORIGIN BY RACE. Here are the category names as defined by the Census:
- Hispanic or Latino
- White alone*
- Black or African American alone*
- American Indian and Alaska Native alone*
- Asian alone*
- Native Hawaiian and Other Pacific Islander alone*
- Some other race alone*
- Two or more races*
Our particular column of interest was the number of people who identified as Black or African American.
We limited our analysis to non-CDPs with a population greater than 5,000 people in California. That left us with 421 cities.
We then calculated the percentage of residents that are Black or African American. The percentages ranked from 38.9% to 0.0%.
Finally, we ranked each city based on the percentage of the Black population, with a higher score being more Black than a lower score. Inglewood took the distinction of being the most Black, while Los Altos Hills was the least African American city.
We updated this article for 2025. This is our tenth time ranking the cities in California with the largest African American population.
Read on for more information on how the cities in California ranked by population of African American residents or, for a more general take on diversity in America, head over to our ranking of the most diverse cities in America.
Summary: Black Populations Across California
If you’re looking for a breakdown of African American populations across California according to the most recent data, this is an accurate list.
The blackest cities in California are Inglewood, Compton, Hawthorne, Carson, California City, Lancaster, Oakland, Suisun City, Antioch, and Gardena.
If you’re curious enough, here are the least African American places in California:
- Los Altos Hills
- Guadalupe
- Fort Bragg
For more California reading, check out:
- Worst Places To Live In California
- Best Places To Raise A Family In California
- Cheapest Places To Live In California
African American Population By City In California
| Rank | City | Population | African American Population | % African American |
|---|---|---|---|---|
| 1 | Inglewood | 105,575 | 41,036 | 38.87% |
| 2 | Compton | 93,525 | 23,309 | 24.92% |
| 3 | Hawthorne | 85,933 | 21,112 | 24.57% |
| 4 | Carson | 93,523 | 20,838 | 22.28% |
| 5 | California City | 14,821 | 3,299 | 22.26% |
| 6 | Lancaster | 170,013 | 35,707 | 21.0% |
| 7 | Oakland | 438,072 | 89,973 | 20.54% |
| 8 | Suisun City | 29,205 | 5,918 | 20.26% |
| 9 | Antioch | 115,759 | 22,142 | 19.13% |
| 10 | Gardena | 59,765 | 11,028 | 18.45% |
| 11 | Hercules | 26,245 | 4,817 | 18.35% |
| 12 | Barstow | 25,198 | 4,616 | 18.32% |
| 13 | Emeryville | 12,756 | 2,202 | 17.26% |
| 14 | Moreno Valley | 210,378 | 35,962 | 17.09% |
| 15 | Vallejo | 124,637 | 21,175 | 16.99% |
| 16 | Richmond | 115,396 | 19,455 | 16.86% |
| 17 | Victorville | 135,983 | 22,629 | 16.64% |
| 18 | Adelanto | 38,010 | 5,789 | 15.23% |
| 19 | Fairfield | 119,985 | 17,988 | 14.99% |
| 20 | Lemon Grove | 27,489 | 4,040 | 14.7% |
| 21 | Pittsburg | 75,868 | 10,505 | 13.85% |
| 22 | Palmdale | 165,487 | 21,523 | 13.01% |
| 23 | Rialto | 103,866 | 12,780 | 12.3% |
| 24 | East Palo Alto | 29,143 | 3,478 | 11.93% |
| 25 | Sacramento | 524,802 | 61,594 | 11.74% |
| 26 | Pinole | 18,835 | 2,177 | 11.56% |
| 27 | Long Beach | 458,491 | 52,644 | 11.48% |
| 28 | Susanville | 14,992 | 1,718 | 11.46% |
| 29 | Bellflower | 77,396 | 8,722 | 11.27% |
| 30 | San Bernardino | 221,774 | 24,863 | 11.21% |
| 31 | Blythe | 17,824 | 1,995 | 11.19% |
| 32 | Stockton | 320,470 | 35,126 | 10.96% |
| 33 | San Pablo | 31,771 | 3,470 | 10.92% |
| 34 | Rancho Cordova | 80,656 | 8,528 | 10.57% |
| 35 | Elk Grove | 177,221 | 18,675 | 10.54% |
| 36 | Rio Vista | 10,002 | 1,037 | 10.37% |
| 37 | Crescent City | 6,180 | 630 | 10.19% |
| 38 | Calipatria | 6,549 | 648 | 9.89% |
| 39 | Twentynine Palms | 28,738 | 2,783 | 9.68% |
| 40 | San Leandro | 88,531 | 8,416 | 9.51% |
| 41 | Corcoran | 22,626 | 2,146 | 9.48% |
| 42 | Brentwood | 64,609 | 6,098 | 9.44% |
| 43 | Hemet | 90,646 | 7,992 | 8.82% |
| 44 | Hayward | 159,201 | 13,863 | 8.71% |
| 45 | Beaumont | 54,817 | 4,720 | 8.61% |
| 46 | Oakley | 44,311 | 3,815 | 8.61% |
| 47 | Paramount | 52,546 | 4,497 | 8.56% |
| 48 | Vacaville | 102,085 | 8,716 | 8.54% |
| 49 | Perris | 79,349 | 6,599 | 8.32% |
| 50 | Lynwood | 65,291 | 5,418 | 8.3% |
| 51 | Los Angeles | 3,857,897 | 316,317 | 8.2% |
| 52 | Fontana | 211,921 | 17,300 | 8.16% |
| 53 | Desert Hot Springs | 32,786 | 2,675 | 8.16% |
| 54 | Colton | 53,798 | 4,383 | 8.15% |
| 55 | La Mesa | 60,835 | 4,900 | 8.05% |
| 56 | Rancho Cucamonga | 174,693 | 14,041 | 8.04% |
| 57 | Culver City | 39,993 | 3,109 | 7.77% |
| 58 | Lakewood | 80,510 | 6,257 | 7.77% |
| 59 | Signal Hill | 11,563 | 855 | 7.39% |
| 60 | Pasadena | 136,462 | 10,090 | 7.39% |
| 61 | Soledad | 24,476 | 1,783 | 7.28% |
| 62 | Apple Valley | 75,478 | 5,421 | 7.18% |
| 63 | Lathrop | 32,696 | 2,331 | 7.13% |
| 64 | Berkeley | 120,223 | 8,556 | 7.12% |
| 65 | Lemoore | 27,023 | 1,916 | 7.09% |
| 66 | Loma Linda | 25,021 | 1,712 | 6.84% |
| 67 | Menifee | 107,020 | 7,314 | 6.83% |
| 68 | Chino | 91,775 | 6,224 | 6.78% |
| 69 | Tehachapi | 12,366 | 828 | 6.7% |
| 70 | Cerritos | 48,340 | 3,143 | 6.5% |
| 71 | Fresno | 543,615 | 34,477 | 6.34% |
| 72 | Banning | 30,680 | 1,904 | 6.21% |
| 73 | Monrovia | 37,553 | 2,295 | 6.11% |
| 74 | Marina | 22,324 | 1,364 | 6.11% |
| 75 | Ontario | 178,347 | 10,763 | 6.03% |
| 76 | Upland | 78,940 | 4,735 | 6.0% |
| 77 | Lawndale | 31,113 | 1,858 | 5.97% |
| 78 | El Cajon | 104,909 | 6,246 | 5.95% |
| 79 | Alameda | 76,876 | 4,572 | 5.95% |
| 80 | Tracy | 95,358 | 5,608 | 5.88% |
| 81 | Chowchilla | 18,876 | 1,099 | 5.82% |
| 82 | Bakersfield | 408,366 | 23,518 | 5.76% |
| 83 | Riverside | 316,241 | 18,079 | 5.72% |
| 84 | Lake Elsinore | 71,516 | 4,074 | 5.7% |
| 85 | Claremont | 36,553 | 2,052 | 5.61% |
| 86 | American Canyon | 21,698 | 1,216 | 5.6% |
| 87 | Redlands | 72,985 | 4,017 | 5.5% |
| 88 | San Jacinto | 54,756 | 2,964 | 5.41% |
| 89 | San Diego | 1,385,061 | 74,890 | 5.41% |
| 90 | Hanford | 59,389 | 3,204 | 5.39% |
| 91 | Highland | 56,690 | 3,039 | 5.36% |
| 92 | Union City | 68,141 | 3,581 | 5.26% |
| 93 | Palm Springs | 44,998 | 2,356 | 5.24% |
| 94 | Sierra Madre | 11,020 | 573 | 5.2% |
| 95 | Artesia | 16,044 | 812 | 5.06% |
| 96 | Chula Vista | 275,030 | 13,770 | 5.01% |
| 97 | Folsom | 82,140 | 4,110 | 5.0% |
| 98 | Pomona | 148,391 | 7,417 | 5.0% |
| 99 | Corona | 158,839 | 7,814 | 4.92% |
| 100 | Duarte | 21,921 | 1,078 | 4.92% |
You have not added Baldwin Hills, View park-windsor Hills, and Ladera. All of these have a higher percentage of African-American population than any of these cities listed in this article. All three of these are in Los Angeles, and have 78% or above of African American population. These are middle class to upper middle class African-American areas. So, I questioned the research on this article.
Thank you for this data. I am looking for middle class African American neighborhoods in California. Also, what about Rancho Cucamonga? There is a high African American population there as well.
Rancho Cucamonga has about a 12% African American population. It is nice in Rancho Cucamonga along with reasonable purchase and rental prices. The shopping is very nice with any kind of shops you can think of. Rancho Cucamonga is a place where you can live, work, and play. There are many business buildings with major companies hiring. Rancho Cucamonga is a nice place for African Americans.
Yes, Baldwin Hills, View Park-Windsor Hills, Ladera, and Leimert Park also have middle class African American areas. It ranges from middle to upper middles class neighborhoods.