
Most African American cities in Colorado research summary. We used Saturday Night Science to analyze Colorado’s most recent Census data to determine the blackest cities in Colorado based on the percentage of Black residents. Here are the results of our analysis:
-
The city with the largest African American population in Colorado is Aurora based on the most recent Census data.
-
Aurora is 15.31% Black.
-
The least African American city in Colorado is Salida.
-
Salida is 0.0% Black.
-
Colorado is 3.8% Black.
-
Colorado is the 35th blackest state in the United States.
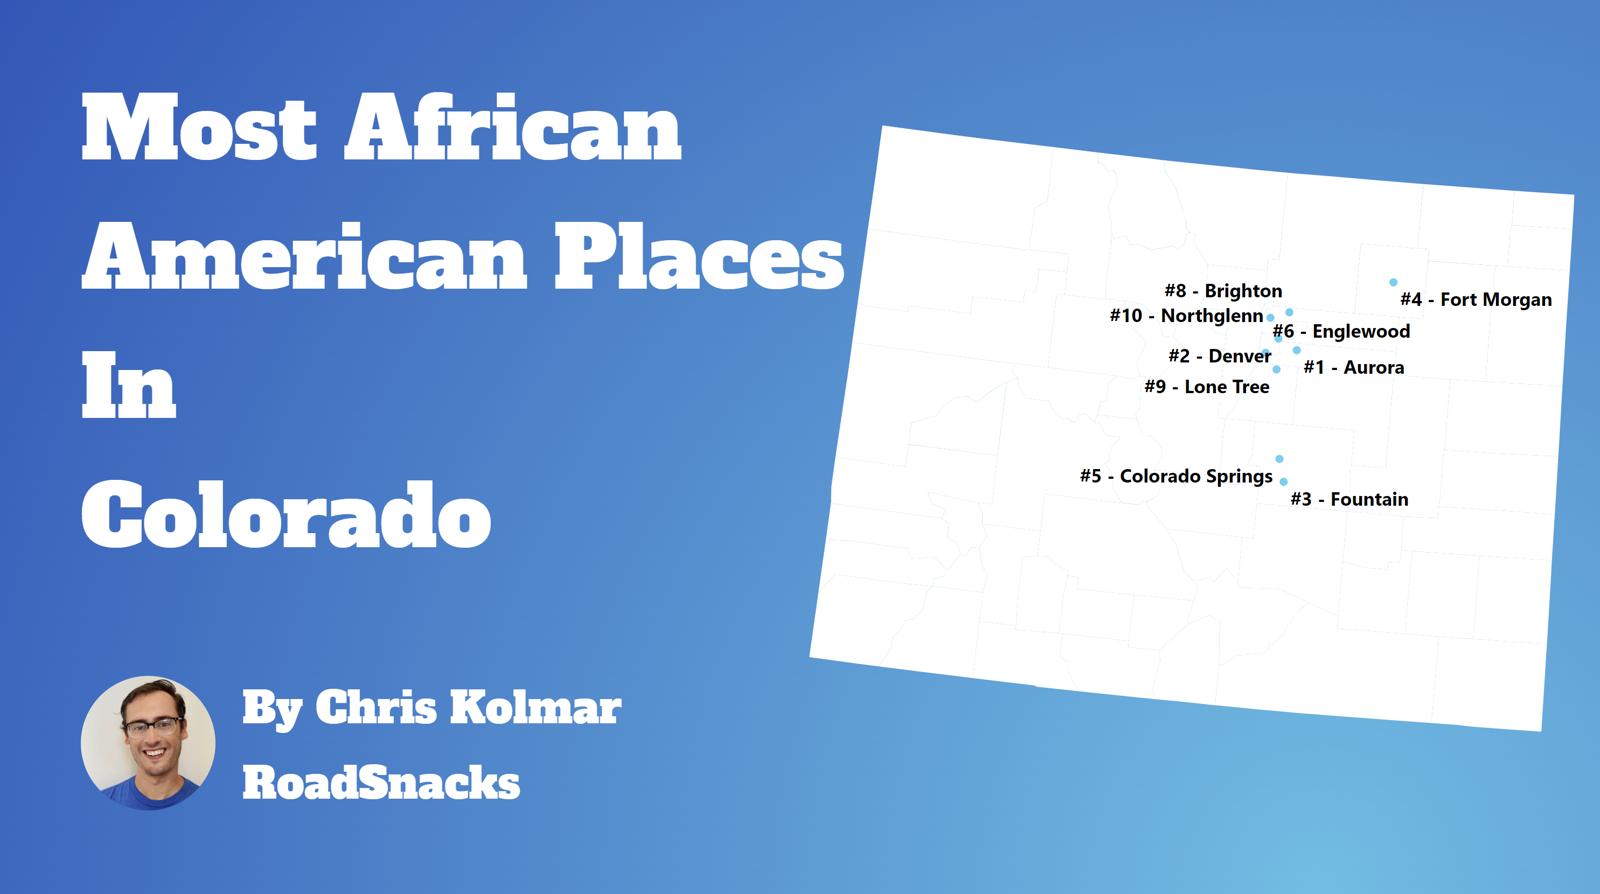
Table Of Contents: Top Ten | Methodology | Summary | Table
The Black community is one of the fastest-growing communities in America this decade.
Roughly 42 million people identifying as Black or African American live in the United States, making up 12% of the total population. According to the most recent American Community Survey, the Black population in Colorado is 220,577 – at 3.8% of the total population of Colorado.
The percentage growth of Blacks in America is the third largest percentage change for any race according to the Census’s race and ethnicity definition. Most scholars and historians agree that increasing diversity in America is a good thing.
We agree.
But how has the increase in the black population impacted Colorado? Which cities and towns in Colorado have seen the greatest increase in its Black population?
We broke down the most recent census data to determine the cities in Colorado with the largest African American population in 2025:
Most African American Places In Colorado
What’s the blackest city in Colorado? The city with the largest Black population in Colorado for 2025 is Aurora. See if Aurora ranked as one of the most african american places in America.
And if you already knew these places were Black, check out the best places to live in Colorado or the most diverse places in Colorado.
The 10 Blackest Cities In Colorado For 2025
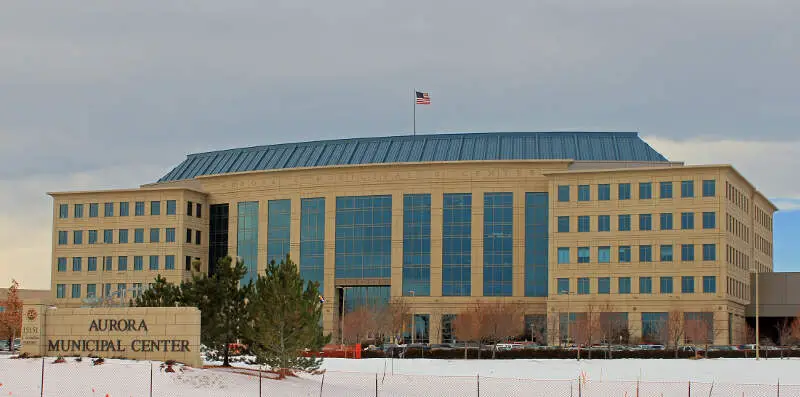
1. Aurora
/10
Population: 390,201
% African American: 15.31%
# Of African American Residents: 59,757
Percent Change Since 2010: 28.22%
More on Aurora: Data
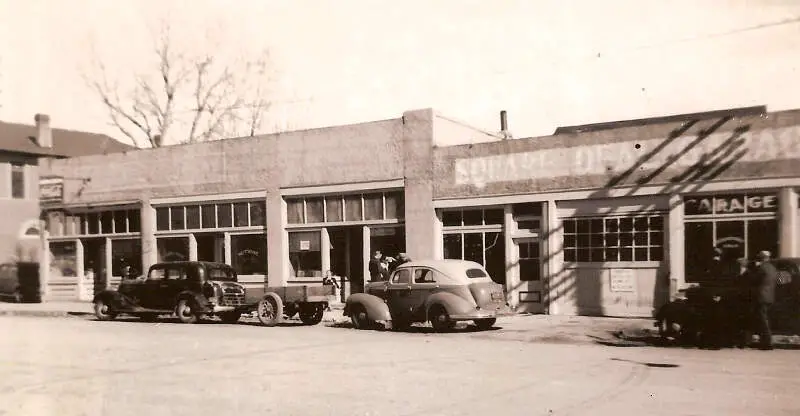
2. Fountain
/10
Population: 29,327
% African American: 9.13%
# Of African American Residents: 2,677
Percent Change Since 2010: 31.16%
More on Fountain: Data
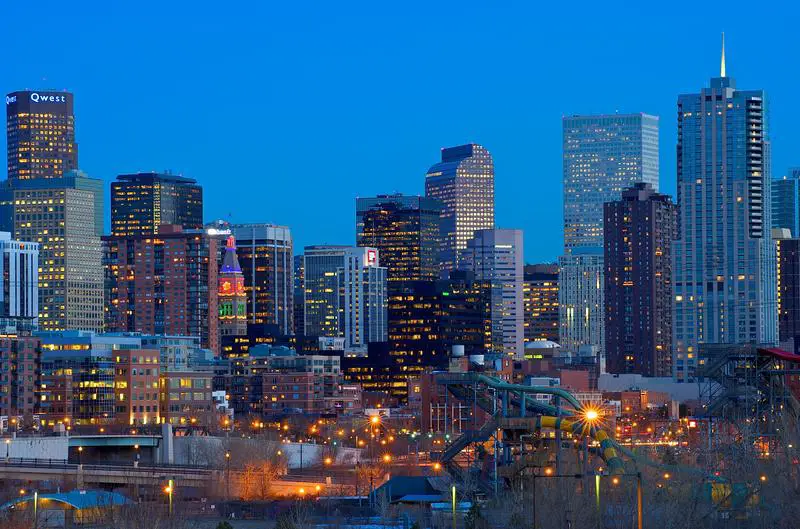
3. Denver
/10
Population: 713,734
% African American: 8.48%
# Of African American Residents: 60,519
Percent Change Since 2010: 3.95%
More on Denver: Data
4. Fort Morgan
/10
Population: 11,521
% African American: 7.02%
# Of African American Residents: 809
Percent Change Since 2010: 34.16%
More on Fort Morgan: Data
5. Colorado Springs
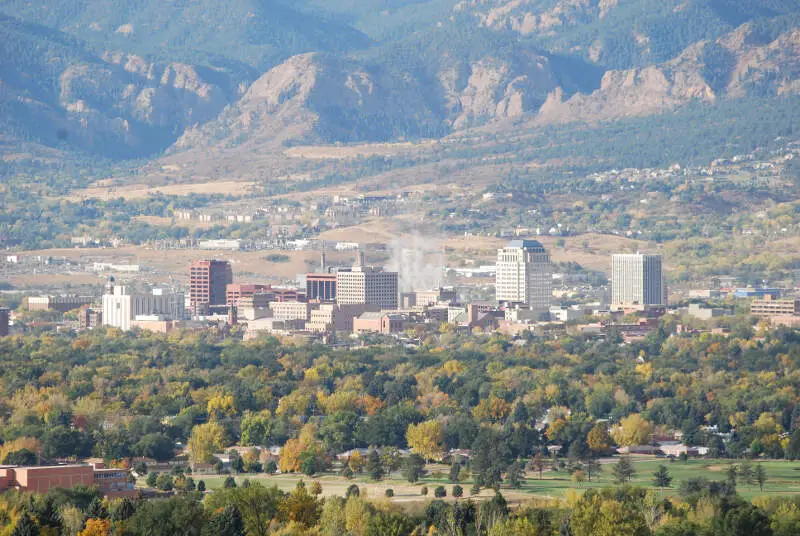
/10
Population: 483,099
% African American: 5.36%
# Of African American Residents: 25,906
Percent Change Since 2010: 11.08%
More on Colorado Springs: Data
6. Lone Tree
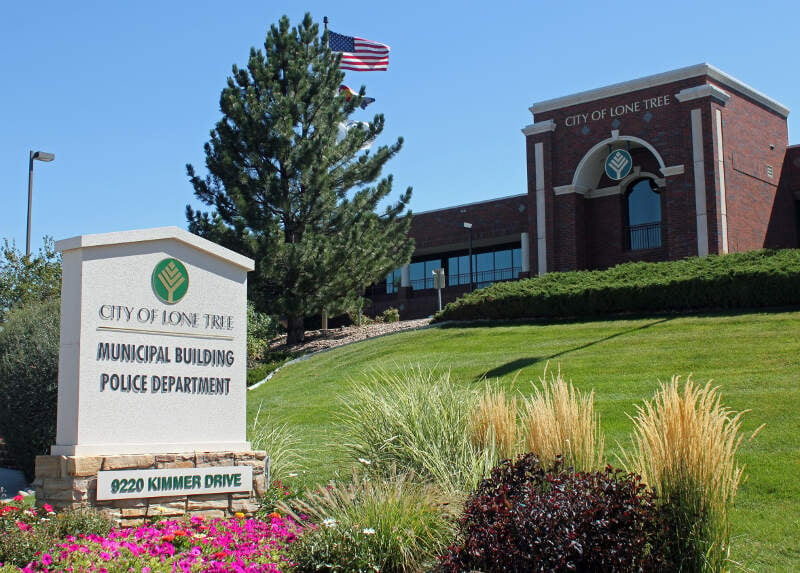
/10
Population: 14,136
% African American: 4.76%
# Of African American Residents: 673
Percent Change Since 2010: 506.31%
More on Lone Tree: Data
7. Commerce City
/10
Population: 64,640
% African American: 4.42%
# Of African American Residents: 2,856
Percent Change Since 2010: 208.42%
More on Commerce City: Data
8. Englewood
/10
Population: 33,774
% African American: 3.88%
# Of African American Residents: 1,310
Percent Change Since 2010: 93.22%
More on Englewood: Data
9. Sheridan
/10
Population: 6,031
% African American: 3.6%
# Of African American Residents: 217
Percent Change Since 2010: -9.96%
More on Sheridan: Data
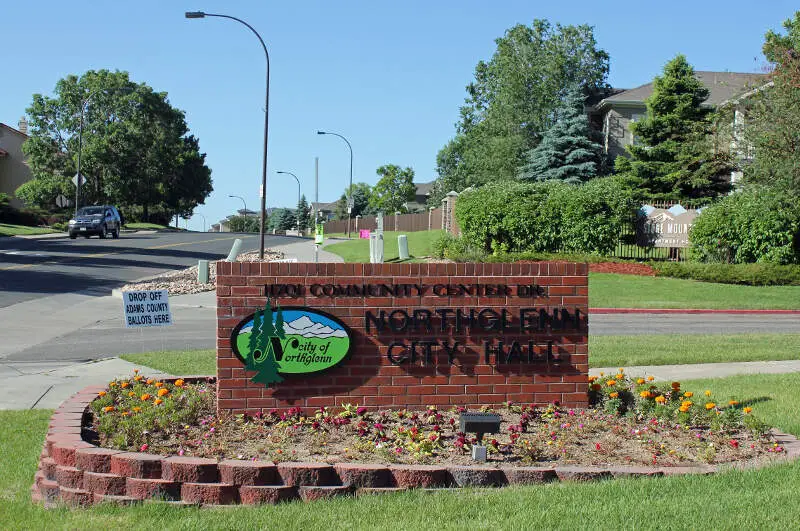
10. Northglenn
/10
Population: 37,953
% African American: 3.02%
# Of African American Residents: 1,145
Percent Change Since 2010: 92.76%
More on Northglenn: Data
Methodology: How We Determined The Cities In Colorado With The Largest Black Population For 2025
We still believe in the accuracy of data — especially from the Census. So that’s where we went to get the race breakdown across Colorado.
That leads us to the Census’s most recently available data, the 2019-2023 American Community Survey data from the US Census.
Specifically, we looked at table B03002: Hispanic OR LATINO ORIGIN BY RACE. Here are the category names as defined by the Census:
- Hispanic or Latino
- White alone*
- Black or African American alone*
- American Indian and Alaska Native alone*
- Asian alone*
- Native Hawaiian and Other Pacific Islander alone*
- Some other race alone*
- Two or more races*
Our particular column of interest was the number of people who identified as Black or African American.
We limited our analysis to non-CDPs with a population greater than 5,000 people in Colorado. That left us with 69 cities.
We then calculated the percentage of residents that are Black or African American. The percentages ranked from 15.3% to 0.0%.
Finally, we ranked each city based on the percentage of the Black population, with a higher score being more Black than a lower score. Aurora took the distinction of being the most Black, while Salida was the least African American city.
We updated this article for 2025. This is our tenth time ranking the cities in Colorado with the largest African American population.
Read on for more information on how the cities in Colorado ranked by population of African American residents or, for a more general take on diversity in America, head over to our ranking of the most diverse cities in America.
Summary: Black Populations Across Colorado
If you’re looking for a breakdown of African American populations across Colorado according to the most recent data, this is an accurate list.
The blackest cities in Colorado are Aurora, Fountain, Denver, Fort Morgan, Colorado Springs, Lone Tree, Commerce City, Englewood, Sheridan, and Northglenn.
If you’re curious enough, here are the least African American places in Colorado:
- Salida
- Gypsum
- Milliken
For more Colorado reading, check out:
African American Population By City In Colorado
| Rank | City | Population | African American Population | % African American |
|---|---|---|---|---|
| 1 | Aurora | 390,201 | 59,757 | 15.31% |
| 2 | Fountain | 29,327 | 2,677 | 9.13% |
| 3 | Denver | 713,734 | 60,519 | 8.48% |
| 4 | Fort Morgan | 11,521 | 809 | 7.02% |
| 5 | Colorado Springs | 483,099 | 25,906 | 5.36% |
| 6 | Lone Tree | 14,136 | 673 | 4.76% |
| 7 | Commerce City | 64,640 | 2,856 | 4.42% |
| 8 | Englewood | 33,774 | 1,310 | 3.88% |
| 9 | Sheridan | 6,031 | 217 | 3.6% |
| 10 | Northglenn | 37,953 | 1,145 | 3.02% |
| 11 | Brighton | 41,196 | 1,176 | 2.85% |
| 12 | Centennial | 107,386 | 2,658 | 2.48% |
| 13 | Alamosa | 9,847 | 238 | 2.42% |
| 14 | Greeley | 109,421 | 2,596 | 2.37% |
| 15 | Sterling | 13,273 | 311 | 2.34% |
| 16 | Pueblo | 111,514 | 2,574 | 2.31% |
| 17 | Woodland Park | 7,909 | 165 | 2.09% |
| 18 | Thornton | 142,878 | 2,741 | 1.92% |
| 19 | Cortez | 8,898 | 169 | 1.9% |
| 20 | Evans | 22,265 | 373 | 1.68% |
| 21 | Littleton | 45,092 | 729 | 1.62% |
| 22 | Golden | 20,467 | 309 | 1.51% |
| 23 | Wheat Ridge | 32,158 | 420 | 1.31% |
| 24 | Cherry Hills Village | 6,366 | 82 | 1.29% |
| 25 | Lakewood | 156,309 | 1,993 | 1.28% |
| 26 | Fruita | 13,578 | 162 | 1.19% |
| 27 | La Junta | 7,211 | 86 | 1.19% |
| 28 | Gunnison | 6,712 | 80 | 1.19% |
| 29 | Fort Collins | 169,705 | 2,006 | 1.18% |
| 30 | Parker | 60,115 | 698 | 1.16% |
| 31 | Westminster | 115,546 | 1,278 | 1.11% |
| 32 | Broomfield | 75,110 | 830 | 1.11% |
| 33 | Lamar | 7,629 | 84 | 1.1% |
| 34 | Federal Heights | 14,160 | 153 | 1.08% |
| 35 | Boulder | 106,274 | 1,089 | 1.02% |
| 36 | Windsor | 35,918 | 365 | 1.02% |
| 37 | Arvada | 122,835 | 1,142 | 0.93% |
| 38 | Aspen | 6,862 | 63 | 0.92% |
| 39 | Brush | 5,299 | 48 | 0.91% |
| 40 | Glenwood Springs | 10,171 | 92 | 0.9% |
| 41 | Longmont | 98,958 | 858 | 0.87% |
| 42 | Louisville | 20,788 | 170 | 0.82% |
| 43 | Trinidad | 8,309 | 66 | 0.79% |
| 44 | Castle Rock | 76,614 | 598 | 0.78% |
| 45 | Grand Junction | 67,027 | 496 | 0.74% |
| 46 | Lafayette | 30,471 | 221 | 0.73% |
| 47 | Loveland | 77,350 | 458 | 0.59% |
| 48 | Carbondale | 6,553 | 37 | 0.56% |
| 49 | Greenwood Village | 15,485 | 72 | 0.46% |
| 50 | John | 18,075 | 84 | 0.46% |
| 51 | Berthoud | 11,684 | 50 | 0.43% |
| 52 | Firestone | 17,353 | 74 | 0.43% |
| 53 | Fort Lupton | 8,494 | 34 | 0.4% |
| 54 | Durango | 19,257 | 76 | 0.39% |
| 55 | Estes Park | 5,879 | 23 | 0.39% |
| 56 | Delta | 9,266 | 31 | 0.33% |
| 57 | Superior | 13,136 | 43 | 0.33% |
| 58 | Wellington | 11,538 | 30 | 0.26% |
| 59 | Montrose | 20,703 | 45 | 0.22% |
| 60 | Craig | 9,022 | 17 | 0.19% |
| 61 | Frederick | 15,893 | 21 | 0.13% |
| 62 | Erie | 31,927 | 41 | 0.13% |
| 63 | Rifle | 10,466 | 10 | 0.1% |
| 64 | Eagle | 7,479 | 7 | 0.09% |
| 65 | Steamboat Springs | 13,341 | 7 | 0.05% |
| 66 | Avon | 6,057 | 0 | 0.0% |
| 67 | Milliken | 8,695 | 0 | 0.0% |
| 68 | Gypsum | 8,481 | 0 | 0.0% |
| 69 | Salida | 5,786 | 0 | 0.0% |
Dear Chris Kolmar,
Thanks for this helpful and informative statistical data about Colorado!
I’m African American, and I was born, raised and educated primarily in Denver. I’ve lived and visited many states across the country. However, I’ve returned to Colorado, because no place is better than Denver.
Best wishes,
Thanks! We try to keep the data as up-to-date and accurate as possible. Let me know if there was any other statistics in particular you were looking for.