
Most African American cities in Kentucky research summary. We used Saturday Night Science to analyze Kentucky’s most recent Census data to determine the blackest cities in Kentucky based on the percentage of Black residents. Here are the results of our analysis:
-
The city with the largest African American population in Kentucky is Shively based on the most recent Census data.
-
Shively is 57.78% Black.
-
The least African American city in Kentucky is Flatwoods.
-
Flatwoods is 0.0% Black.
-
Kentucky is 7.8% Black.
-
Kentucky is the 24th blackest state in the United States.
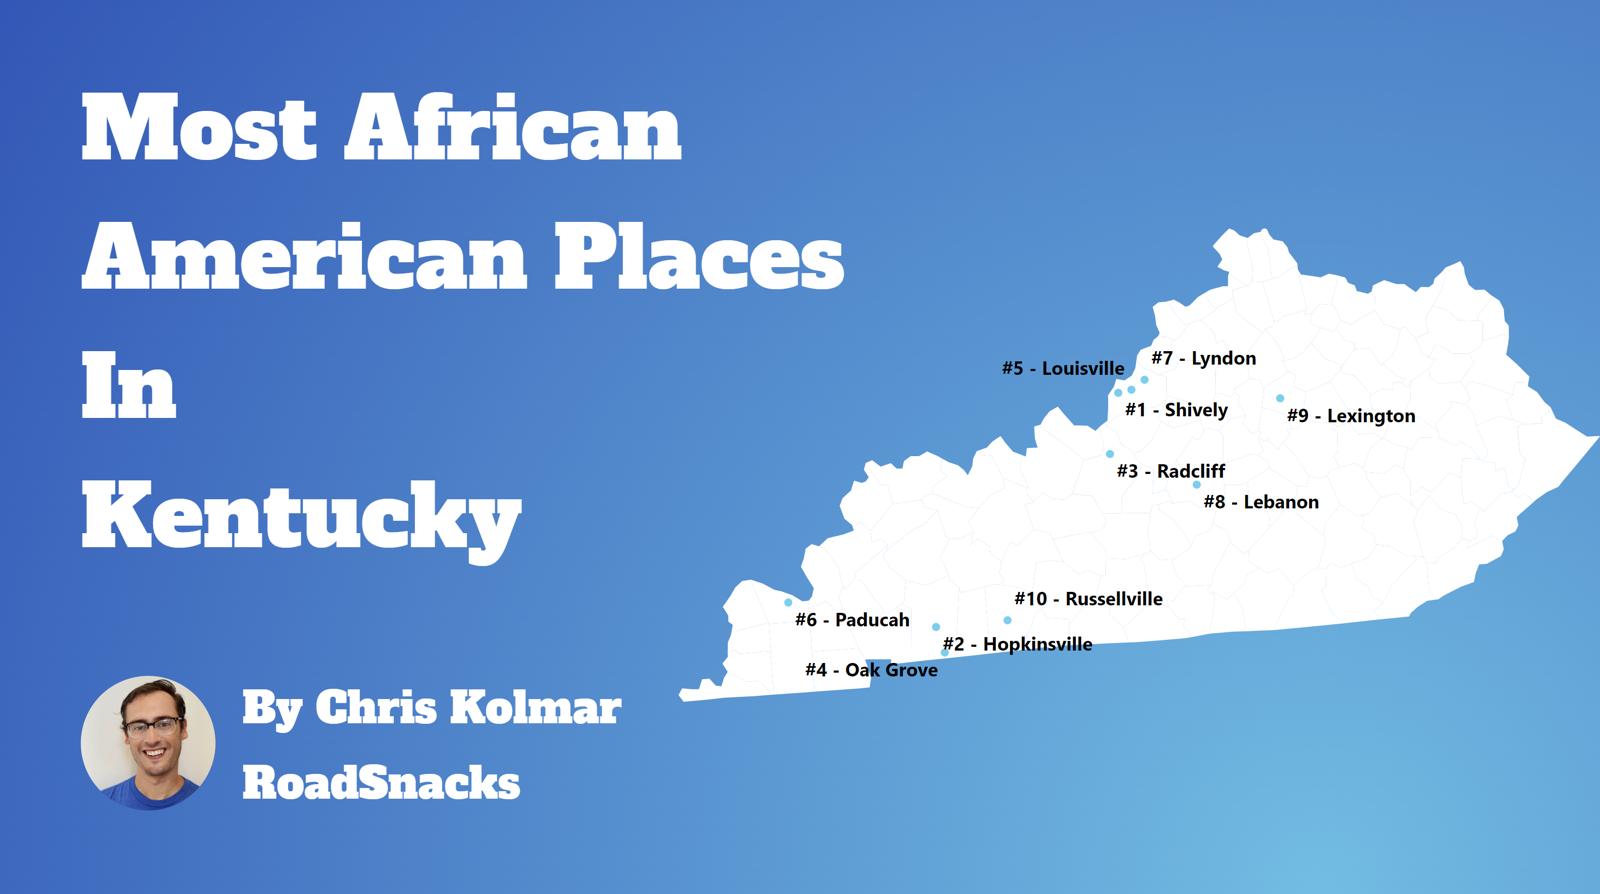
Table Of Contents: Top Ten | Methodology | Summary | Table
The Black community is one of the fastest-growing communities in America this decade.
Roughly 42 million people identifying as Black or African American live in the United States, making up 12% of the total population. According to the most recent American Community Survey, the Black population in Kentucky is 350,442 – at 7.8% of the total population of Kentucky.
The percentage growth of Blacks in America is the third largest percentage change for any race according to the Census’s race and ethnicity definition. Most scholars and historians agree that increasing diversity in America is a good thing.
We agree.
But how has the increase in the black population impacted Kentucky? Which cities and towns in Kentucky have seen the greatest increase in its Black population?
We broke down the most recent census data to determine the cities in Kentucky with the largest African American population in 2025:
What’s the blackest city in Kentucky? The city with the largest Black population in Kentucky for 2025 is Shively. See if Shively ranked as one of the most african american places in America.
And if you already knew these places were Black, check out the best places to live in Kentucky or the most diverse places in Kentucky.
The 10 Blackest Cities In Kentucky For 2025
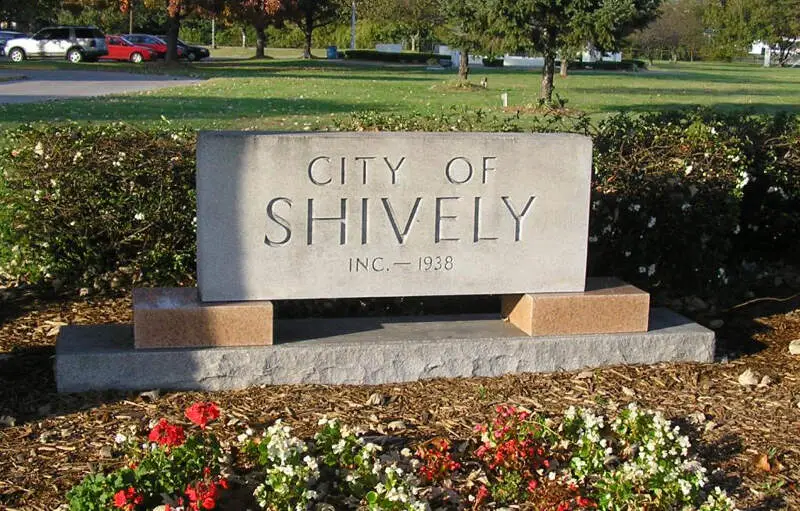
1. Shively
/10
Population: 15,556
% African American: 57.78%
# Of African American Residents: 8,989
Percent Change Since 2010: 27.76%
More on Shively: Data
2. Hopkinsville
/10
Population: 31,011
% African American: 27.44%
# Of African American Residents: 8,510
Percent Change Since 2010: -17.19%
More on Hopkinsville: Data
3. Radcliff
/10
Population: 22,967
% African American: 23.91%
# Of African American Residents: 5,492
Percent Change Since 2010: 1.87%
More on Radcliff: Data
4. Louisville/jefferson County Metro Government (Balance)

/10
Population: 627,210
% African American: 23.37%
# Of African American Residents: 146,602
Percent Change Since 2010: 11.9%
More on Louisville/jefferson County Metro Government (Balance):
5. Oak Grove
/10
Population: 7,945
% African American: 21.18%
# Of African American Residents: 1,683
Percent Change Since 2010: 9.29%
More on Oak Grove: Data
6. Paducah
/10
Population: 26,894
% African American: 20.12%
# Of African American Residents: 5,410
Percent Change Since 2010: -7.43%
More on Paducah: Data
7. Lebanon
/10
Population: 6,364
% African American: 16.07%
# Of African American Residents: 1,023
Percent Change Since 2010: 4.6%
More on Lebanon: Data
8. Lyndon
/10
Population: 10,956
% African American: 15.89%
# Of African American Residents: 1,741
Percent Change Since 2010: 25.89%
More on Lyndon: Data
9. Lexington-Fayette Urban County

/10
Population: 321,122
% African American: 14.31%
# Of African American Residents: 45,939
Percent Change Since 2010: 12.12%
More on Lexington-Fayette Urban County:
10. Frankfort
/10
Population: 28,452
% African American: 13.93%
# Of African American Residents: 3,963
Percent Change Since 2010: 1.98%
More on Frankfort: Data
Methodology: How We Determined The Cities In Kentucky With The Largest Black Population For 2025
We still believe in the accuracy of data — especially from the Census. So that’s where we went to get the race breakdown across Kentucky.
That leads us to the Census’s most recently available data, the 2019-2023 American Community Survey data from the US Census.
Specifically, we looked at table B03002: Hispanic OR LATINO ORIGIN BY RACE. Here are the category names as defined by the Census:
- Hispanic or Latino
- White alone*
- Black or African American alone*
- American Indian and Alaska Native alone*
- Asian alone*
- Native Hawaiian and Other Pacific Islander alone*
- Some other race alone*
- Two or more races*
Our particular column of interest was the number of people who identified as Black or African American.
We limited our analysis to non-CDPs with a population greater than 5,000 people in Kentucky. That left us with 75 cities.
We then calculated the percentage of residents that are Black or African American. The percentages ranked from 57.8% to 0.0%.
Finally, we ranked each city based on the percentage of the Black population, with a higher score being more Black than a lower score. Shively took the distinction of being the most Black, while Flatwoods was the least African American city.
We updated this article for 2025. This is our tenth time ranking the cities in Kentucky with the largest African American population.
Read on for more information on how the cities in Kentucky ranked by population of African American residents or, for a more general take on diversity in America, head over to our ranking of the most diverse cities in America.
Summary: Black Populations Across Kentucky
If you’re looking for a breakdown of African American populations across Kentucky according to the most recent data, this is an accurate list.
The blackest cities in Kentucky are Shively, Hopkinsville, Radcliff, Louisville/Jefferson County metro government (balance), Oak Grove, Paducah, Lebanon, Lyndon, Lexington-Fayette urban county, and Frankfort.
If you’re curious enough, here are the least African American places in Kentucky:
- Flatwoods
- Union
- Mount Washington
For more Kentucky reading, check out:
African American Population By City In Kentucky
| Rank | City | Population | African American Population | % African American |
|---|---|---|---|---|
| 1 | Shively | 15,556 | 8,989 | 57.78% |
| 2 | Hopkinsville | 31,011 | 8,510 | 27.44% |
| 3 | Radcliff | 22,967 | 5,492 | 23.91% |
| 4 | Louisville/jefferson County Metro Government (Balance) | 627,210 | 146,602 | 23.37% |
| 5 | Oak Grove | 7,945 | 1,683 | 21.18% |
| 6 | Paducah | 26,894 | 5,410 | 20.12% |
| 7 | Lebanon | 6,364 | 1,023 | 16.07% |
| 8 | Lyndon | 10,956 | 1,741 | 15.89% |
| 9 | Lexington-Fayette Urban County | 321,122 | 45,939 | 14.31% |
| 10 | Frankfort | 28,452 | 3,963 | 13.93% |
| 11 | Bardstown | 13,673 | 1,821 | 13.32% |
| 12 | Middletown | 9,622 | 1,256 | 13.05% |
| 13 | Bowling Green | 73,638 | 9,354 | 12.7% |
| 14 | Mayfield | 9,905 | 1,250 | 12.62% |
| 15 | Jeffersontown | 28,988 | 3,604 | 12.43% |
| 16 | Elizabethtown | 31,870 | 3,812 | 11.96% |
| 17 | Madisonville | 19,442 | 2,261 | 11.63% |
| 18 | Danville | 17,235 | 1,851 | 10.74% |
| 19 | Douglass Hills | 5,437 | 581 | 10.69% |
| 20 | Russellville | 7,244 | 751 | 10.37% |
| 21 | Henderson | 27,994 | 2,898 | 10.35% |
| 22 | Campbellsville | 11,523 | 1,122 | 9.74% |
| 23 | Covington | 40,902 | 3,852 | 9.42% |
| 24 | Princeton | 6,242 | 586 | 9.39% |
| 25 | Franklin | 10,254 | 905 | 8.83% |
| 26 | Shelbyville | 17,436 | 1,472 | 8.44% |
| 27 | Harrodsburg | 9,126 | 764 | 8.37% |
| 28 | Glasgow | 15,141 | 1,252 | 8.27% |
| 29 | Paris | 10,107 | 827 | 8.18% |
| 30 | Winchester | 19,133 | 1,383 | 7.23% |
| 31 | Versailles | 10,382 | 739 | 7.12% |
| 32 | Maysville | 8,778 | 593 | 6.76% |
| 33 | Murray | 17,888 | 1,206 | 6.74% |
| 34 | Owensboro | 60,112 | 3,856 | 6.41% |
| 35 | Elsmere | 9,151 | 566 | 6.19% |
| 36 | Florence | 32,334 | 1,941 | 6.0% |
| 37 | Newport | 14,039 | 829 | 5.9% |
| 38 | Georgetown | 38,206 | 2,196 | 5.75% |
| 39 | St. Matthews | 17,491 | 979 | 5.6% |
| 40 | Richmond | 35,498 | 1,820 | 5.13% |
| 41 | Hillview | 8,735 | 432 | 4.95% |
| 42 | Mount Sterling | 7,549 | 363 | 4.81% |
| 43 | Lawrenceburg | 11,838 | 567 | 4.79% |
| 44 | Williamsburg | 5,226 | 245 | 4.69% |
| 45 | Fort Mitchell | 8,676 | 386 | 4.45% |
| 46 | Nicholasville | 31,625 | 1,395 | 4.41% |
| 47 | Monticello | 5,741 | 241 | 4.2% |
| 48 | Central City | 5,736 | 233 | 4.06% |
| 49 | Highland Heights | 6,531 | 259 | 3.97% |
| 50 | Cynthiana | 6,412 | 249 | 3.88% |
| 51 | Erlanger | 19,677 | 754 | 3.83% |
| 52 | Middlesborough | 9,258 | 350 | 3.78% |
| 53 | Morehead | 6,924 | 259 | 3.74% |
| 54 | Somerset | 12,108 | 437 | 3.61% |
| 55 | La Grange | 10,188 | 328 | 3.22% |
| 56 | Berea | 15,557 | 437 | 2.81% |
| 57 | Alexandria | 10,430 | 270 | 2.59% |
| 58 | Cold Spring | 6,298 | 154 | 2.45% |
| 59 | Pikeville | 7,560 | 184 | 2.43% |
| 60 | Shepherdsville | 14,351 | 282 | 1.97% |
| 61 | Fort Thomas | 17,242 | 332 | 1.93% |
| 62 | Independence | 29,024 | 501 | 1.73% |
| 63 | Taylor Mill | 6,880 | 106 | 1.54% |
| 64 | Ashland | 21,405 | 323 | 1.51% |
| 65 | Dayton | 5,703 | 79 | 1.39% |
| 66 | Corbin | 8,430 | 108 | 1.28% |
| 67 | Fort Wright | 5,882 | 68 | 1.16% |
| 68 | London | 7,576 | 83 | 1.1% |
| 69 | Bellevue | 5,598 | 54 | 0.96% |
| 70 | Leitchfield | 6,434 | 55 | 0.85% |
| 71 | Edgewood | 8,429 | 39 | 0.46% |
| 72 | Villa Hills | 7,378 | 17 | 0.23% |
| 73 | Mount Washington | 18,228 | 2 | 0.01% |
| 74 | Union | 7,494 | 0 | 0.0% |
| 75 | Flatwoods | 7,281 | 0 | 0.0% |