
Most African American cities in Michigan research summary. We used Saturday Night Science to analyze Michigan’s most recent Census data to determine the blackest cities in Michigan based on the percentage of Black residents. Here are the results of our analysis:
-
The city with the largest African American population in Michigan is Highland Park based on the most recent Census data.
-
Highland Park is 82.23% Black.
-
The least African American city in Michigan is Gladstone.
-
Gladstone is 0.0% Black.
-
Michigan is 13.1% Black.
-
Michigan is the 15th blackest state in the United States.
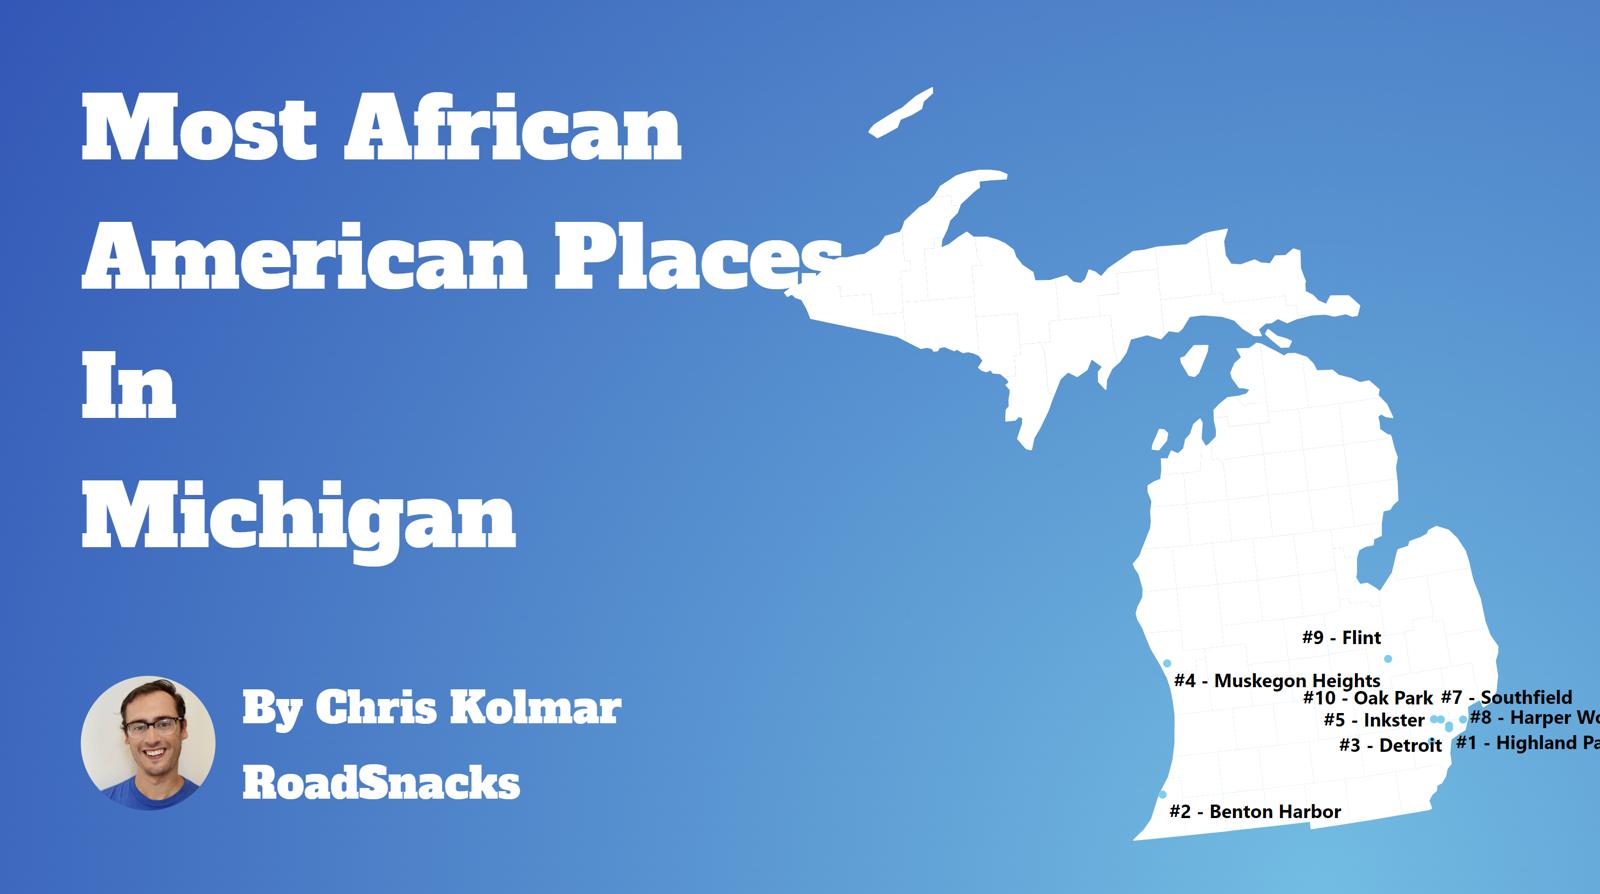
Table Of Contents: Top Ten | Methodology | Summary | Table
The Black community is one of the fastest-growing communities in America this decade.
Roughly 42 million people identifying as Black or African American live in the United States, making up 12% of the total population. According to the most recent American Community Survey, the Black population in Michigan is 1,321,347 – at 13.1% of the total population of Michigan.
The percentage growth of Blacks in America is the third largest percentage change for any race according to the Census’s race and ethnicity definition. Most scholars and historians agree that increasing diversity in America is a good thing.
We agree.
But how has the increase in the black population impacted Michigan? Which cities and towns in Michigan have seen the greatest increase in its Black population?
We broke down the most recent census data to determine the cities in Michigan with the largest African American population in 2026:
Most African American Places In Michigan
What’s the blackest city in Michigan? The city with the largest Black population in Michigan for 2026 is Highland Park. See if Highland Park ranked as one of the most african american places in America.
And if you already knew these places were Black, check out the best places to live in Michigan or the most diverse places in Michigan.
The 10 Blackest Cities In Michigan For 2026
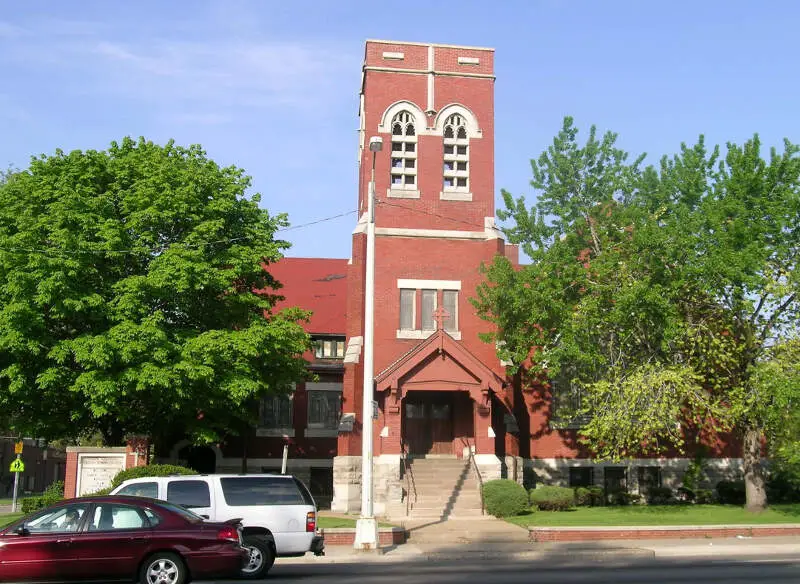
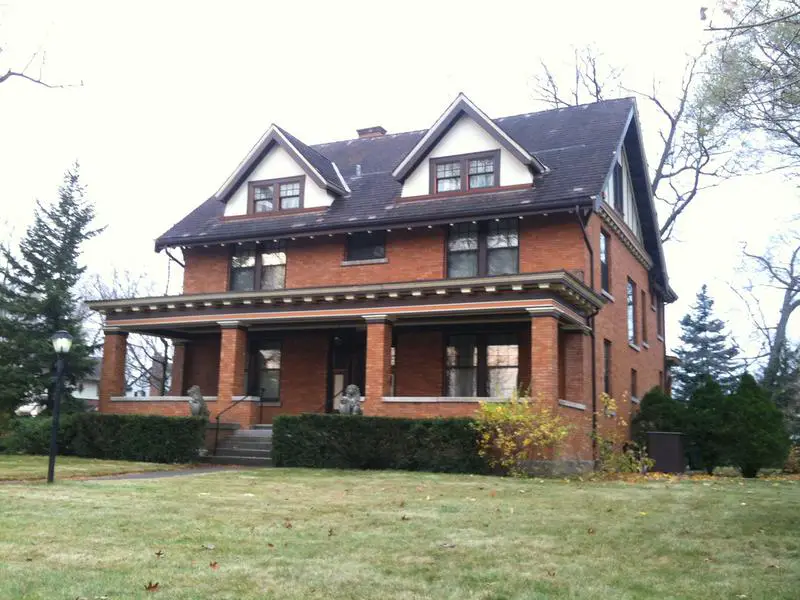
1. Highland Park
/10
Population: 8,628
% African American: 82.23%
# Of African American Residents: 7,095
Percent Change Since 2010: -40.1%
More on Highland Park: Data | Cost Of Living | Movers
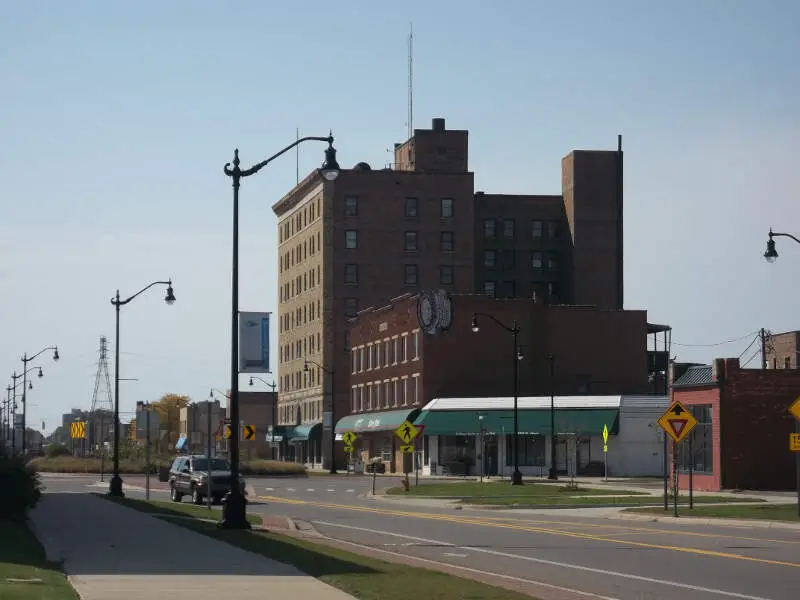
2. Benton Harbor
/10
Population: 8,953
% African American: 81.49%
# Of African American Residents: 7,296
Percent Change Since 2010: -19.15%
More on Benton Harbor: Data | Cost Of Living | Movers
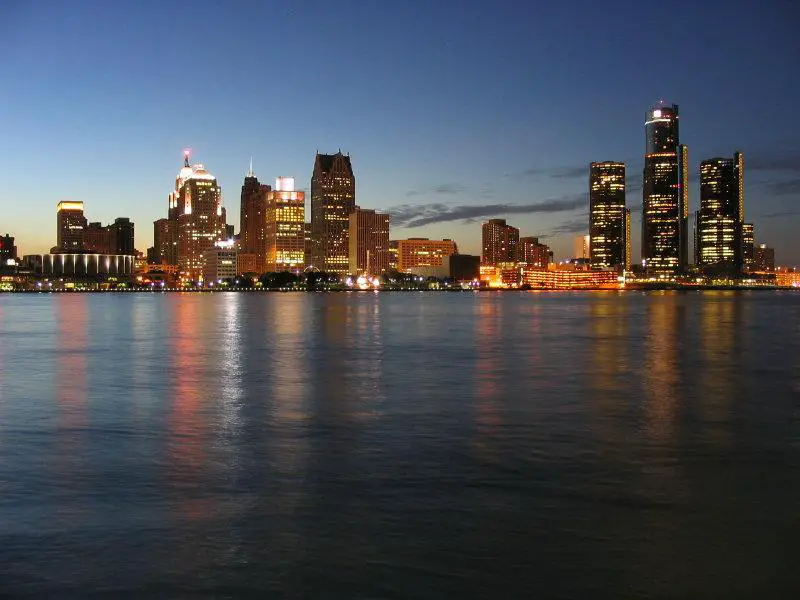
3. Detroit
/10
Population: 638,530
% African American: 74.95%
# Of African American Residents: 478,586
Percent Change Since 2010: -23.52%
More on Detroit: Data | Cost Of Living | Movers
4. Muskegon Heights
/10
Population: 9,841
% African American: 70.84%
# Of African American Residents: 6,971
Percent Change Since 2010: -19.59%
More on Muskegon Heights: Data | Cost Of Living | Movers
5. Inkster
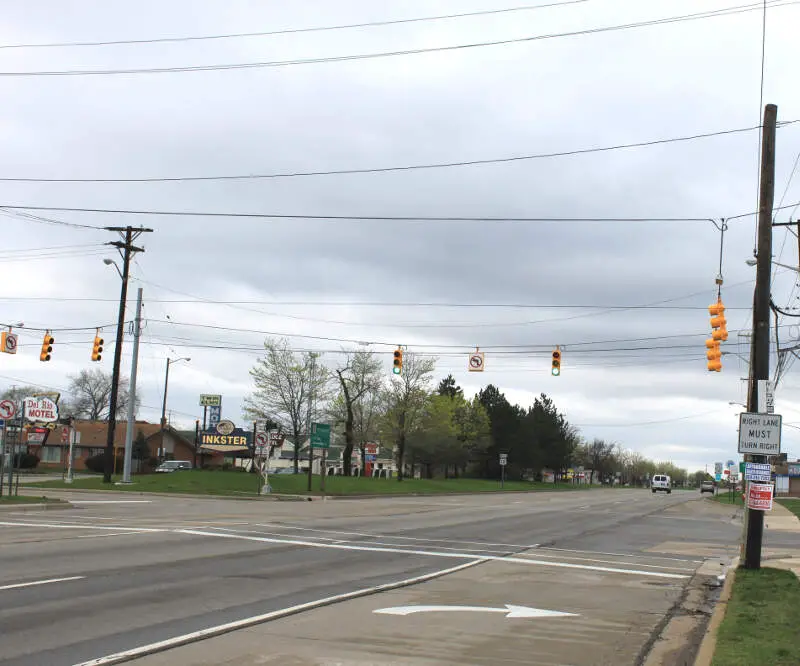
/10
Population: 25,428
% African American: 70.34%
# Of African American Residents: 17,887
Percent Change Since 2010: -6.17%
More on Inkster: Data | Cost Of Living | Movers
6. Southfield
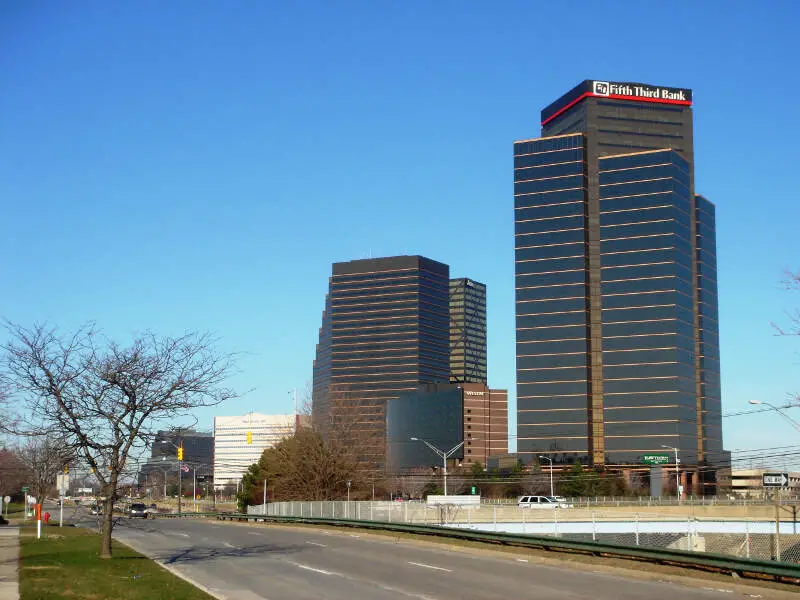
/10
Population: 76,236
% African American: 64.71%
# Of African American Residents: 49,336
Percent Change Since 2010: 2.02%
More on Southfield: Data | Cost Of Living | Movers
7. Harper Woods
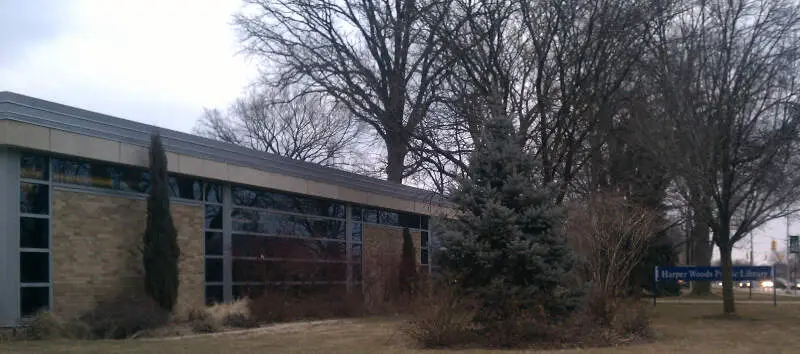
/10
Population: 15,116
% African American: 62.4%
# Of African American Residents: 9,432
Percent Change Since 2010: 73.89%
More on Harper Woods: Data | Cost Of Living | Movers
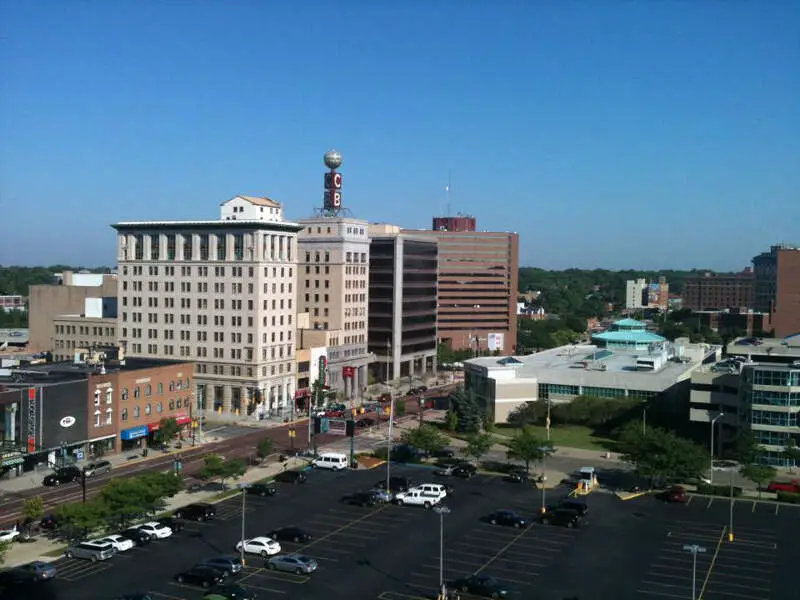
8. Flint
/10
Population: 80,175
% African American: 55.3%
# Of African American Residents: 44,337
Percent Change Since 2010: -24.67%
More on Flint: Data | Cost Of Living | Movers
9. Eastpointe
/10
Population: 33,982
% African American: 55.06%
# Of African American Residents: 18,712
Percent Change Since 2010: 101.33%
More on Eastpointe: Data | Cost Of Living | Movers
10. Oak Park
/10
Population: 29,318
% African American: 52.46%
# Of African American Residents: 15,380
Percent Change Since 2010: -4.21%
More on Oak Park: Data | Cost Of Living | Movers
Methodology: How We Determined The Cities In Michigan With The Largest Black Population For 2026
We still believe in the accuracy of data — especially from the Census. So that’s where we went to get the race breakdown across Michigan.
That leads us to the Census’s most recently available data, the 2020-2024 American Community Survey data from the US Census.
Specifically, we looked at table B03002: Hispanic OR LATINO ORIGIN BY RACE. Here are the category names as defined by the Census:
- Hispanic or Latino
- White alone*
- Black or African American alone*
- American Indian and Alaska Native alone*
- Asian alone*
- Native Hawaiian and Other Pacific Islander alone*
- Some other race alone*
- Two or more races*
Our particular column of interest was the number of people who identified as Black or African American.
We limited our analysis to non-CDPs with a population greater than 5,000 people in Michigan. That left us with 147 cities.
We then calculated the percentage of residents that are Black or African American. The percentages ranked from 82.2% to 0.0%.
Finally, we ranked each city based on the percentage of the Black population, with a higher score being more Black than a lower score. Highland Park took the distinction of being the most Black, while Gladstone was the least African American city.
We updated this article for 2026. This is our eleventh time ranking the cities in Michigan with the largest African American population.
Read on for more information on how the cities in Michigan ranked by population of African American residents or, for a more general take on diversity in America, head over to our ranking of the most diverse cities in America.
Summary: Black Populations Across Michigan
If you’re looking for a breakdown of African American populations across Michigan according to the most recent data, this is an accurate list.
The blackest cities in Michigan are Highland Park, Benton Harbor, Detroit, Muskegon Heights, Inkster, Southfield, Harper Woods, Flint, Eastpointe, and Oak Park.
If you’re curious enough, here are the least African American places in Michigan:
- Gladstone
- Eaton Rapids
- Kingsford
For more Michigan reading, check out:
African American Population By City In Michigan
| Rank | City | Population | African American Population | % African American |
|---|---|---|---|---|
| 1 | Highland Park | 8,628 | 7,095 | 82.23% |
| 2 | Benton Harbor | 8,953 | 7,296 | 81.49% |
| 3 | Detroit | 638,530 | 478,586 | 74.95% |
| 4 | Muskegon Heights | 9,841 | 6,971 | 70.84% |
| 5 | Inkster | 25,428 | 17,887 | 70.34% |
| 6 | Southfield | 76,236 | 49,336 | 64.71% |
| 7 | Harper Woods | 15,116 | 9,432 | 62.4% |
| 8 | Flint | 80,175 | 44,337 | 55.3% |
| 9 | Eastpointe | 33,982 | 18,712 | 55.06% |
| 10 | Oak Park | 29,318 | 15,380 | 52.46% |
| 11 | Ecorse | 9,064 | 4,375 | 48.27% |
| 12 | River Rouge | 7,008 | 3,191 | 45.53% |
| 13 | Romulus | 24,831 | 11,041 | 44.46% |
| 14 | Saginaw | 43,536 | 19,285 | 44.3% |
| 15 | Pontiac | 62,104 | 25,918 | 41.73% |
| 16 | Center Line | 8,463 | 2,674 | 31.6% |
| 17 | Albion | 7,560 | 2,342 | 30.98% |
| 18 | Muskegon | 37,226 | 10,759 | 28.9% |
| 19 | St. Louis | 7,367 | 2,107 | 28.6% |
| 20 | Wayne | 17,310 | 4,281 | 24.73% |
| 21 | Roseville | 47,123 | 11,480 | 24.36% |
| 22 | Ypsilanti | 19,857 | 4,749 | 23.92% |
| 23 | Westland | 83,633 | 19,743 | 23.61% |
| 24 | Kalamazoo | 73,076 | 16,312 | 22.32% |
| 25 | Lansing | 113,023 | 24,771 | 21.92% |
| 26 | Warren | 137,928 | 30,049 | 21.79% |
| 27 | Kentwood | 54,296 | 11,692 | 21.53% |
| 28 | Mount Clemens | 15,511 | 3,098 | 19.97% |
| 29 | Jackson | 31,058 | 5,887 | 18.95% |
| 30 | Taylor | 62,081 | 11,720 | 18.88% |
| 31 | Farmington Hills | 83,515 | 15,208 | 18.21% |
| 32 | Grand Rapids | 198,535 | 34,779 | 17.52% |
| 33 | Battle Creek | 52,374 | 8,170 | 15.6% |
| 34 | Auburn Hills | 25,105 | 3,833 | 15.27% |
| 35 | Niles | 11,803 | 1,630 | 13.81% |
| 36 | Ionia | 12,753 | 1,595 | 12.51% |
| 37 | Wixom | 17,295 | 2,149 | 12.43% |
| 38 | Hazel Park | 14,963 | 1,648 | 11.01% |
| 39 | Burton | 29,500 | 3,128 | 10.6% |
| 40 | Melvindale | 12,554 | 1,282 | 10.21% |
| 41 | Lincoln Park | 39,257 | 4,003 | 10.2% |
| 42 | Fraser | 14,583 | 1,460 | 10.01% |
| 43 | Dearborn Heights | 61,771 | 6,088 | 9.86% |
| 44 | Wyoming | 77,353 | 6,935 | 8.97% |
| 45 | Grand Blanc | 7,987 | 685 | 8.58% |
| 46 | Lapeer | 9,082 | 751 | 8.27% |
| 47 | Riverview | 12,186 | 992 | 8.14% |
| 48 | Three Rivers | 7,943 | 637 | 8.02% |
| 49 | Southgate | 29,366 | 2,354 | 8.02% |
| 50 | Flat Rock | 10,340 | 828 | 8.01% |
| 51 | Dowagiac | 5,732 | 458 | 7.99% |
| 52 | Madison Heights | 28,419 | 2,223 | 7.82% |
| 53 | East Lansing | 45,758 | 3,460 | 7.56% |
| 54 | Monroe | 20,320 | 1,534 | 7.55% |
| 55 | Sterling Heights | 133,573 | 9,918 | 7.43% |
| 56 | Novi | 66,717 | 4,904 | 7.35% |
| 57 | Grandville | 16,356 | 1,173 | 7.17% |
| 58 | Woodhaven | 12,690 | 892 | 7.03% |
| 59 | Grosse Pointe Woods | 16,094 | 1,097 | 6.82% |
| 60 | Farmington | 11,504 | 772 | 6.71% |
| 61 | Garden City | 26,739 | 1,769 | 6.62% |
| 62 | Port Huron | 28,620 | 1,842 | 6.44% |
| 63 | Mason | 8,249 | 528 | 6.4% |
| 64 | Ferndale | 19,190 | 1,228 | 6.4% |
| 65 | Ann Arbor | 122,036 | 7,791 | 6.38% |
| 66 | Beverly Hills | 10,524 | 653 | 6.2% |
| 67 | Portage | 49,259 | 3,035 | 6.16% |
| 68 | Hamtramck | 27,743 | 1,704 | 6.14% |
| 69 | Royal Oak | 57,950 | 3,464 | 5.98% |
| 70 | Big Rapids | 8,477 | 500 | 5.9% |
| 71 | Allen Park | 27,925 | 1,612 | 5.77% |
| 72 | Grosse Pointe Park | 11,319 | 587 | 5.19% |
| 73 | Mount Pleasant | 21,236 | 1,078 | 5.08% |
| 74 | Springfield | 5,269 | 244 | 4.63% |
| 75 | St. Clair Shores | 58,140 | 2,683 | 4.61% |
| 76 | Coldwater | 13,671 | 617 | 4.51% |
| 77 | St. Joseph | 7,986 | 356 | 4.46% |
| 78 | Livonia | 93,851 | 4,028 | 4.29% |
| 79 | Adrian | 20,395 | 870 | 4.27% |
| 80 | Norton Shores | 25,041 | 1,047 | 4.18% |
| 81 | Holland | 34,423 | 1,403 | 4.08% |
| 82 | Rochester | 12,934 | 501 | 3.87% |
| 83 | Troy | 87,898 | 3,283 | 3.74% |
| 84 | St. Clair | 5,585 | 208 | 3.72% |
| 85 | Clawson | 11,374 | 418 | 3.68% |
| 86 | Dearborn | 107,423 | 3,897 | 3.63% |
| 87 | Rochester Hills | 77,089 | 2,690 | 3.49% |
| 88 | Walker | 25,386 | 860 | 3.39% |
| 89 | Walled Lake | 7,299 | 236 | 3.23% |
| 90 | Marquette | 21,325 | 652 | 3.06% |
| 91 | Holly | 5,964 | 182 | 3.05% |
| 92 | Flushing | 8,284 | 238 | 2.87% |
| 93 | Plymouth | 9,214 | 263 | 2.85% |
| 94 | Belding | 5,960 | 170 | 2.85% |
| 95 | Charlotte | 9,277 | 258 | 2.78% |
| 96 | Birmingham | 21,763 | 603 | 2.77% |
| 97 | Trenton | 18,125 | 487 | 2.69% |
| 98 | Houghton | 8,474 | 226 | 2.67% |
| 99 | Cadillac | 10,445 | 273 | 2.61% |
| 100 | Richmond | 5,855 | 141 | 2.41% |