
Most African American cities in Missouri research summary. We used Saturday Night Science to analyze Missouri’s most recent Census data to determine the blackest cities in Missouri based on the percentage of Black residents. Here are the results of our analysis:
-
The city with the largest African American population in Missouri is Jennings based on the most recent Census data.
-
Jennings is 91.12% Black.
-
The least African American city in Missouri is Glendale.
-
Glendale is 0.0% Black.
-
Missouri is 11.0% Black.
-
Missouri is the 19th blackest state in the United States.
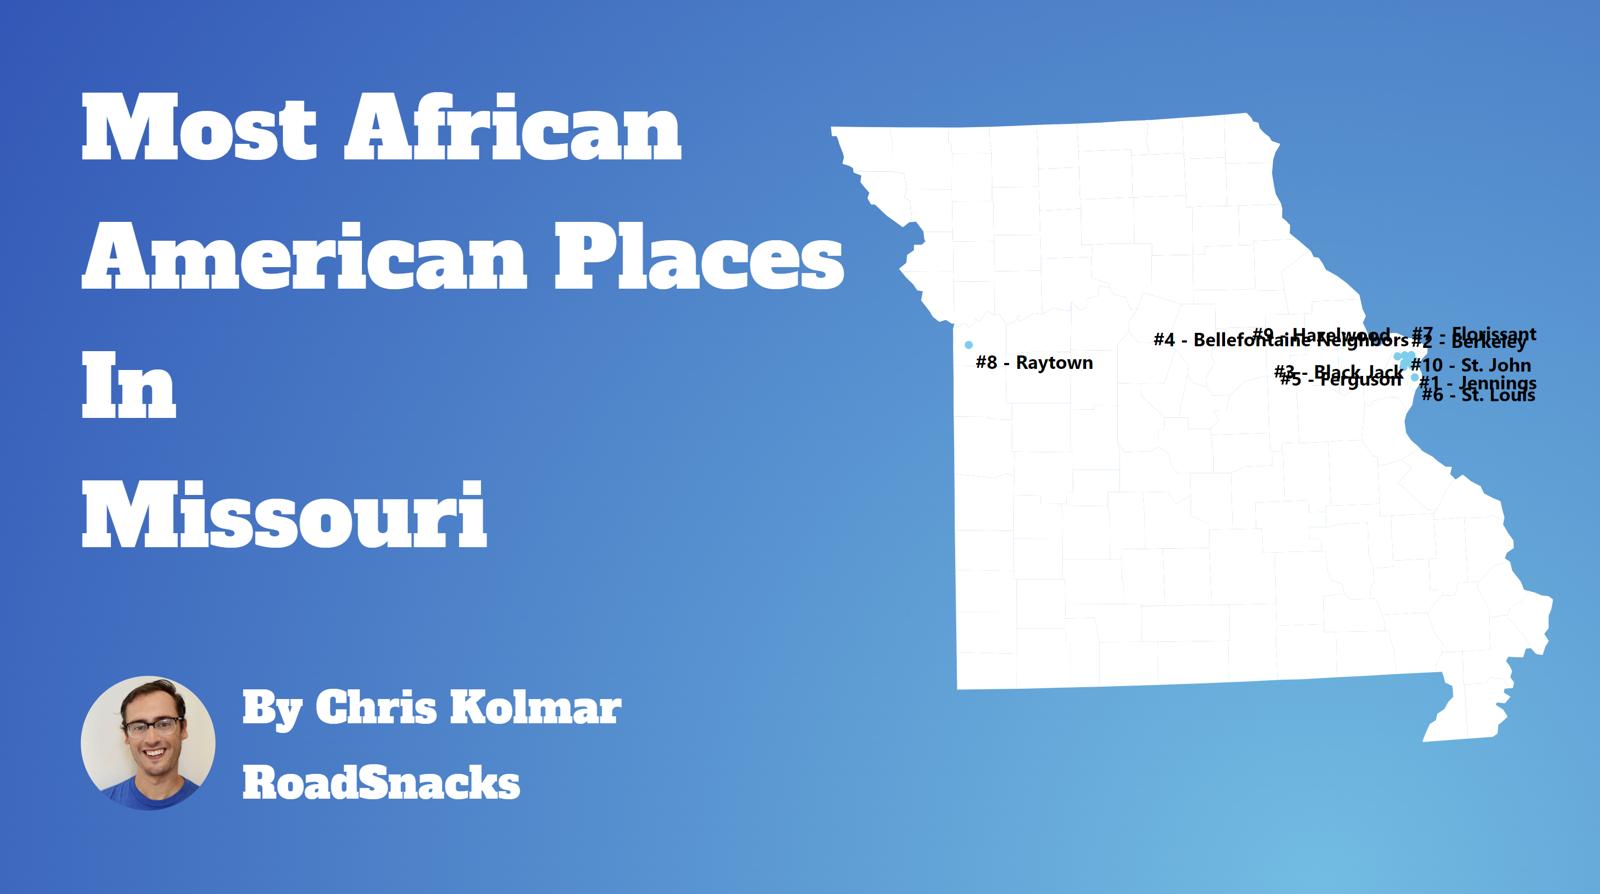
Table Of Contents: Top Ten | Methodology | Summary | Table
The Black community is one of the fastest-growing communities in America this decade.
Roughly 42 million people identifying as Black or African American live in the United States, making up 12% of the total population. According to the most recent American Community Survey, the Black population in Missouri is 680,587 – at 11.0% of the total population of Missouri.
The percentage growth of Blacks in America is the third largest percentage change for any race according to the Census’s race and ethnicity definition. Most scholars and historians agree that increasing diversity in America is a good thing.
We agree.
But how has the increase in the black population impacted Missouri? Which cities and towns in Missouri have seen the greatest increase in its Black population?
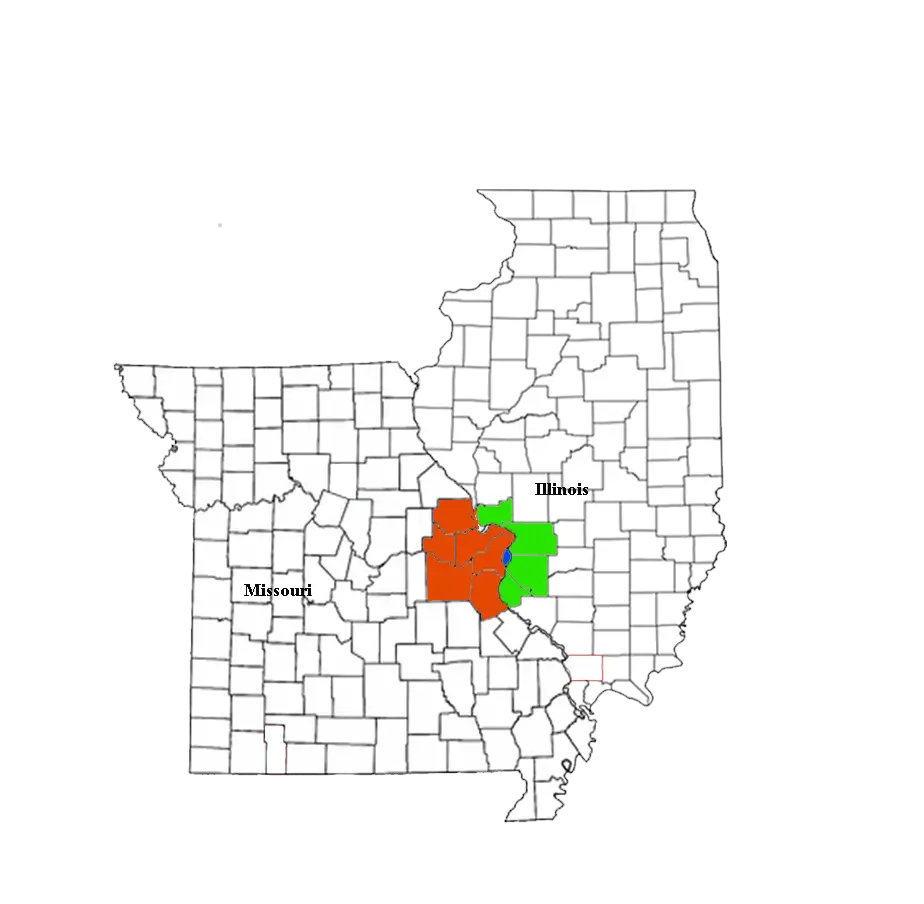
We broke down the most recent census data to determine the cities in Missouri with the largest African American population in 2025:
Most African American Places In Missouri
What’s the blackest city in Missouri? The city with the largest Black population in Missouri for 2025 is Jennings. See if Jennings ranked as one of the most african american places in America.
And if you already knew these places were Black, check out the best places to live in Missouri or the most diverse places in Missouri.
The 10 Blackest Cities In Missouri For 2025
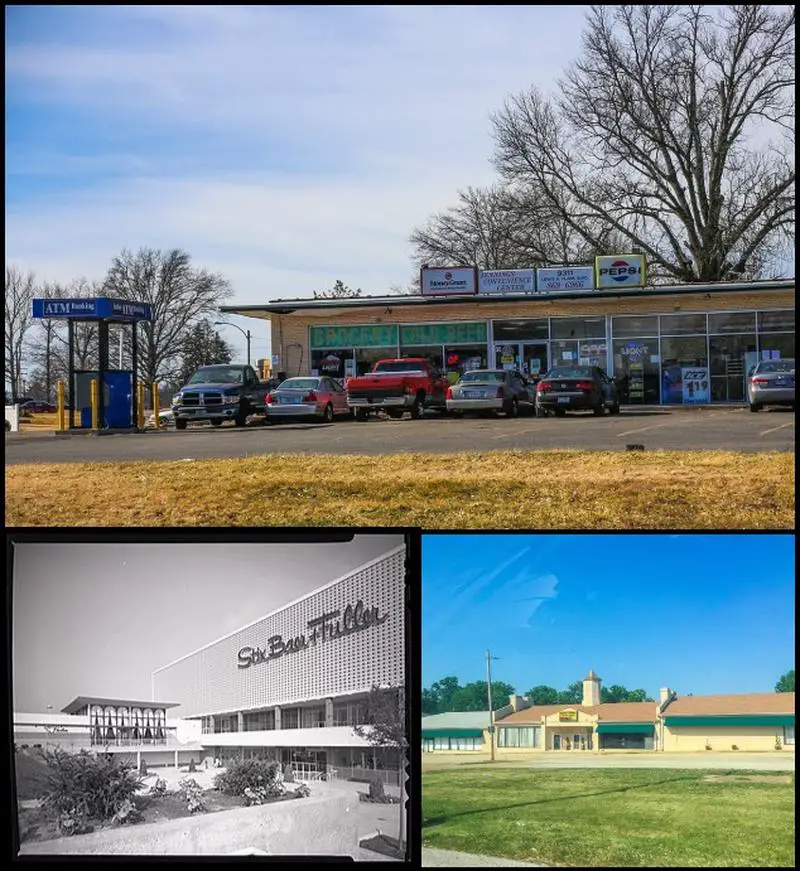
1. Jennings
/10
Population: 12,900
% African American: 91.12%
# Of African American Residents: 11,755
Percent Change Since 2010: -8.85%
More on Jennings: Data
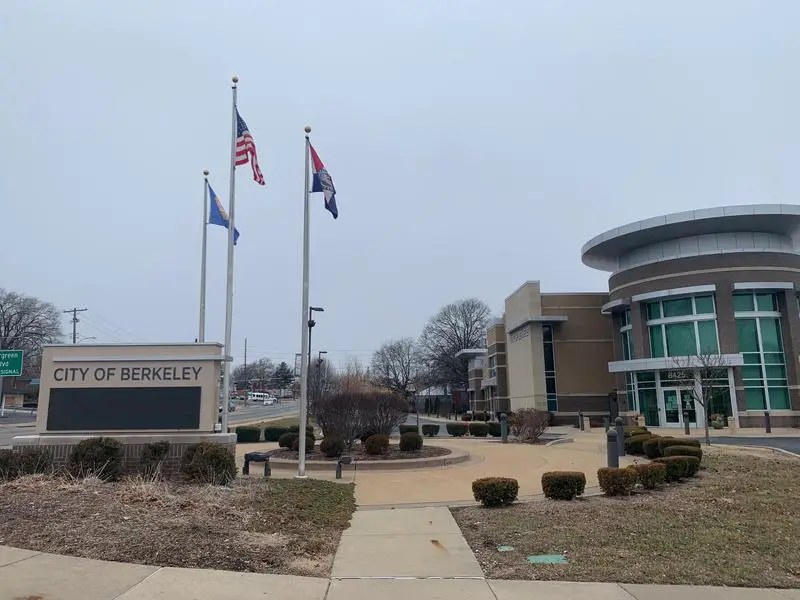
2. Berkeley
/10
Population: 8,149
% African American: 84.55%
# Of African American Residents: 6,890
Percent Change Since 2010: -5.56%
More on Berkeley: Data
3. Black Jack
/10
Population: 6,606
% African American: 84.17%
# Of African American Residents: 5,560
Percent Change Since 2010: 4.89%
More on Black Jack: Data
4. Bellefontaine Neighbors
/10
Population: 10,562
% African American: 82.36%
# Of African American Residents: 8,699
Percent Change Since 2010: 44.29%
More on Bellefontaine Neighbors: Data
5. Ferguson
/10
Population: 18,350
% African American: 69.71%
# Of African American Residents: 12,791
Percent Change Since 2010: -4.16%
More on Ferguson: Data
6. St. Louis
/10
Population: 293,109
% African American: 42.86%
# Of African American Residents: 125,617
Percent Change Since 2010: -20.75%
More on St. Louis: Data
7. Florissant

/10
Population: 51,915
% African American: 42.15%
# Of African American Residents: 21,880
Percent Change Since 2010: 63.97%
More on Florissant: Data
8. Hazelwood

/10
Population: 25,214
% African American: 39.45%
# Of African American Residents: 9,946
Percent Change Since 2010: 35.37%
More on Hazelwood: Data
9. St. John
/10
Population: 6,562
% African American: 37.7%
# Of African American Residents: 2,474
Percent Change Since 2010: 87.85%
More on St. John: Data
10. Raytown
/10
Population: 29,593
% African American: 36.45%
# Of African American Residents: 10,787
Percent Change Since 2010: 56.27%
More on Raytown: Data
Methodology: How We Determined The Cities In Missouri With The Largest Black Population For 2025
We still believe in the accuracy of data — especially from the Census. So that’s where we went to get the race breakdown across Missouri.
That leads us to the Census’s most recently available data, the 2019-2023 American Community Survey data from the US Census.
Specifically, we looked at table B03002: Hispanic OR LATINO ORIGIN BY RACE. Here are the category names as defined by the Census:
- Hispanic or Latino
- White alone*
- Black or African American alone*
- American Indian and Alaska Native alone*
- Asian alone*
- Native Hawaiian and Other Pacific Islander alone*
- Some other race alone*
- Two or more races*
Our particular column of interest was the number of people who identified as Black or African American.
We limited our analysis to non-CDPs with a population greater than 5,000 people in Missouri. That left us with 121 cities.
We then calculated the percentage of residents that are Black or African American. The percentages ranked from 91.1% to 0.0%.
Finally, we ranked each city based on the percentage of the Black population, with a higher score being more Black than a lower score. Jennings took the distinction of being the most Black, while Glendale was the least African American city.
We updated this article for 2025. This is our tenth time ranking the cities in Missouri with the largest African American population.
Read on for more information on how the cities in Missouri ranked by population of African American residents or, for a more general take on diversity in America, head over to our ranking of the most diverse cities in America.
Summary: Black Populations Across Missouri
If you’re looking for a breakdown of African American populations across Missouri according to the most recent data, this is an accurate list.
The blackest cities in Missouri are Jennings, Berkeley, Black Jack, Bellefontaine Neighbors, Ferguson, St. Louis, Florissant, Hazelwood, St. John, and Raytown.
If you’re curious enough, here are the least African American places in Missouri:
- Glendale
- Pevely
- Carl Junction
For more Missouri reading, check out:
African American Population By City In Missouri
| Rank | City | Population | African American Population | % African American |
|---|---|---|---|---|
| 1 | Jennings | 12,900 | 11,755 | 91.12% |
| 2 | Berkeley | 8,149 | 6,890 | 84.55% |
| 3 | Black Jack | 6,606 | 5,560 | 84.17% |
| 4 | Bellefontaine Neighbors | 10,562 | 8,699 | 82.36% |
| 5 | Ferguson | 18,350 | 12,791 | 69.71% |
| 6 | St. Louis | 293,109 | 125,617 | 42.86% |
| 7 | Florissant | 51,915 | 21,880 | 42.15% |
| 8 | Hazelwood | 25,214 | 9,946 | 39.45% |
| 9 | St. John | 6,562 | 2,474 | 37.7% |
| 10 | Raytown | 29,593 | 10,787 | 36.45% |
| 11 | Caruthersville | 5,426 | 1,870 | 34.46% |
| 12 | Grandview | 25,821 | 8,446 | 32.71% |
| 13 | University City | 34,655 | 10,522 | 30.36% |
| 14 | St. Ann | 12,865 | 3,402 | 26.44% |
| 15 | Kansas City | 508,233 | 129,468 | 25.47% |
| 16 | Sikeston | 16,231 | 4,032 | 24.84% |
| 17 | Bridgeton | 11,372 | 2,663 | 23.42% |
| 18 | Overland | 15,762 | 3,312 | 21.01% |
| 19 | Olivette | 8,539 | 1,705 | 19.97% |
| 20 | Jefferson City | 42,565 | 7,383 | 17.35% |
| 21 | Cape Girardeau | 40,047 | 6,026 | 15.05% |
| 22 | Maryland Heights | 27,981 | 3,922 | 14.02% |
| 23 | Kennett | 10,236 | 1,341 | 13.1% |
| 24 | Bonne Terre | 6,773 | 836 | 12.34% |
| 25 | Columbia | 127,200 | 15,241 | 11.98% |
| 26 | Independence | 121,944 | 13,132 | 10.77% |
| 27 | Lee’s Summit | 102,583 | 10,369 | 10.11% |
| 28 | Shrewsbury | 6,328 | 619 | 9.78% |
| 29 | Creve Coeur | 18,643 | 1,742 | 9.34% |
| 30 | Boonville | 7,682 | 711 | 9.26% |
| 31 | Maplewood | 8,154 | 733 | 8.99% |
| 32 | Poplar Bluff | 16,243 | 1,443 | 8.88% |
| 33 | Clayton | 17,282 | 1,525 | 8.82% |
| 34 | Moberly | 13,634 | 1,159 | 8.5% |
| 35 | Raymore | 23,849 | 1,996 | 8.37% |
| 36 | Blue Springs | 59,416 | 4,762 | 8.01% |
| 37 | Cameron | 8,721 | 681 | 7.81% |
| 38 | St. Charles | 71,048 | 5,448 | 7.67% |
| 39 | Richmond Heights | 9,179 | 699 | 7.62% |
| 40 | Hannibal | 16,825 | 1,277 | 7.59% |
| 41 | Valley Park | 6,817 | 497 | 7.29% |
| 42 | Belton | 24,618 | 1,765 | 7.17% |
| 43 | Pacific | 7,299 | 507 | 6.95% |
| 44 | Gladstone | 27,069 | 1,865 | 6.89% |
| 45 | St. Joseph | 71,542 | 4,689 | 6.55% |
| 46 | Mexico | 11,487 | 747 | 6.5% |
| 47 | Fulton | 12,611 | 789 | 6.26% |
| 48 | Kirksville | 17,493 | 1,049 | 6.0% |
| 49 | Farmington | 17,999 | 1,011 | 5.62% |
| 50 | Webster Groves | 23,771 | 1,334 | 5.61% |
| 51 | Wentzville | 45,734 | 2,554 | 5.58% |
| 52 | Warrensburg | 19,437 | 1,045 | 5.38% |
| 53 | St. Peters | 58,200 | 3,069 | 5.27% |
| 54 | Grain Valley | 15,967 | 816 | 5.11% |
| 55 | O’fallon | 92,697 | 4,665 | 5.03% |
| 56 | Kirkwood | 29,302 | 1,438 | 4.91% |
| 57 | Chillicothe | 9,129 | 422 | 4.62% |
| 58 | Marshall | 13,699 | 633 | 4.62% |
| 59 | Liberty | 30,446 | 1,389 | 4.56% |
| 60 | Lake St. Louis | 17,538 | 737 | 4.2% |
| 61 | Springfield | 169,432 | 7,104 | 4.19% |
| 62 | Excelsior Springs | 10,502 | 437 | 4.16% |
| 63 | Branson | 12,760 | 514 | 4.03% |
| 64 | Marshfield | 7,599 | 298 | 3.92% |
| 65 | Macon | 5,457 | 211 | 3.87% |
| 66 | Sedalia | 21,869 | 798 | 3.65% |
| 67 | Rolla | 20,144 | 709 | 3.52% |
| 68 | Chesterfield | 49,591 | 1,629 | 3.28% |
| 69 | Oak Grove | 8,477 | 272 | 3.21% |
| 70 | Festus | 12,965 | 410 | 3.16% |
| 71 | Manchester | 18,189 | 556 | 3.06% |
| 72 | Brentwood | 8,151 | 244 | 2.99% |
| 73 | Maryville | 10,556 | 311 | 2.95% |
| 74 | Joplin | 52,218 | 1,434 | 2.75% |
| 75 | Ballwin | 30,835 | 817 | 2.65% |
| 76 | Town And Country | 11,605 | 294 | 2.53% |
| 77 | Dardenne Prairie | 13,137 | 328 | 2.5% |
| 78 | Parkville | 8,022 | 197 | 2.46% |
| 79 | Union | 12,560 | 248 | 1.97% |
| 80 | Webb City | 13,139 | 259 | 1.97% |
| 81 | Sullivan | 6,355 | 120 | 1.89% |
| 82 | Richmond | 5,979 | 112 | 1.87% |
| 83 | Nevada | 7,998 | 149 | 1.86% |
| 84 | Jackson | 15,532 | 282 | 1.82% |
| 85 | Perryville | 8,530 | 134 | 1.57% |
| 86 | Clinton | 9,047 | 142 | 1.57% |
| 87 | Nixa | 24,131 | 370 | 1.53% |
| 88 | Neosho | 12,857 | 185 | 1.44% |
| 89 | Carthage | 15,513 | 211 | 1.36% |
| 90 | Ozark | 21,953 | 271 | 1.23% |
| 91 | Troy | 13,467 | 165 | 1.23% |
| 92 | Weldon Spring | 5,291 | 63 | 1.19% |
| 93 | Ladue | 8,948 | 106 | 1.18% |
| 94 | Republic | 19,233 | 220 | 1.14% |
| 95 | Warrenton | 8,870 | 97 | 1.09% |
| 96 | Sunset Hills | 9,113 | 97 | 1.06% |
| 97 | Crestwood | 12,298 | 127 | 1.03% |
| 98 | Wildwood | 35,168 | 330 | 0.94% |
| 99 | Bolivar | 10,996 | 87 | 0.79% |
| 100 | Trenton | 5,542 | 42 | 0.76% |