
Most African American cities in Montana research summary. We used Saturday Night Science to analyze Montana’s most recent Census data to determine the blackest cities in Montana based on the percentage of Black residents. Here are the results of our analysis:
The city with the largest African American population in Montana is Great Falls based on the most recent Census data.
Great Falls is 1.2% Black.
The least African American city in Montana is Whitefish.
Whitefish is 0.0% Black.
Montana is 0.5% Black.
Montana is the 50th blackest state in the United States.
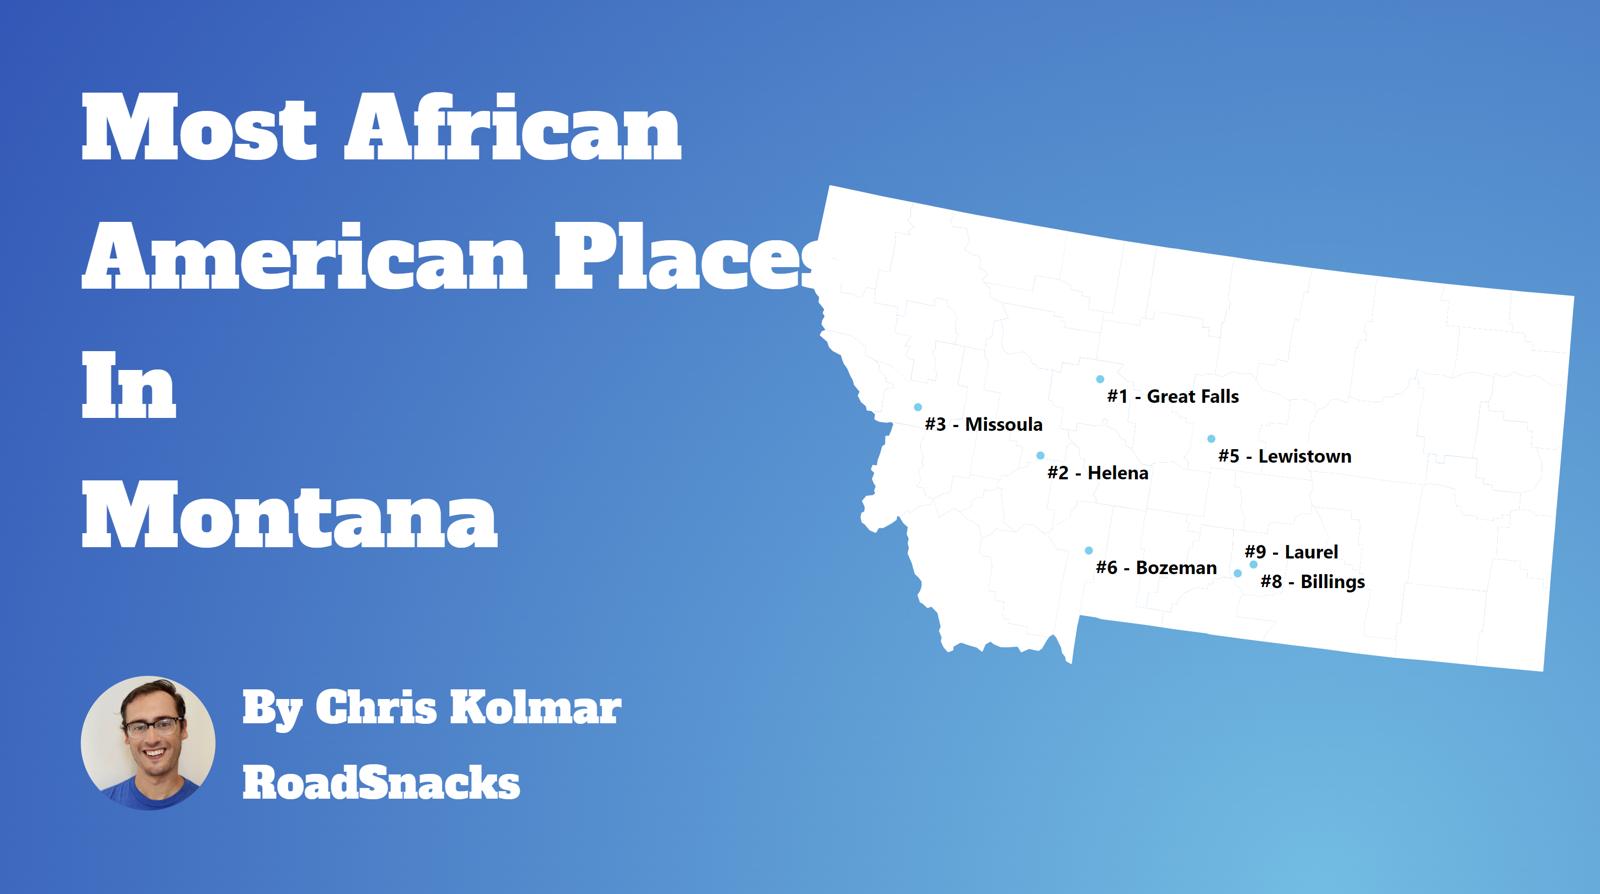
Table Of Contents: Top Ten | Methodology | Summary | Table
The Black community is one of the fastest-growing communities in America this decade.
Roughly 42 million people identifying as Black or African American live in the United States, making up 12% of the total population. According to the most recent American Community Survey, the Black population in Montana is 5,243 – at 0.5% of the total population of Montana.
The percentage growth of Blacks in America is the third largest percentage change for any race according to the Census’s race and ethnicity definition. Most scholars and historians agree that increasing diversity in America is a good thing.
We agree.
But how has the increase in the black population impacted Montana? Which cities and towns in Montana have seen the greatest increase in its Black population?
We broke down the most recent census data to determine the cities in Montana with the largest African American population in 2025:
Most African American Places In Montana
What’s the blackest city in Montana? The city with the largest Black population in Montana for 2025 is Great Falls. See if Great Falls ranked as one of the most african american places in America.
And if you already knew these places were Black, check out the best places to live in Montana or the most diverse places in Montana. Population: 60,412 Population: 6,028 Population: 55,042 Population: 33,126 Population: 75,600 Population: 7,198 Population: 8,412 Population: 118,321 Population: 9,333 Population: 9,512The 10 Blackest Cities In Montana For 2025
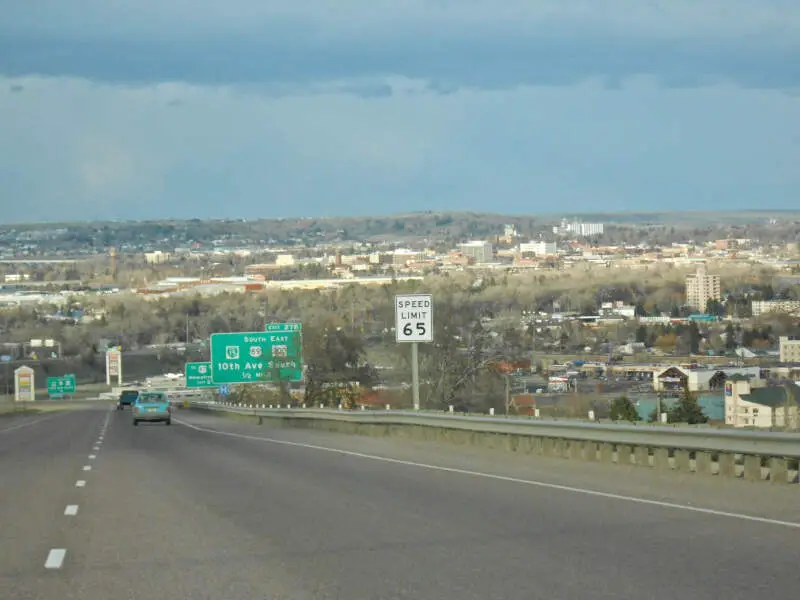
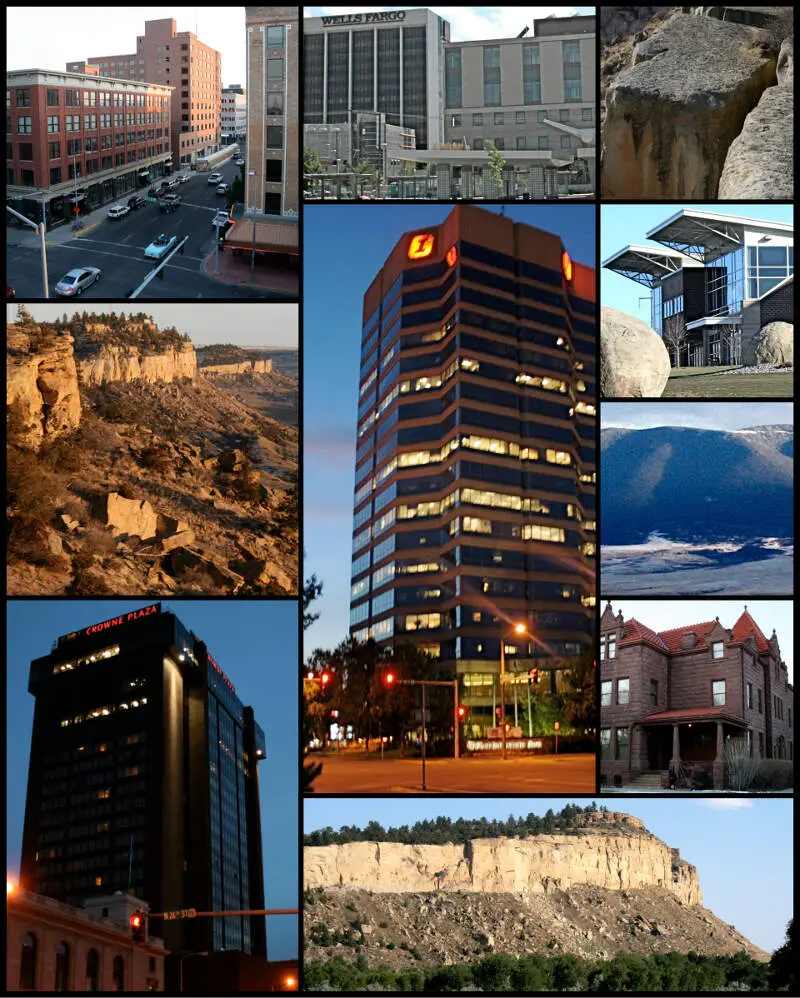
1. Great Falls
/10
% African American: 1.2%
# Of African American Residents: 724
Percent Change Since 2010: 24.83%
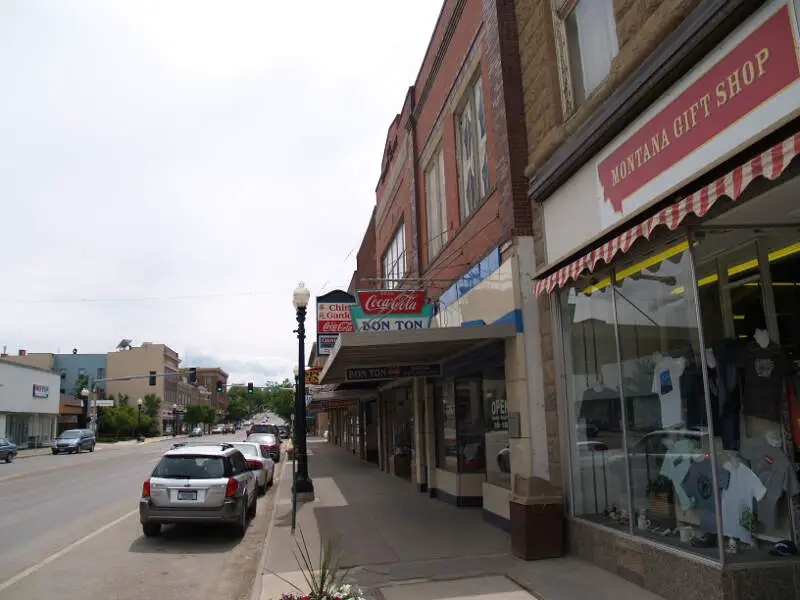
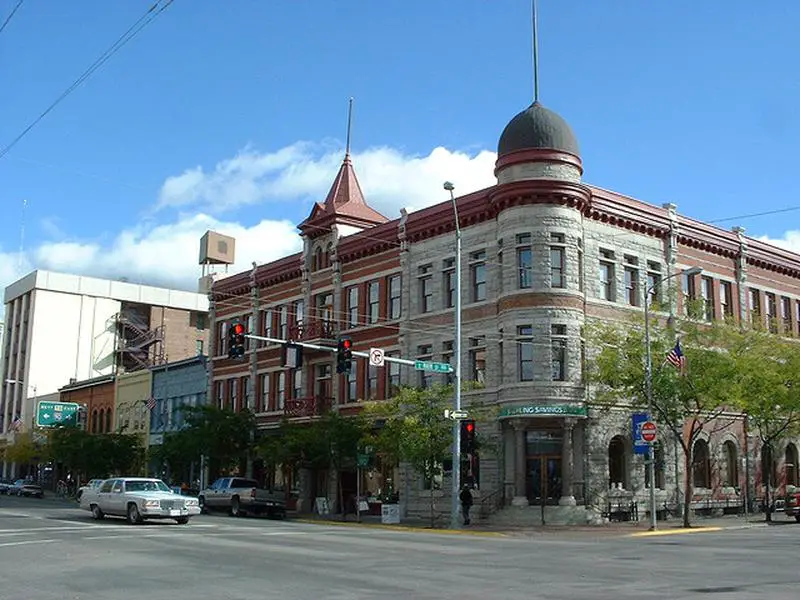
More on Great Falls: Data2. Lewistown
/10
% African American: 1.08%
# Of African American Residents: 65
Percent Change Since 2010: -53.9%
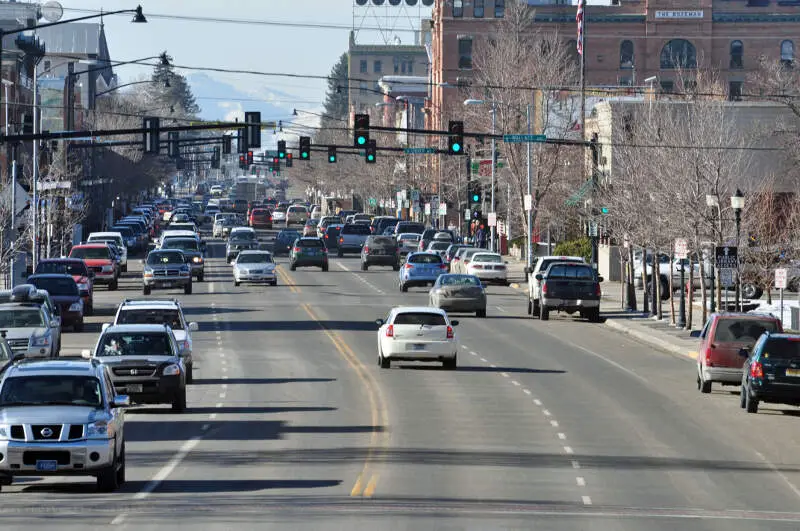
More on Lewistown: Data3. Bozeman
/10
% African American: 0.89%
# Of African American Residents: 489
Percent Change Since 2010: 89.53%
More on Bozeman: Data4. Helena
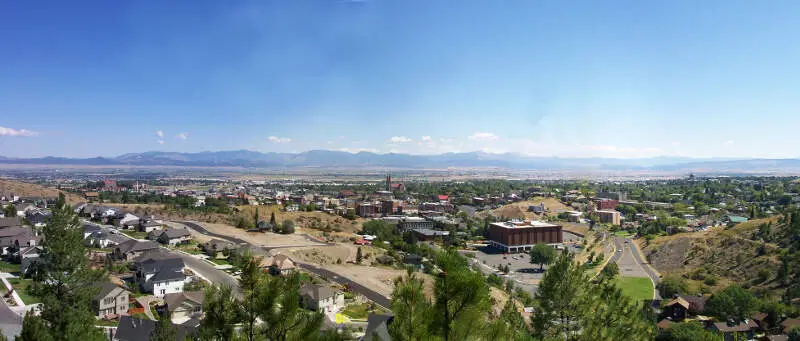
/10
% African American: 0.78%
# Of African American Residents: 260
Percent Change Since 2010: 306.25%
More on Helena: Data5. Missoula
/10
% African American: 0.72%
# Of African American Residents: 542
Percent Change Since 2010: 80.07%
More on Missoula: Data6. Laurel
/10
% African American: 0.5%
# Of African American Residents: 36
Percent Change Since 2010: 350.0%
More on Laurel: Data7. Miles City
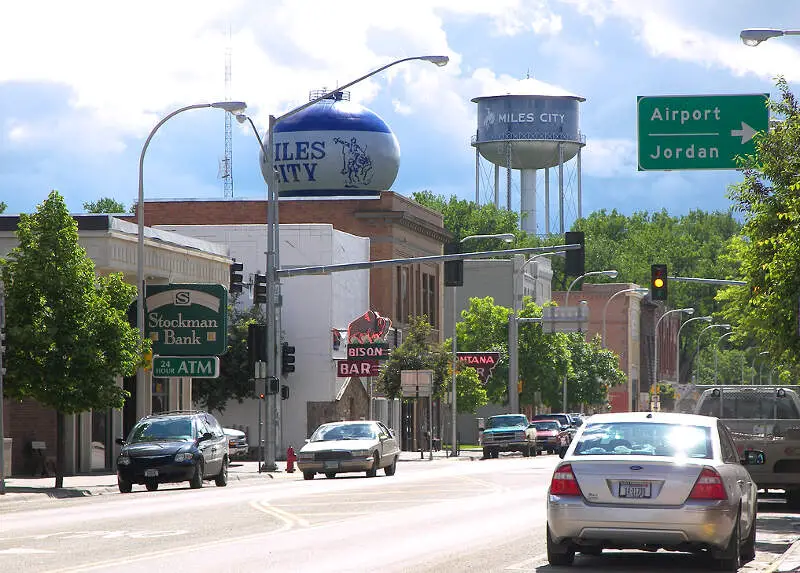
/10
% African American: 0.5%
# Of African American Residents: 42
Percent Change Since 2010: -25.0%
More on Miles City: Data8. Billings
/10
% African American: 0.48%
# Of African American Residents: 569
Percent Change Since 2010: -21.63%
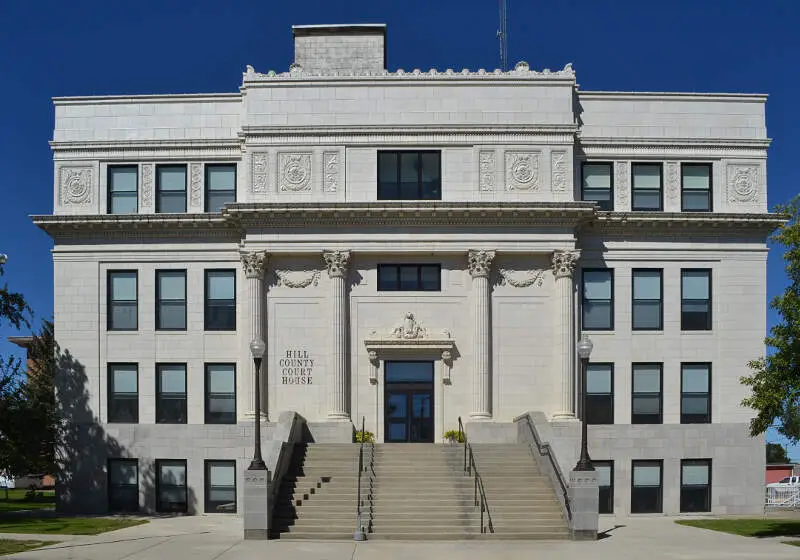
More on Billings: Data9. Havre
/10
% African American: 0.35%
# Of African American Residents: 33
Percent Change Since 2010: -62.07%
More on Havre: Data10. Anaconda-Deer Lodge County
/10
% African American: 0.32%
# Of African American Residents: 30
Percent Change Since 2010: -59.46%
More on Anaconda-Deer Lodge County: Data
We still believe in the accuracy of data — especially from the Census. So that’s where we went to get the race breakdown across Montana. That leads us to the Census’s most recently available data, the 2019-2023 American Community Survey data from the US Census. Specifically, we looked at table B03002: Hispanic OR LATINO ORIGIN BY RACE. Here are the category names as defined by the Census: Our particular column of interest was the number of people who identified as Black or African American. We limited our analysis to non-CDPs with a population greater than 6,000 people in Montana. That left us with 15 cities. We then calculated the percentage of residents that are Black or African American. The percentages ranked from 1.2% to 0.0%. Finally, we ranked each city based on the percentage of the Black population, with a higher score being more Black than a lower score. Great Falls took the distinction of being the most Black, while Whitefish was the least African American city. We updated this article for 2025. This is our tenth time ranking the cities in Montana with the largest African American population. Read on for more information on how the cities in Montana ranked by population of African American residents or, for a more general take on diversity in America, head over to our ranking of the most diverse cities in America.Methodology: How We Determined The Cities In Montana With The Largest Black Population For 2025
Summary: Black Populations Across Montana
If you’re looking for a breakdown of African American populations across Montana according to the most recent data, this is an accurate list.
The blackest cities in Montana are Great Falls, Lewistown, Bozeman, Helena, Missoula, Laurel, Miles City, Billings, Havre, and Anaconda-Deer Lodge County.
If you’re curious enough, here are the least African American places in Montana:
- Whitefish
- Sidney
- Livingston
For more Montana reading, check out:
African American Population By City In Montana
| Rank | City | Population | African American Population | % African American |
|---|---|---|---|---|
| 1 | Great Falls | 60,412 | 724 | 1.2% |
| 2 | Lewistown | 6,028 | 65 | 1.08% |
| 3 | Bozeman | 55,042 | 489 | 0.89% |
| 4 | Helena | 33,126 | 260 | 0.78% |
| 5 | Missoula | 75,600 | 542 | 0.72% |
| 6 | Laurel | 7,198 | 36 | 0.5% |
| 7 | Miles City | 8,412 | 42 | 0.5% |
| 8 | Billings | 118,321 | 569 | 0.48% |
| 9 | Havre | 9,333 | 33 | 0.35% |
| 10 | Anaconda-Deer Lodge County | 9,512 | 30 | 0.32% |
| 11 | Kalispell | 26,830 | 69 | 0.26% |
| 12 | Belgrade | 11,425 | 13 | 0.11% |
| 13 | Livingston | 8,635 | 0 | 0.0% |
| 14 | Sidney | 6,235 | 0 | 0.0% |
| 15 | Whitefish | 8,422 | 0 | 0.0% |
0.0% towns with little or no measurable crime rate.
WOW! It was a good read, but the title “The 10 BLACKEST Cities in Montana” felt a bit disrespectful. Don’t know if it was intentional due to the amount of viewers, or to attract a specific audience. Possibly titled for funny banter? As a black male living in the U.S., I had an opportunity to visit Montana with my wife while working in ND. I loved everything about the visit. Although our interactions with the people were minimal. We were there to view the state and take in God’s creation. I am hoping to have my own piece of property in that state one day, so I am doing my research. While I am not looking for areas with a predominately or large black community, it is good to know what to expect when making decisions such as buying property in an area that may not be friendly to “outsiders”. Freedom of speech does give you the right to title the article whatever you want, but if this was written to educate the African American community then it is definitely in bad taste. If it was to attract a specific audience, then kudos and God bless.