
Most African American cities in New Hampshire research summary. We used Saturday Night Science to analyze New Hampshire’s most recent Census data to determine the blackest cities in New Hampshire based on the percentage of Black residents. Here are the results of our analysis:
-
The city with the largest African American population in New Hampshire is Berlin based on the most recent Census data.
-
Berlin is 6.33% Black.
-
The least African American city in New Hampshire is Portsmouth.
-
Portsmouth is 0.23% Black.
-
New Hampshire is 1.3% Black.
-
New Hampshire is the 45th blackest state in the United States.
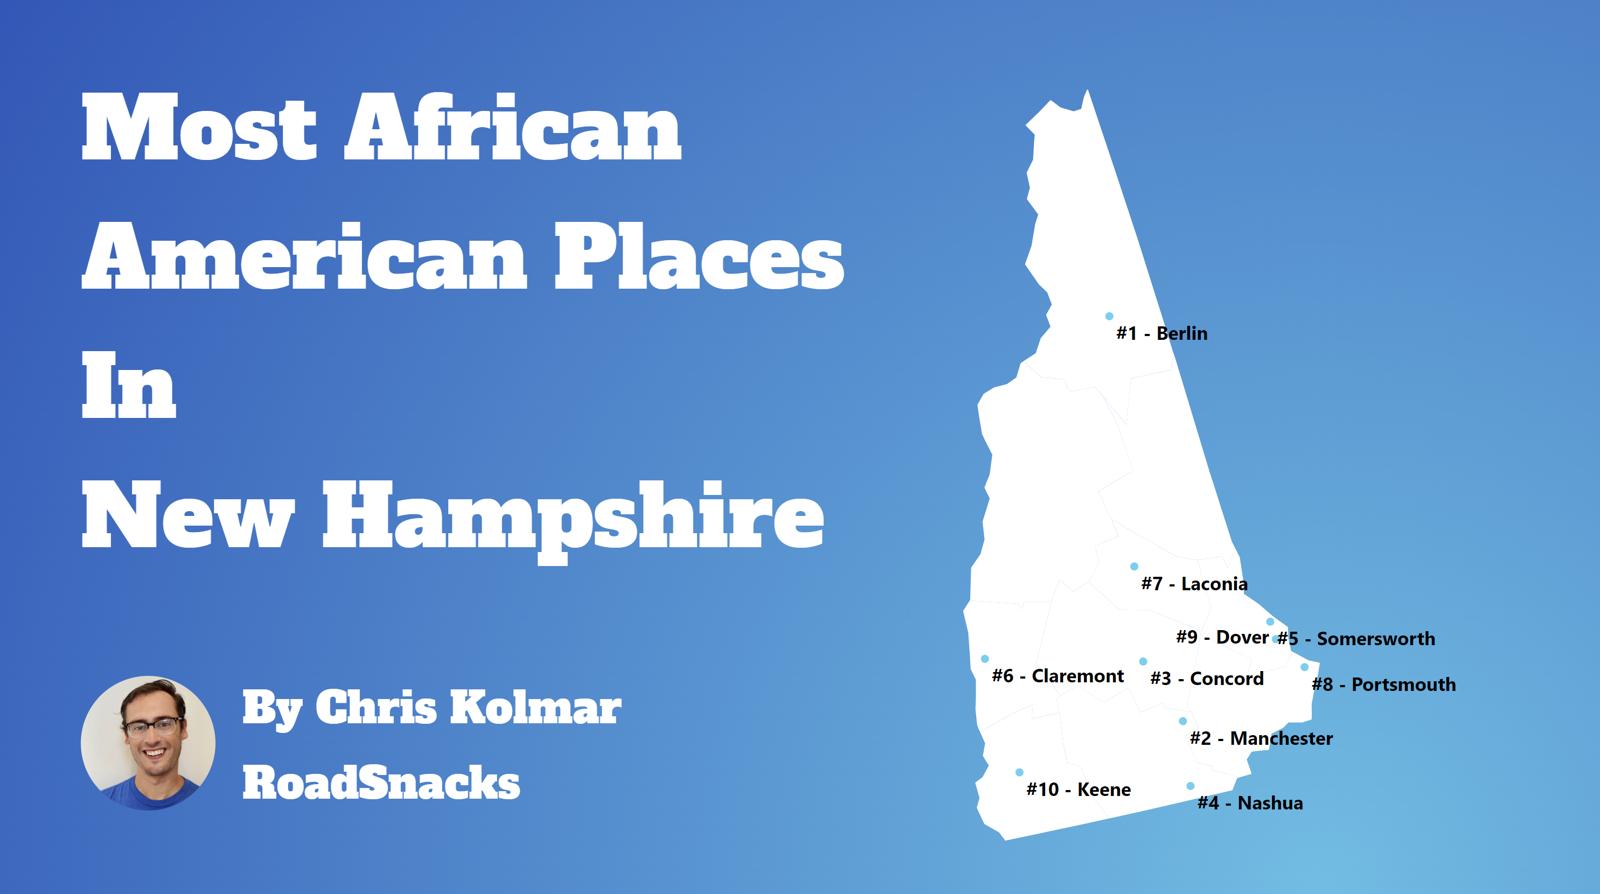
Table Of Contents: Top Ten | Methodology | Summary | Table
The Black community is one of the fastest-growing communities in America this decade.
Roughly 42 million people identifying as Black or African American live in the United States, making up 12% of the total population. According to the most recent American Community Survey, the Black population in New Hampshire is 18,704 – at 1.3% of the total population of New Hampshire.
The percentage growth of Blacks in America is the third largest percentage change for any race according to the Census’s race and ethnicity definition. Most scholars and historians agree that increasing diversity in America is a good thing.
We agree.
But how has the increase in the black population impacted New Hampshire? Which cities and towns in New Hampshire have seen the greatest increase in its Black population?
We broke down the most recent census data to determine the cities in New Hampshire with the largest African American population in 2026:
Most African American Places In New Hampshire
What’s the blackest city in New Hampshire? The city with the largest Black population in New Hampshire for 2026 is Berlin. See if Berlin ranked as one of the most african american places in America.
And if you already knew these places were Black, check out the best places to live in New Hampshire or the most diverse places in New Hampshire.
The 10 Blackest Cities In New Hampshire For 2026
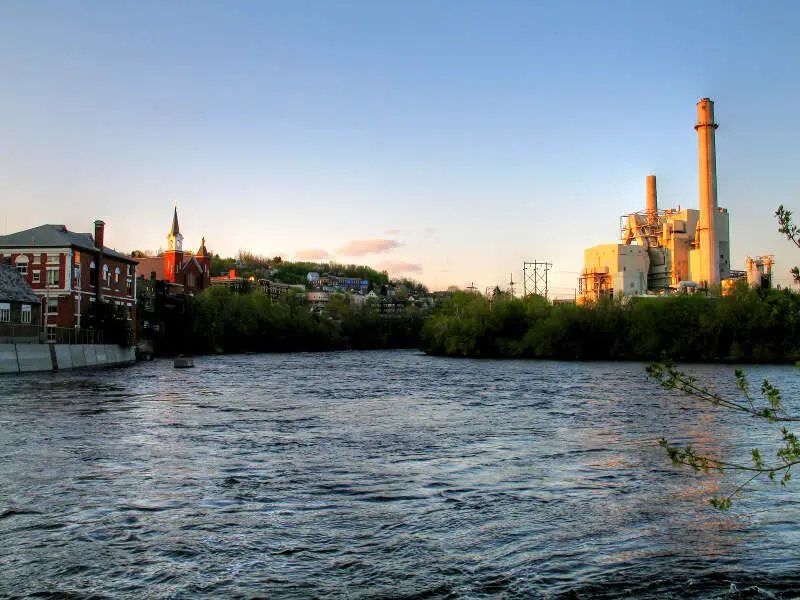
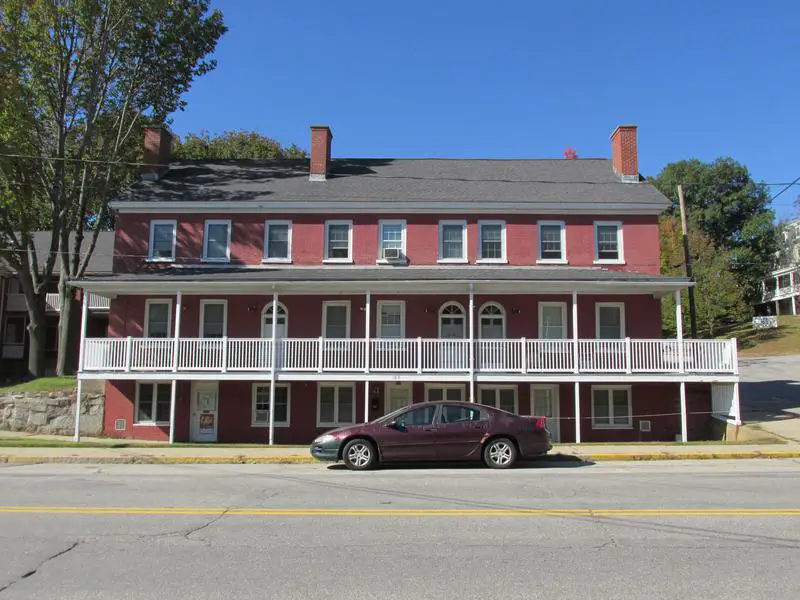
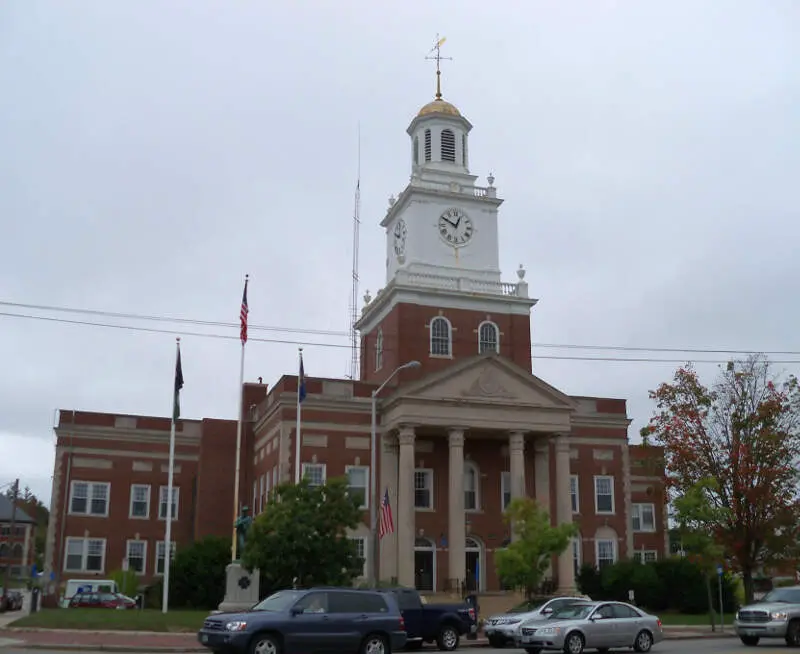
1. Berlin
/10
Population: 9,383
% African American: 6.33%
# Of African American Residents: 594
Percent Change Since 2010: 1505.41%
More on Berlin: Data | Cost Of Living | Movers
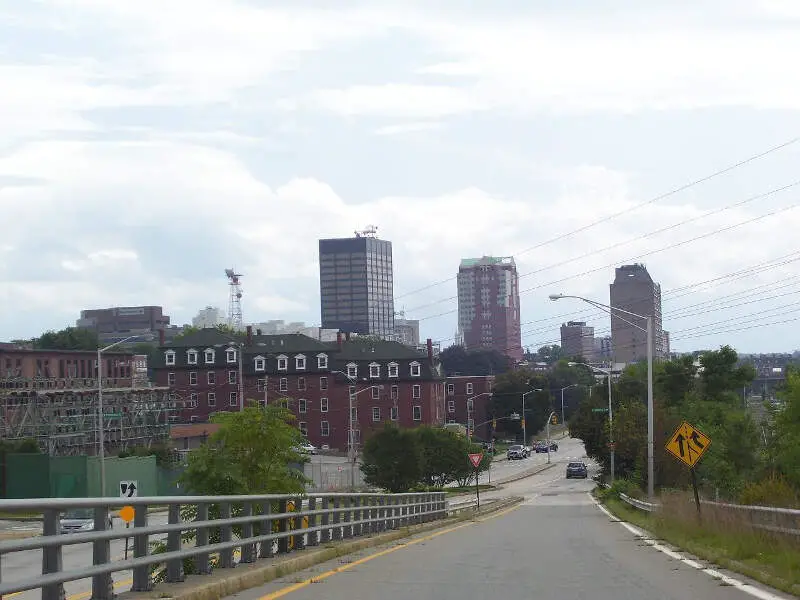
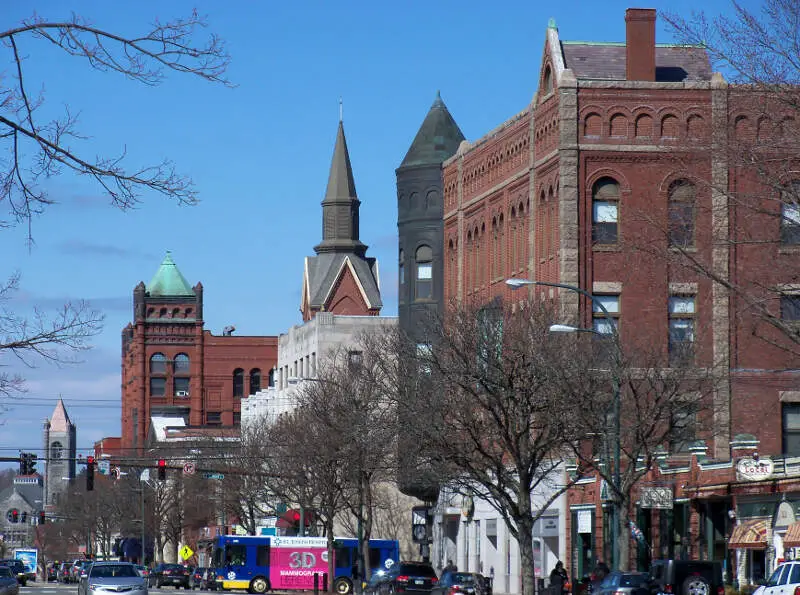
2. Manchester
/10
Population: 115,643
% African American: 4.2%
# Of African American Residents: 4,861
Percent Change Since 2010: 16.57%
More on Manchester: Data | Cost Of Living | Movers
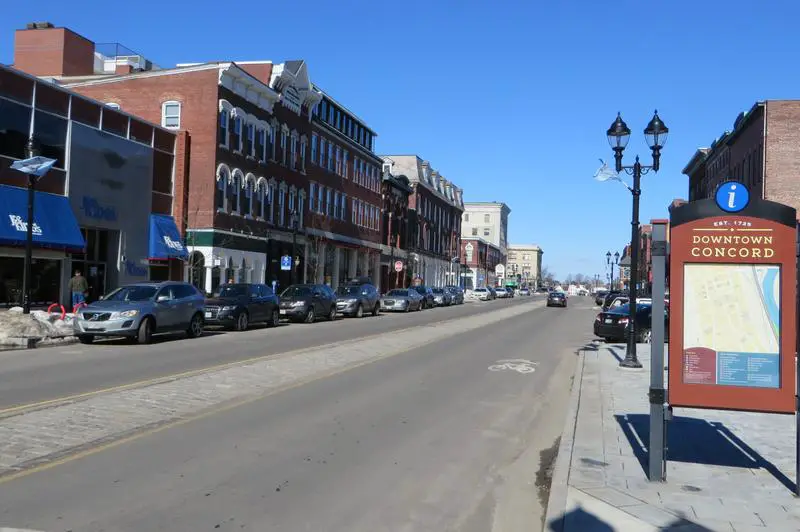
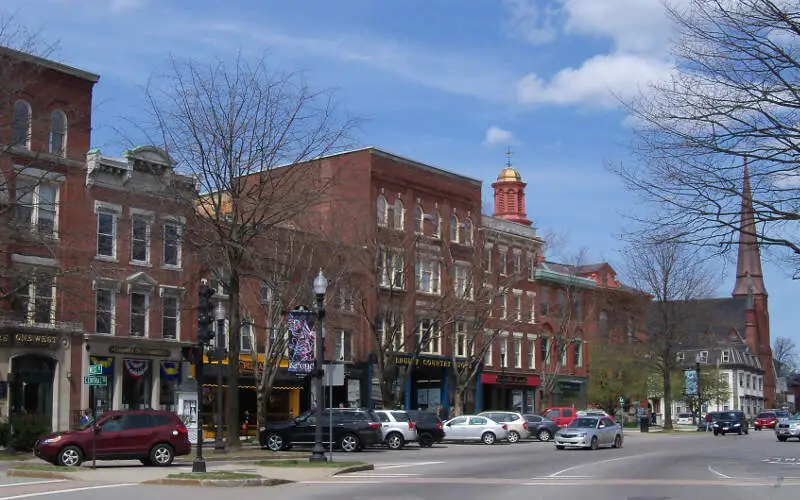
3. Concord
/10
Population: 44,375
% African American: 3.67%
# Of African American Residents: 1,629
Percent Change Since 2010: 104.65%
More on Concord: Data | Cost Of Living | Movers
4. Nashua
/10
Population: 91,294
% African American: 2.79%
# Of African American Residents: 2,546
Percent Change Since 2010: 44.33%
More on Nashua: Data | Cost Of Living | Movers
5. Somersworth
/10
Population: 12,111
% African American: 2.17%
# Of African American Residents: 263
Percent Change Since 2010: 39.89%
More on Somersworth: Data | Cost Of Living | Movers
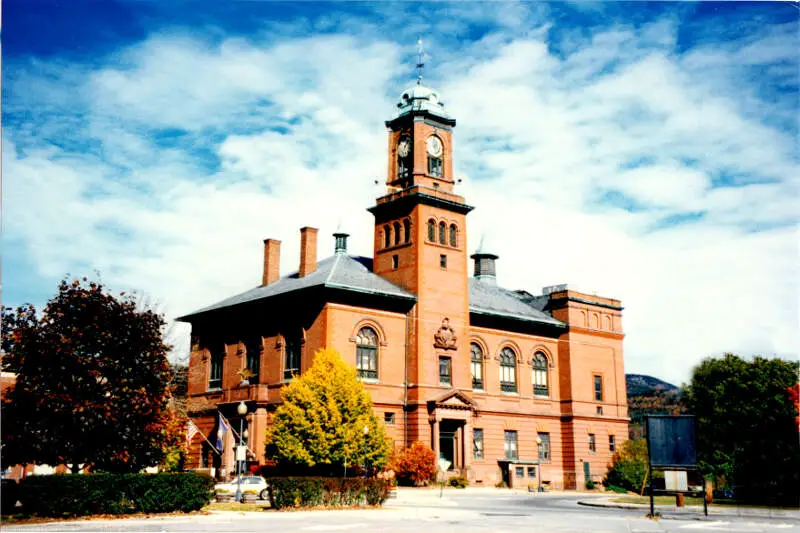
6. Claremont
/10
Population: 13,078
% African American: 1.77%
# Of African American Residents: 232
Percent Change Since 2010: 193.67%
More on Claremont: Data | Cost Of Living | Movers
7. Keene
/10
Population: 22,939
% African American: 1.67%
# Of African American Residents: 384
Percent Change Since 2010: 473.13%
More on Keene: Data | Cost Of Living | Movers
8. Dover
/10
Population: 33,364
% African American: 1.19%
# Of African American Residents: 396
Percent Change Since 2010: 8.49%
More on Dover: Data | Cost Of Living | Movers
9. Rochester
/10
Population: 33,144
% African American: 1.07%
# Of African American Residents: 354
Percent Change Since 2010: 48.12%
More on Rochester: Data | Cost Of Living | Movers
10. Lebanon
/10
Population: 14,999
% African American: 0.67%
# Of African American Residents: 100
Percent Change Since 2010: -68.55%
More on Lebanon: Data | Cost Of Living | Movers
Methodology: How We Determined The Cities In New Hampshire With The Largest Black Population For 2026
We still believe in the accuracy of data — especially from the Census. So that’s where we went to get the race breakdown across New Hampshire.
That leads us to the Census’s most recently available data, the 2020-2024 American Community Survey data from the US Census.
Specifically, we looked at table B03002: Hispanic OR LATINO ORIGIN BY RACE. Here are the category names as defined by the Census:
- Hispanic or Latino
- White alone*
- Black or African American alone*
- American Indian and Alaska Native alone*
- Asian alone*
- Native Hawaiian and Other Pacific Islander alone*
- Some other race alone*
- Two or more races*
Our particular column of interest was the number of people who identified as Black or African American.
We limited our analysis to non-CDPs with a population greater than 8,000 people in New Hampshire. That left us with 13 cities.
We then calculated the percentage of residents that are Black or African American. The percentages ranked from 6.3% to 0.2%.
Finally, we ranked each city based on the percentage of the Black population, with a higher score being more Black than a lower score. Berlin took the distinction of being the most Black, while Portsmouth was the least African American city.
We updated this article for 2026. This is our eleventh time ranking the cities in New Hampshire with the largest African American population.
Read on for more information on how the cities in New Hampshire ranked by population of African American residents or, for a more general take on diversity in America, head over to our ranking of the most diverse cities in America.
Summary: Black Populations Across New Hampshire
If you’re looking for a breakdown of African American populations across New Hampshire according to the most recent data, this is an accurate list.
The blackest cities in New Hampshire are Berlin, Manchester, Concord, Nashua, Somersworth, Claremont, Keene, Dover, Rochester, and Lebanon.
If you’re curious enough, here are the least African American places in New Hampshire:
- Portsmouth
- Laconia
- Franklin
For more New Hampshire reading, check out:
- Best Places To Live In New Hampshire
- Most Dangerous Cities In New Hampshire
- Worst Places To Live In New Hampshire
African American Population By City In New Hampshire
| Rank | City | Population | African American Population | % African American |
|---|---|---|---|---|
| 1 | Berlin | 9,383 | 594 | 6.33% |
| 2 | Manchester | 115,643 | 4,861 | 4.2% |
| 3 | Concord | 44,375 | 1,629 | 3.67% |
| 4 | Nashua | 91,294 | 2,546 | 2.79% |
| 5 | Somersworth | 12,111 | 263 | 2.17% |
| 6 | Claremont | 13,078 | 232 | 1.77% |
| 7 | Keene | 22,939 | 384 | 1.67% |
| 8 | Dover | 33,364 | 396 | 1.19% |
| 9 | Rochester | 33,144 | 354 | 1.07% |
| 10 | Lebanon | 14,999 | 100 | 0.67% |
| 11 | Franklin | 8,799 | 27 | 0.31% |
| 12 | Laconia | 17,085 | 42 | 0.25% |
| 13 | Portsmouth | 22,545 | 51 | 0.23% |
The first sentence turned me off. Is the “black community” in America (and I say America because the next sentence begins to break down stats of blacks in the US) growing faster than say the mid 1400s? Or how about the 1500s? 1600s? 1700s? No? You sound so ignorant in that first sentence its not even funny, it’s sad.
I have enjoyed following “roadsnacks.” The information is usually pivotal for those in search of great information. However, there is a responsibility in supplying correct information to the general public. The problem with your Berlin, NH statistics is that the new prison there reflects the growth in blacks living in Berlin. U.S. prisons do not count where individual prisoners are from but, rather, where they are incarcerated. Anyone relying on this information is receiving flawed statistics. As a result, any black family that is considering relocating to New Hampshire and is looking for other blacks in Berlin, will find them behind bars and not living in a thriving residential community.