
Most African American cities in New York research summary. We used Saturday Night Science to analyze New York’s most recent Census data to determine the blackest cities in New York based on the percentage of Black residents. Here are the results of our analysis:
-
The city with the largest African American population in New York is Mount Vernon based on the most recent Census data.
-
Mount Vernon is 56.91% Black.
-
The least African American city in New York is New Square.
-
New Square is 0.0% Black.
-
New York is 13.4% Black.
-
New York is the 13th blackest state in the United States.
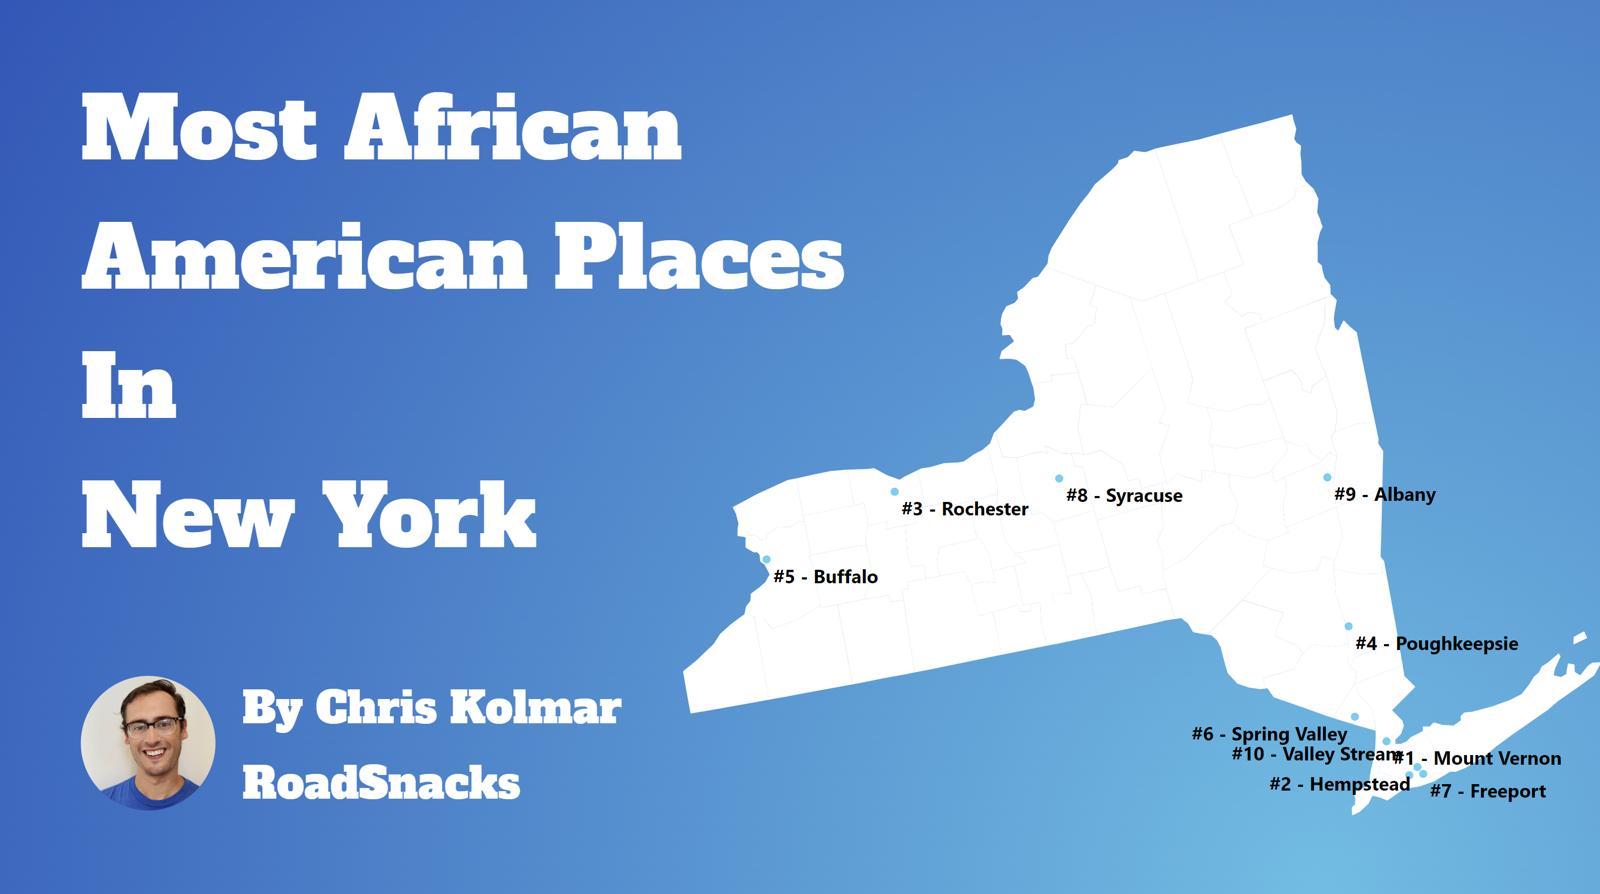
Table Of Contents: Top Ten | Methodology | Summary | Table
The Black community is one of the fastest-growing communities in America this decade.
Roughly 42 million people identifying as Black or African American live in the United States, making up 12% of the total population. According to the most recent American Community Survey, the Black population in New York is 2,661,771 – at 13.4% of the total population of New York.
The percentage growth of Blacks in America is the third largest percentage change for any race according to the Census’s race and ethnicity definition. Most scholars and historians agree that increasing diversity in America is a good thing.
We agree.
But how has the increase in the black population impacted New York? Which cities and towns in New York have seen the greatest increase in its Black population?
We broke down the most recent census data to determine the cities in New York with the largest African American population in 2026:
Most African American Places In New York
What’s the blackest city in New York? The city with the largest Black population in New York for 2026 is Mount Vernon. See if Mount Vernon ranked as one of the most african american places in America.
And if you already knew these places were Black, check out the best places to live in New York or the most diverse places in New York.
The 10 Blackest Cities In New York For 2026
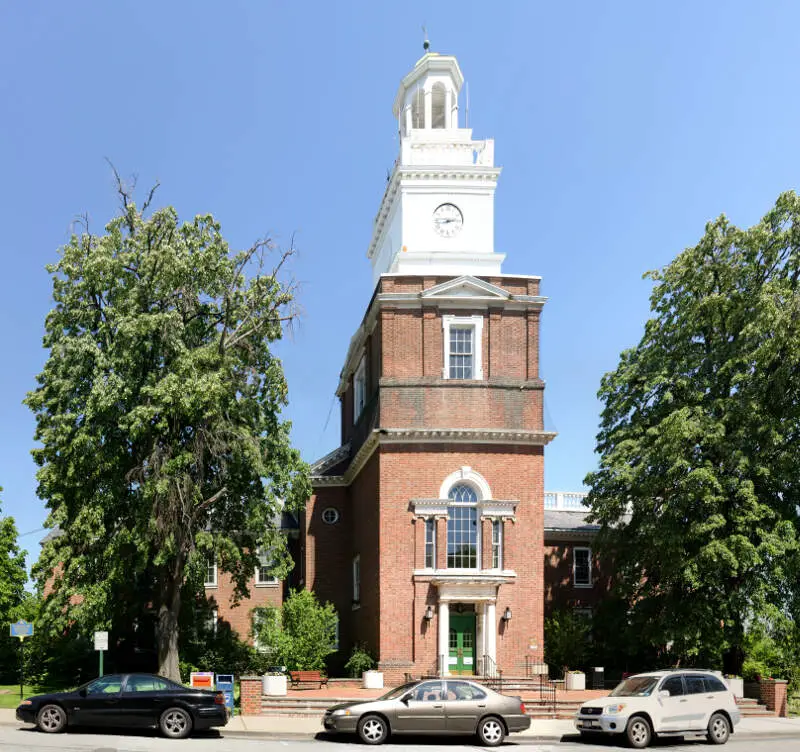
1. Mount Vernon
/10
Population: 72,427
% African American: 56.91%
# Of African American Residents: 41,219
Percent Change Since 2010: 3.0%
More on Mount Vernon: Data | Cost Of Living | Movers
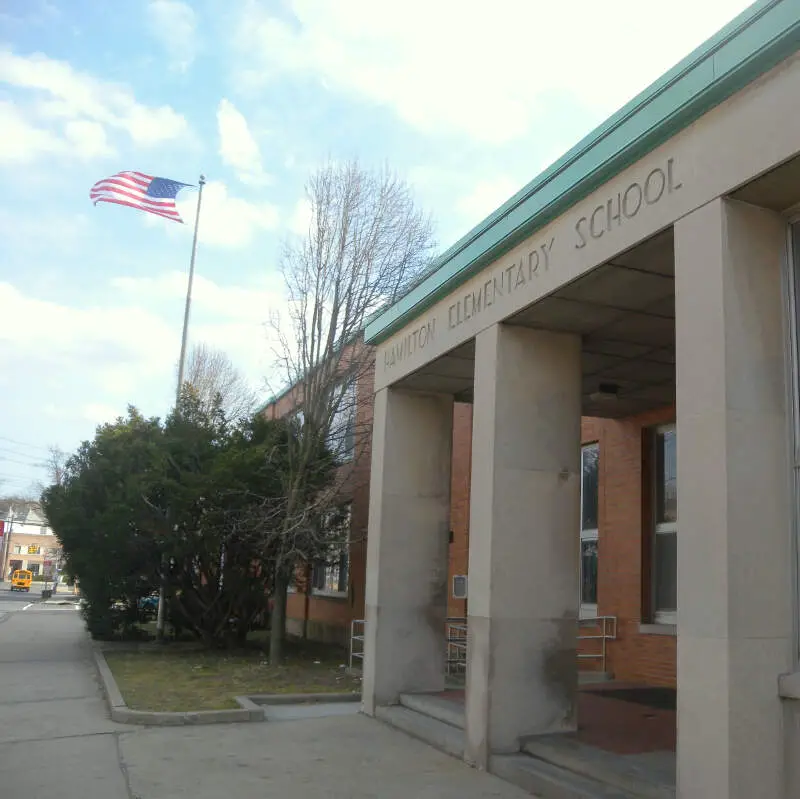
2. Hempstead
/10
Population: 58,801
% African American: 43.15%
# Of African American Residents: 25,373
Percent Change Since 2010: -3.48%
More on Hempstead: Data | Cost Of Living | Movers
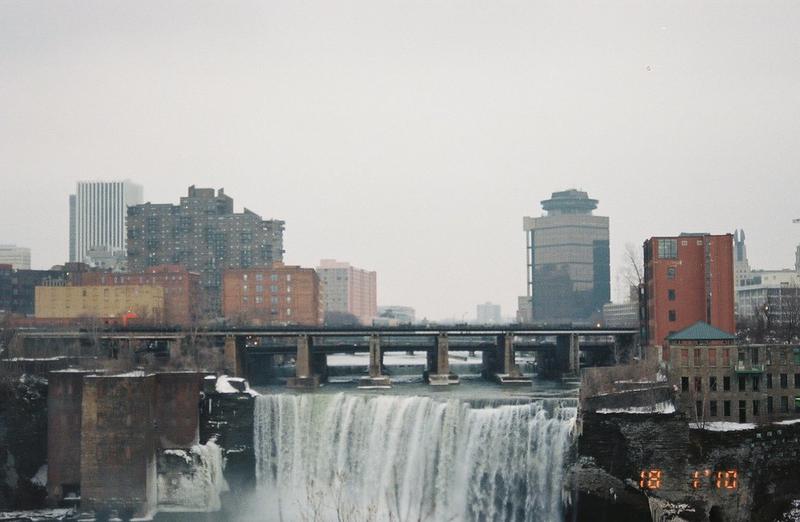
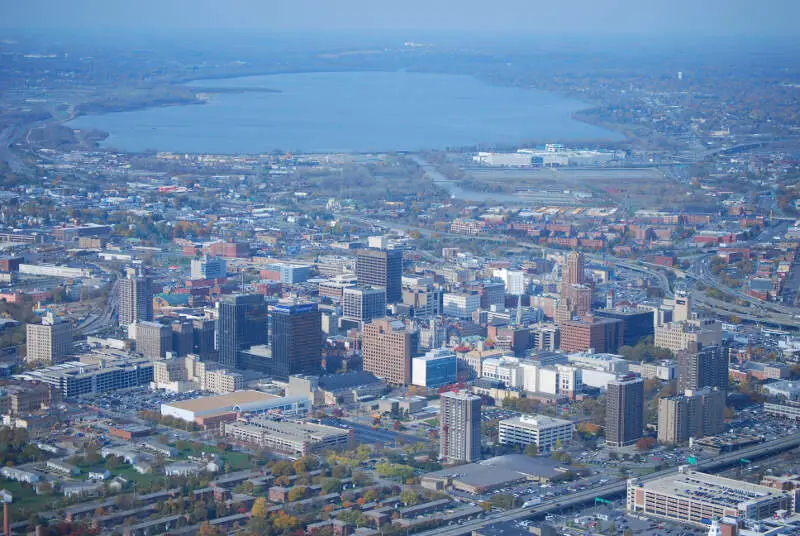
3. Rochester
/10
Population: 208,772
% African American: 34.65%
# Of African American Residents: 72,342
Percent Change Since 2010: -13.18%
More on Rochester: Data | Cost Of Living | Movers
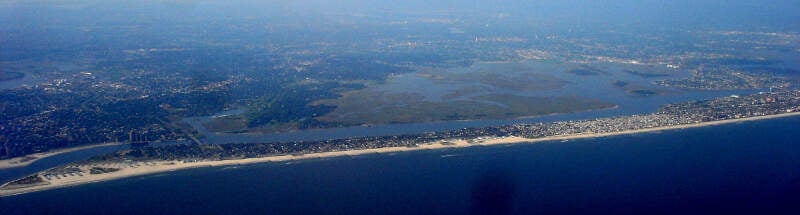
4. Freeport
/10
Population: 44,088
% African American: 32.55%
# Of African American Residents: 14,349
Percent Change Since 2010: 13.8%
More on Freeport: Data | Cost Of Living | Movers
5. Buffalo
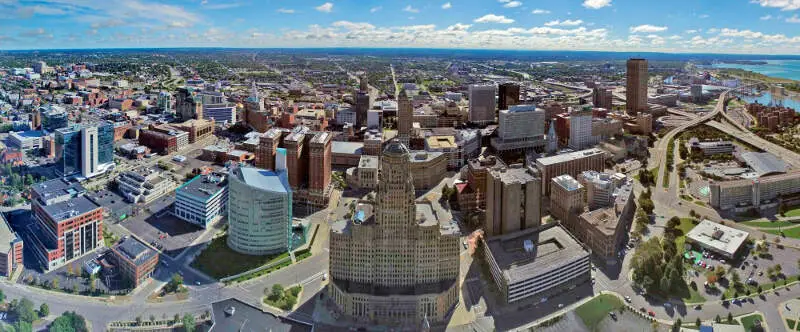
/10
Population: 276,854
% African American: 31.26%
# Of African American Residents: 86,532
Percent Change Since 2010: -13.76%
More on Buffalo: Data | Cost Of Living | Movers
6. Poughkeepsie
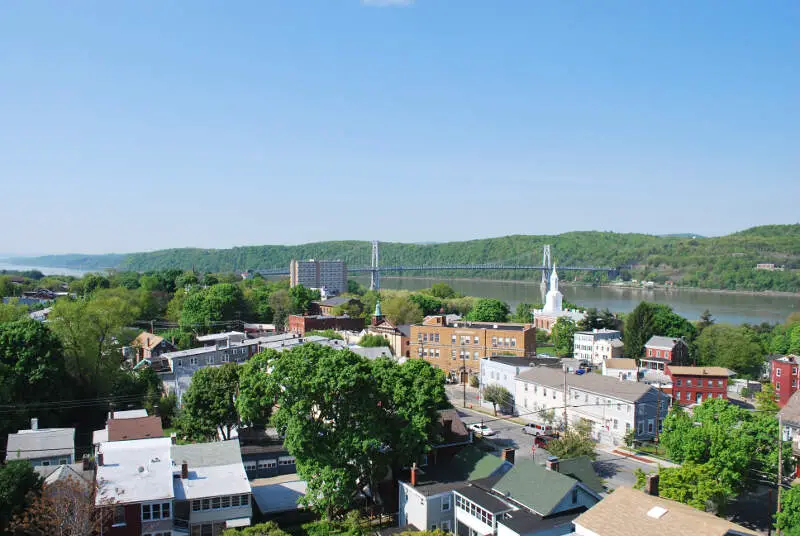
/10
Population: 31,958
% African American: 29.99%
# Of African American Residents: 9,584
Percent Change Since 2010: -18.31%
More on Poughkeepsie: Data | Cost Of Living | Movers
7. Spring Valley
/10
Population: 33,192
% African American: 28.63%
# Of African American Residents: 9,503
Percent Change Since 2010: -14.34%
More on Spring Valley: Data | Cost Of Living | Movers
8. Valley Stream
/10
Population: 40,315
% African American: 25.8%
# Of African American Residents: 10,403
Percent Change Since 2010: 71.5%
More on Valley Stream: Data | Cost Of Living | Movers
9. Syracuse
/10
Population: 146,384
% African American: 25.69%
# Of African American Residents: 37,600
Percent Change Since 2010: -7.43%
More on Syracuse: Data | Cost Of Living | Movers
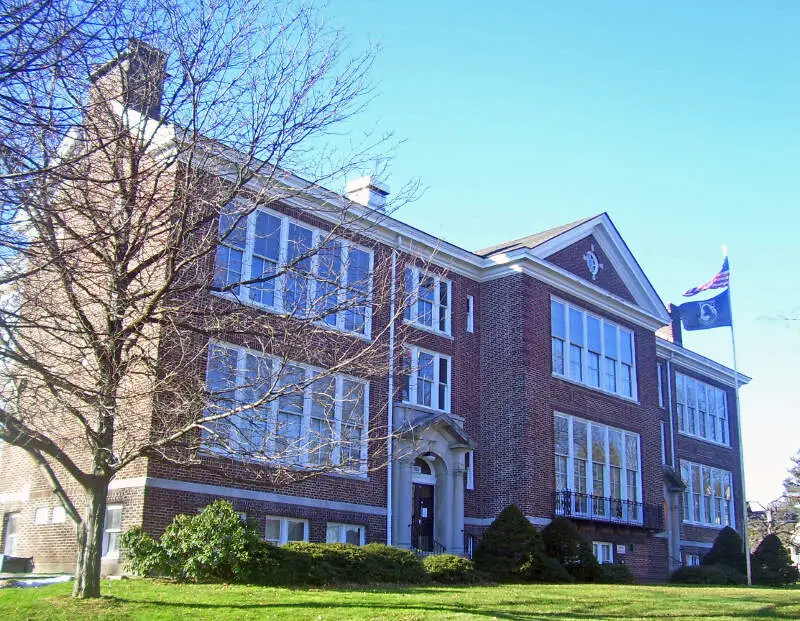
10. Albany
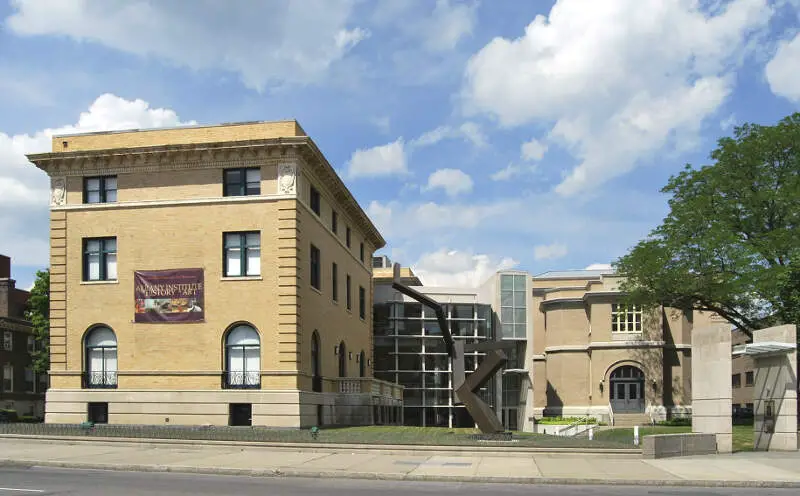
/10
Population: 100,492
% African American: 24.55%
# Of African American Residents: 24,671
Percent Change Since 2010: -12.27%
More on Albany: Data | Cost Of Living | Movers
Methodology: How We Determined The Cities In New York With The Largest Black Population For 2026
We still believe in the accuracy of data — especially from the Census. So that’s where we went to get the race breakdown across New York.
That leads us to the Census’s most recently available data, the 2020-2024 American Community Survey data from the US Census.
Specifically, we looked at table B03002: Hispanic OR LATINO ORIGIN BY RACE. Here are the category names as defined by the Census:
- Hispanic or Latino
- White alone*
- Black or African American alone*
- American Indian and Alaska Native alone*
- Asian alone*
- Native Hawaiian and Other Pacific Islander alone*
- Some other race alone*
- Two or more races*
Our particular column of interest was the number of people who identified as Black or African American.
We limited our analysis to non-CDPs with a population greater than 5,000 people in New York. That left us with 162 cities.
We then calculated the percentage of residents that are Black or African American. The percentages ranked from 56.9% to 0.0%.
Finally, we ranked each city based on the percentage of the Black population, with a higher score being more Black than a lower score. Mount Vernon took the distinction of being the most Black, while New Square was the least African American city.
We updated this article for 2026. This is our eleventh time ranking the cities in New York with the largest African American population.
Read on for more information on how the cities in New York ranked by population of African American residents or, for a more general take on diversity in America, head over to our ranking of the most diverse cities in America.
Summary: Black Populations Across New York
If you’re looking for a breakdown of African American populations across New York according to the most recent data, this is an accurate list.
The blackest cities in New York are Mount Vernon, Hempstead, Rochester, Freeport, Buffalo, Poughkeepsie, Spring Valley, Valley Stream, Syracuse, and Albany.
If you’re curious enough, here are the least African American places in New York:
- New Square
- Lancaster
- Lawrence
For more New York reading, check out:
- Worst Places To Live In New York State
- Best Places To Live In New York
- Safest Places In New York According To Science
African American Population By City In New York
| Rank | City | Population | African American Population | % African American |
|---|---|---|---|---|
| 1 | Mount Vernon | 72,427 | 41,219 | 56.91% |
| 2 | Hempstead | 58,801 | 25,373 | 43.15% |
| 3 | Rochester | 208,772 | 72,342 | 34.65% |
| 4 | Freeport | 44,088 | 14,349 | 32.55% |
| 5 | Buffalo | 276,854 | 86,532 | 31.26% |
| 6 | Poughkeepsie | 31,958 | 9,584 | 29.99% |
| 7 | Spring Valley | 33,192 | 9,503 | 28.63% |
| 8 | Valley Stream | 40,315 | 10,403 | 25.8% |
| 9 | Syracuse | 146,384 | 37,600 | 25.69% |
| 10 | Albany | 100,492 | 24,671 | 24.55% |
| 11 | Monticello | 7,279 | 1,785 | 24.52% |
| 12 | Newburgh | 28,519 | 6,972 | 24.45% |
| 13 | Middletown | 30,289 | 6,548 | 21.62% |
| 14 | New York | 8,483,844 | 1,730,658 | 20.4% |
| 15 | Schenectady | 68,847 | 12,865 | 18.69% |
| 16 | New Rochelle | 82,769 | 15,089 | 18.23% |
| 17 | Nyack | 7,393 | 1,344 | 18.18% |
| 18 | Niagara Falls | 47,987 | 8,565 | 17.85% |
| 19 | Westbury | 15,808 | 2,560 | 16.19% |
| 20 | Suffern | 11,441 | 1,832 | 16.01% |
| 21 | West Haverstraw | 10,711 | 1,712 | 15.98% |
| 22 | Troy | 51,033 | 7,914 | 15.51% |
| 23 | Utica | 64,217 | 9,865 | 15.36% |
| 24 | Lackawanna | 19,753 | 3,006 | 15.22% |
| 25 | Elmira | 26,257 | 3,879 | 14.77% |
| 26 | Yonkers | 209,978 | 30,732 | 14.64% |
| 27 | Haverstraw | 12,325 | 1,704 | 13.83% |
| 28 | Monroe | 9,515 | 1,287 | 13.53% |
| 29 | Peekskill | 25,625 | 3,427 | 13.37% |
| 30 | Binghamton | 47,151 | 6,125 | 12.99% |
| 31 | Walden | 6,868 | 886 | 12.9% |
| 32 | Hudson | 5,865 | 750 | 12.79% |
| 33 | Kingston | 23,911 | 3,033 | 12.68% |
| 34 | White Plains | 60,666 | 7,508 | 12.38% |
| 35 | Woodbury | 11,334 | 1,388 | 12.25% |
| 36 | Ossining | 26,950 | 2,880 | 10.69% |
| 37 | Lockport | 20,610 | 2,138 | 10.37% |
| 38 | Endicott | 13,387 | 1,354 | 10.11% |
| 39 | Watervliet | 10,287 | 966 | 9.39% |
| 40 | New Hempstead | 5,472 | 513 | 9.38% |
| 41 | Beacon | 14,834 | 1,312 | 8.84% |
| 42 | Geneva | 12,512 | 1,083 | 8.66% |
| 43 | Washingtonville | 5,707 | 481 | 8.43% |
| 44 | Brockport | 7,277 | 599 | 8.23% |
| 45 | Chestnut Ridge | 10,557 | 855 | 8.1% |
| 46 | Rensselaer | 9,287 | 747 | 8.04% |
| 47 | Port Chester | 31,102 | 2,467 | 7.93% |
| 48 | Lynbrook | 20,325 | 1,563 | 7.69% |
| 49 | Port Jervis | 8,652 | 654 | 7.56% |
| 50 | Cohoes | 18,159 | 1,358 | 7.48% |
| 51 | Johnson City | 14,940 | 1,113 | 7.45% |
| 52 | Pelham | 7,305 | 538 | 7.36% |
| 53 | Wappingers Falls | 5,761 | 421 | 7.31% |
| 54 | Webster | 5,718 | 407 | 7.12% |
| 55 | Mount Kisco | 10,737 | 757 | 7.05% |
| 56 | New Paltz | 8,314 | 582 | 7.0% |
| 57 | Auburn | 26,285 | 1,736 | 6.6% |
| 58 | Patchogue | 12,396 | 810 | 6.53% |
| 59 | Ogdensburg | 9,455 | 611 | 6.46% |
| 60 | Albion | 5,506 | 348 | 6.32% |
| 61 | Oneonta | 15,045 | 859 | 5.71% |
| 62 | Canton | 7,167 | 400 | 5.58% |
| 63 | Geneseo | 7,701 | 420 | 5.45% |
| 64 | Ithaca | 32,814 | 1,773 | 5.4% |
| 65 | Amsterdam | 18,166 | 962 | 5.3% |
| 66 | Batavia | 15,097 | 778 | 5.15% |
| 67 | Kenmore | 15,044 | 767 | 5.1% |
| 68 | Tarr | 11,784 | 596 | 5.06% |
| 69 | Rockville Centre | 25,765 | 1,250 | 4.85% |
| 70 | Mamaroneck | 19,826 | 951 | 4.8% |
| 71 | Tuckahoe | 6,973 | 333 | 4.78% |
| 72 | Potsdam | 8,427 | 397 | 4.71% |
| 73 | Lindenhurst | 27,142 | 1,262 | 4.65% |
| 74 | Watertown | 24,375 | 1,106 | 4.54% |
| 75 | Colonie | 7,702 | 338 | 4.39% |
| 76 | Rome | 31,795 | 1,384 | 4.35% |
| 77 | Glen Cove | 28,112 | 1,212 | 4.31% |
| 78 | Newark | 8,991 | 381 | 4.24% |
| 79 | Malverne | 8,477 | 354 | 4.18% |
| 80 | Fredonia | 9,467 | 388 | 4.1% |
| 81 | Solvay | 6,544 | 256 | 3.91% |
| 82 | Jamestown | 28,188 | 1,094 | 3.88% |
| 83 | Dunkirk | 12,549 | 476 | 3.79% |
| 84 | Harrison | 29,961 | 1,135 | 3.79% |
| 85 | East Rockaway | 10,077 | 381 | 3.78% |
| 86 | Hornell | 8,152 | 291 | 3.57% |
| 87 | Glens Falls | 14,609 | 502 | 3.44% |
| 88 | Pelham Manor | 5,644 | 193 | 3.42% |
| 89 | Sleepy Hollow | 10,887 | 363 | 3.33% |
| 90 | Amityville | 9,588 | 314 | 3.27% |
| 91 | East Rochester | 6,218 | 202 | 3.25% |
| 92 | Plattsburgh | 19,830 | 634 | 3.2% |
| 93 | Airmont | 10,205 | 325 | 3.18% |
| 94 | North Syracuse | 6,693 | 213 | 3.18% |
| 95 | Olean | 13,738 | 416 | 3.03% |
| 96 | Great Neck | 11,087 | 329 | 2.97% |
| 97 | Cortland | 17,450 | 504 | 2.89% |
| 98 | Horseheads | 6,449 | 184 | 2.85% |
| 99 | Farmingdale | 8,474 | 240 | 2.83% |
| 100 | Long Beach | 34,756 | 902 | 2.6% |
This is wrong. The city with the largest Black population in NY and also the whole nation is NYC. NYC has about 2 million Black people. If fact there are 200,000 Black business in NYC. Just the number of Black businesses in NYC is almost 4 times Black residents in Mt. Vernon.
NYC has more Blacks than any other city in the nation. White publications should stick to what they know best and leave the demographics to us.
Well done Kamau! And, this is why there’s no place I’d rather live!!