
Most African American cities in North Carolina research summary. We used Saturday Night Science to analyze North Carolina’s most recent Census data to determine the blackest cities in North Carolina based on the percentage of Black residents. Here are the results of our analysis:
-
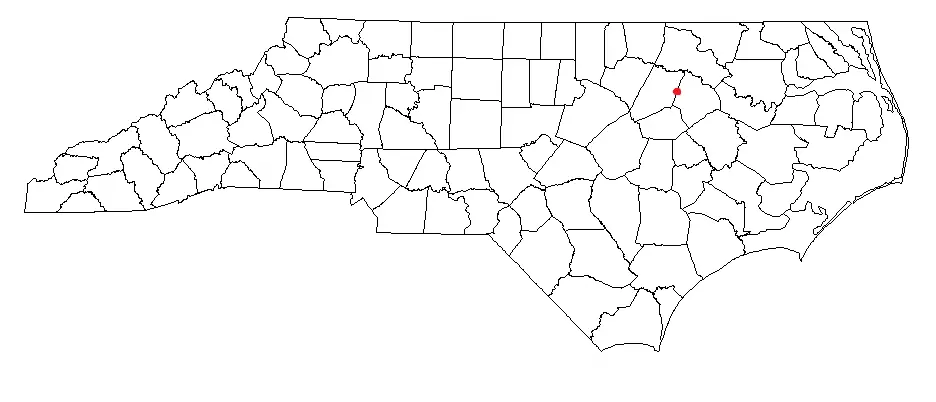
The city with the largest African American population in North Carolina is Wadesboro based on the most recent Census data.
-
Wadesboro is 69.12% Black.
-
The least African American city in North Carolina is Carolina Beach.
-
Carolina Beach is 0.0% Black.
-
North Carolina is 20.6% Black.
-
North Carolina is the 8th blackest state in the United States.
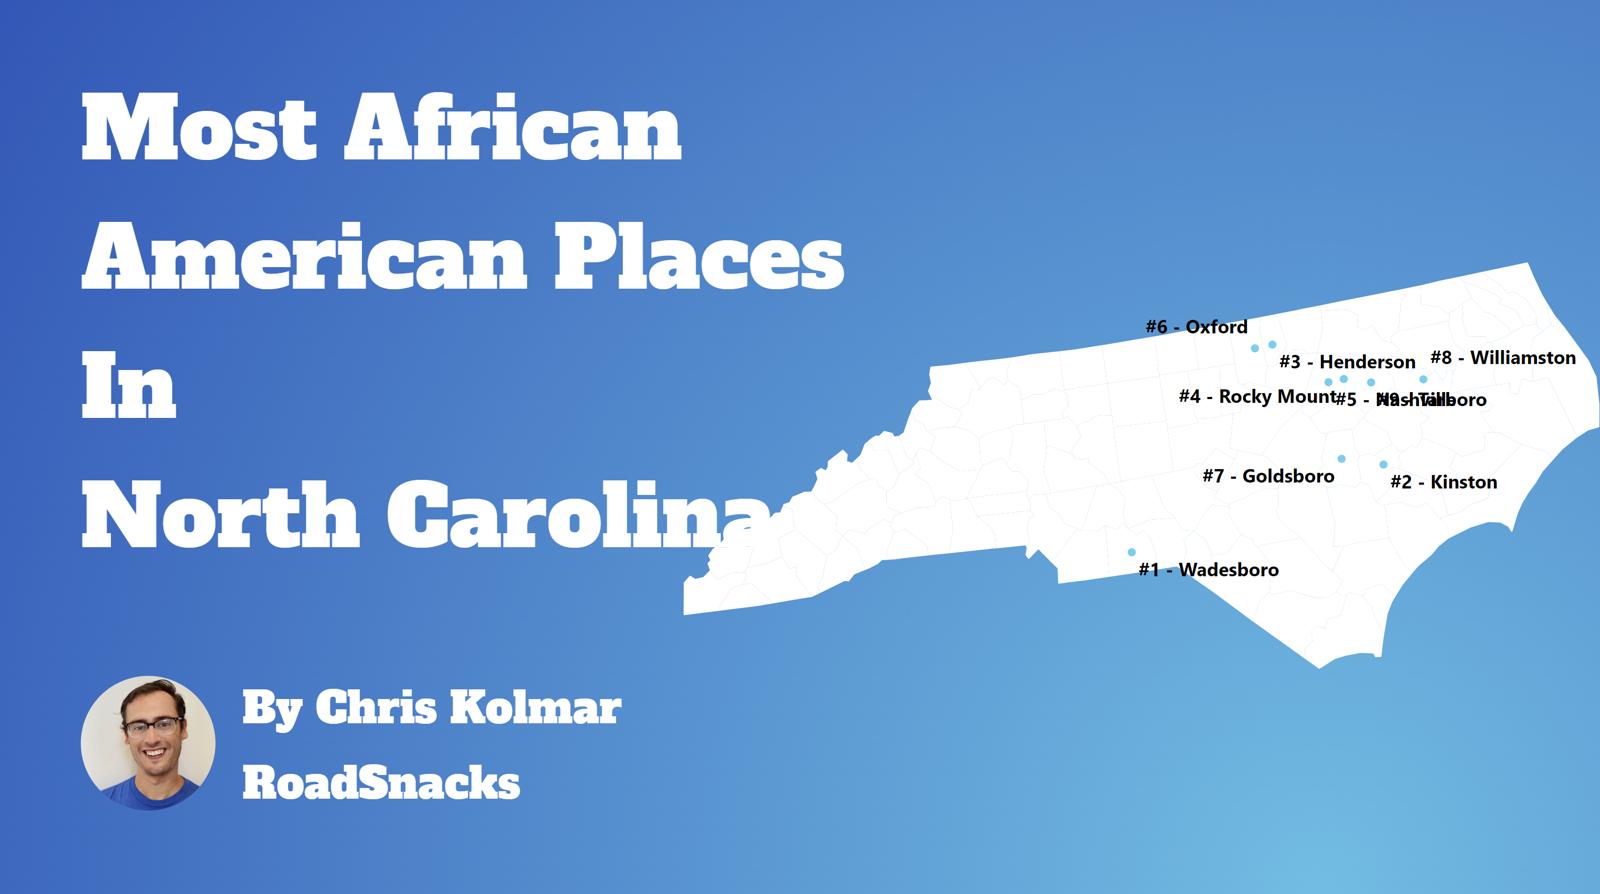
Table Of Contents: Top Ten | Methodology | Summary | Table
The Black community is one of the fastest-growing communities in America this decade.
Roughly 42 million people identifying as Black or African American live in the United States, making up 12% of the total population. According to the most recent American Community Survey, the Black population in North Carolina is 2,161,841 – at 20.6% of the total population of North Carolina.
The percentage growth of Blacks in America is the third largest percentage change for any race according to the Census’s race and ethnicity definition. Most scholars and historians agree that increasing diversity in America is a good thing.
We agree.
But how has the increase in the black population impacted North Carolina? Which cities and towns in North Carolina have seen the greatest increase in its Black population?
We broke down the most recent census data to determine the cities in North Carolina with the largest African American population in 2024:
Most African American Places In North Carolina
What’s the blackest city in North Carolina? The city with the largest Black population in North Carolina for 2024 is Wadesboro. See if Wadesboro ranked as one of the most african american places in America.
And if you already knew these places were Black, check out the best places to live in North Carolina or the most diverse places in North Carolina.
The 10 Blackest Cities In North Carolina For 2024
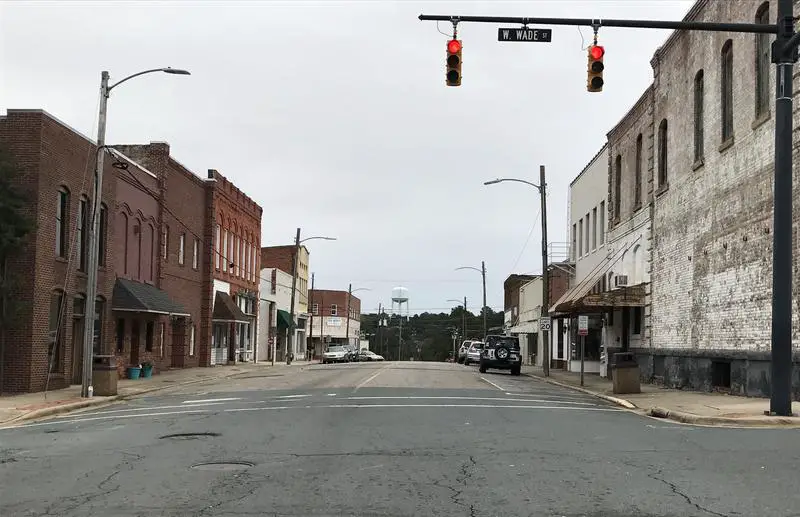
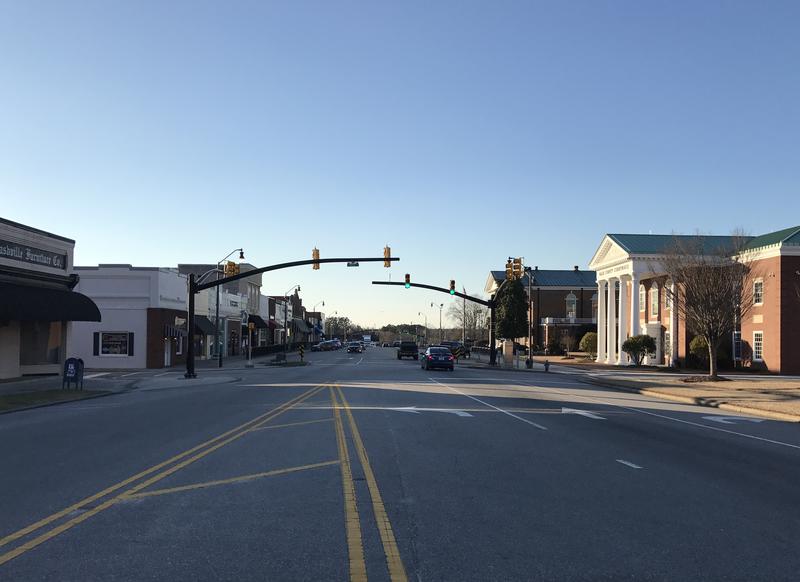
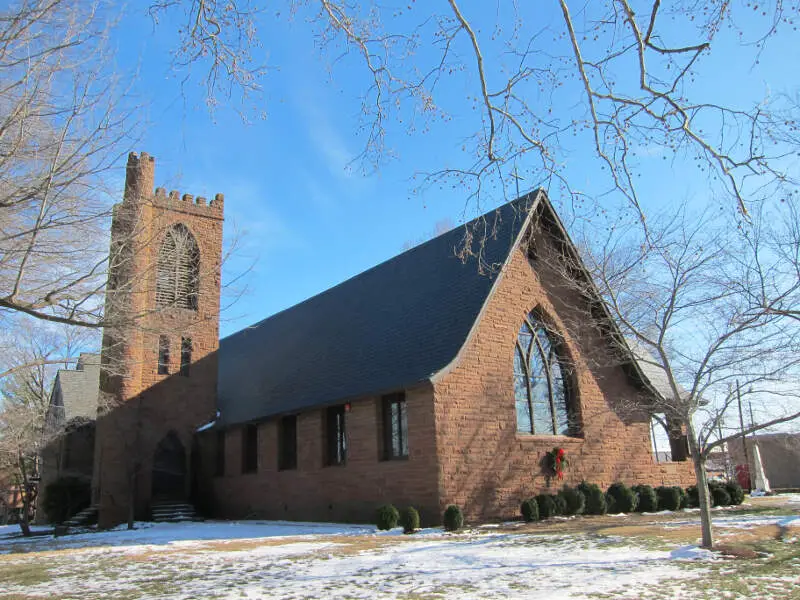
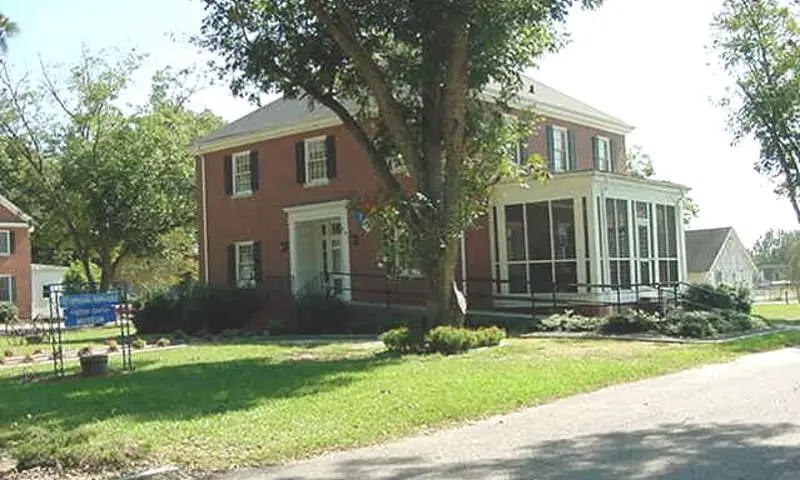
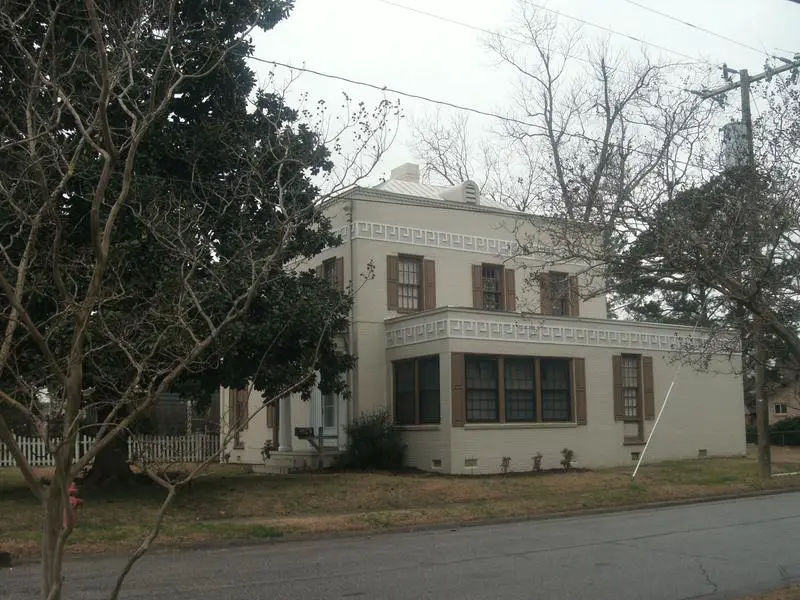
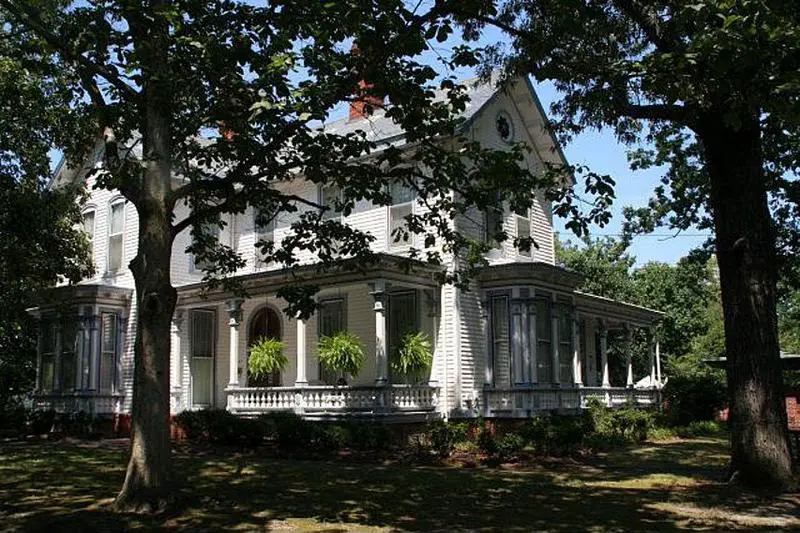
1. Wadesboro
/10
Population: 5,004
% African American: 69.12%
# Of African American Residents: 3,459
Percent Change Since 2010: 18.5%
More on Wadesboro: Data | Cost Of Living
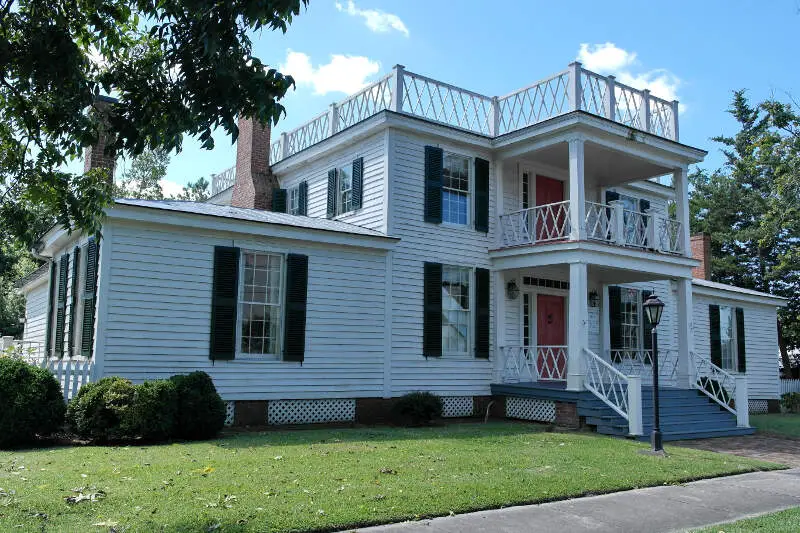
2. Kinston
/10
Population: 19,704
% African American: 68.82%
# Of African American Residents: 13,561
Percent Change Since 2010: -7.71%
More on Kinston: Data | Cost Of Living
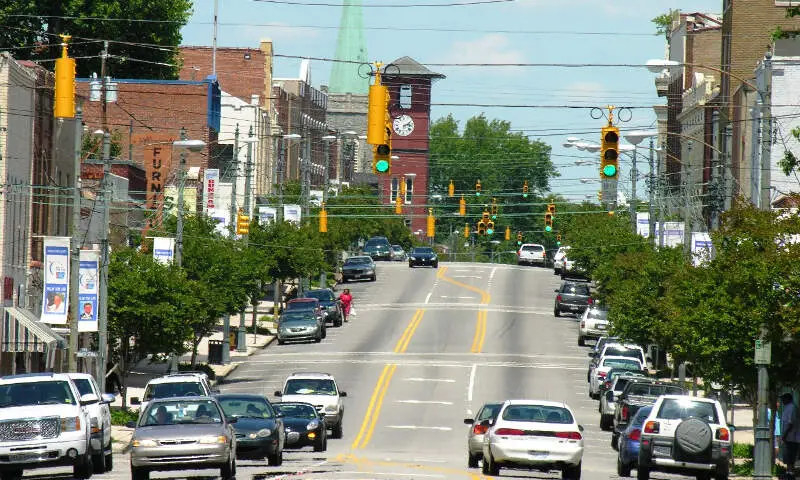
3. Henderson
/10
Population: 14,997
% African American: 63.11%
# Of African American Residents: 9,465
Percent Change Since 2010: 3.51%
More on Henderson: Data | Cost Of Living
4. Rocky Mount
/10
Population: 54,260
% African American: 62.02%
# Of African American Residents: 33,654
Percent Change Since 2010: -1.54%
More on Rocky Mount: Data | Cost Of Living
5. Nashville
/10
Population: 5,624
% African American: 61.7%
# Of African American Residents: 3,470
Percent Change Since 2010: 54.77%
More on Nashville: Data | Cost Of Living
6. Oxford
/10
Population: 8,685
% African American: 55.65%
# Of African American Residents: 4,833
Percent Change Since 2010: 2.87%
More on Oxford: Data | Cost Of Living
7. Goldsboro
/10
Population: 33,566
% African American: 54.42%
# Of African American Residents: 18,265
Percent Change Since 2010: -8.67%
More on Goldsboro: Data | Cost Of Living
8. Williamston
/10
Population: 5,224
% African American: 52.7%
# Of African American Residents: 2,753
Percent Change Since 2010: -14.58%
More on Williamston: Data | Cost Of Living
9. Tarboro
/10
Population: 10,696
% African American: 49.7%
# Of African American Residents: 5,316
Percent Change Since 2010: 6.09%
More on Tarboro: Data | Cost Of Living
10. Wilson
/10
Population: 47,767
% African American: 49.09%
# Of African American Residents: 23,451
Percent Change Since 2010: 3.78%
More on Wilson: Data | Cost Of Living
Methodology: How We Determined The Cities In North Carolina With The Largest Black Population For 2024
We still believe in the accuracy of data — especially from the Census. So that’s where we went to get the race breakdown across North Carolina.
That leads us to the Census’s most recently available data, the 2018-2022 American Community Survey data from the US Census.
Specifically, we looked at table B03002: Hispanic OR LATINO ORIGIN BY RACE. Here are the category names as defined by the Census:
- Hispanic or Latino
- White alone*
- Black or African American alone*
- American Indian and Alaska Native alone*
- Asian alone*
- Native Hawaiian and Other Pacific Islander alone*
- Some other race alone*
- Two or more races*
Our particular column of interest was the number of people who identified as Black or African American.
We limited our analysis to non-CDPs with a population greater than 5,000 people in North Carolina. That left us with 125 cities.
We then calculated the percentage of residents that are Black or African American. The percentages ranked from 69.1% to 0.0%.
Finally, we ranked each city based on the percentage of the Black population, with a higher score being more Black than a lower score. Wadesboro took the distinction of being the most Black, while Carolina Beach was the least African American city.
We updated this article for 2024. This is our tenth time ranking the cities in North Carolina with the largest African American population.
Read on for more information on how the cities in North Carolina ranked by population of African American residents or, for a more general take on diversity in America, head over to our ranking of the most diverse cities in America.
Summary: Black Populations Across North Carolina
If you’re looking for a breakdown of African American populations across North Carolina according to the most recent data, this is an accurate list.
The blackest cities in North Carolina are Wadesboro, Kinston, Henderson, Rocky Mount, Nashville, Oxford, Goldsboro, Williamston, Tarboro, and Wilson.
If you’re curious enough, here are the least African American places in North Carolina:
- Carolina Beach
- Sawmills
- Oak Island
For more North Carolina reading, check out:
- Worst Places To Live In North Carolina
- Best Places To Live In North Carolina
- Cheapest Places To Live In North Carolina
African American Population By City In North Carolina
| Rank | City | Population | African American Population | % African American |
|---|---|---|---|---|
| 1 | Wadesboro | 5,004 | 3,459 | 69.12% |
| 2 | Kinston | 19,704 | 13,561 | 68.82% |
| 3 | Henderson | 14,997 | 9,465 | 63.11% |
| 4 | Rocky Mount | 54,260 | 33,654 | 62.02% |
| 5 | Nashville | 5,624 | 3,470 | 61.7% |
| 6 | Oxford | 8,685 | 4,833 | 55.65% |
| 7 | Goldsboro | 33,566 | 18,265 | 54.42% |
| 8 | Williamston | 5,224 | 2,753 | 52.7% |
| 9 | Tarboro | 10,696 | 5,316 | 49.7% |
| 10 | Wilson | 47,767 | 23,451 | 49.09% |
| 11 | Laurinburg | 14,971 | 7,326 | 48.93% |
| 12 | Elizabeth City | 18,570 | 9,021 | 48.58% |
| 13 | Knightdale | 19,127 | 9,017 | 47.14% |
| 14 | Hamlet | 6,043 | 2,729 | 45.16% |
| 15 | Selma | 6,449 | 2,869 | 44.49% |
| 16 | Washington | 9,759 | 4,209 | 43.13% |
| 17 | Greensboro | 297,202 | 126,489 | 42.56% |
| 18 | Fayetteville | 208,697 | 86,376 | 41.39% |
| 19 | Greenville | 87,894 | 35,177 | 40.02% |
| 20 | Clinton | 8,362 | 3,186 | 38.1% |
| 21 | Dunn | 8,549 | 3,205 | 37.49% |
| 22 | Reidsville | 14,526 | 5,371 | 36.98% |
| 23 | Lumberton | 19,099 | 6,984 | 36.57% |
| 24 | Salisbury | 35,437 | 12,950 | 36.54% |
| 25 | Winterville | 10,510 | 3,825 | 36.39% |
| 26 | Durham | 284,094 | 101,750 | 35.82% |
| 27 | Rockingham | 9,174 | 3,206 | 34.95% |
| 28 | Charlotte | 875,045 | 303,980 | 34.74% |
| 29 | Roxboro | 8,131 | 2,815 | 34.62% |
| 30 | Roanoke Rapids | 15,143 | 5,147 | 33.99% |
| 31 | Butner | 8,374 | 2,830 | 33.8% |
| 32 | Shelby | 21,712 | 7,269 | 33.48% |
| 33 | Hope Mills | 17,671 | 5,878 | 33.26% |
| 34 | Winston-Salem | 249,571 | 80,940 | 32.43% |
| 35 | High Point | 114,120 | 36,331 | 31.84% |
| 36 | Spring Lake | 11,710 | 3,674 | 31.37% |
| 37 | Lexington | 19,595 | 6,025 | 30.75% |
| 38 | New Bern | 31,373 | 9,590 | 30.57% |
| 39 | Gastonia | 80,615 | 23,942 | 29.7% |
| 40 | Gibsonville | 8,827 | 2,620 | 29.68% |
| 41 | Smithfield | 11,527 | 3,328 | 28.87% |
| 42 | Wendell | 10,575 | 3,040 | 28.75% |
| 43 | Eden | 15,349 | 4,372 | 28.48% |
| 44 | Statesville | 28,576 | 8,136 | 28.47% |
| 45 | Forest City | 7,357 | 2,091 | 28.42% |
| 46 | Burlington | 56,951 | 16,155 | 28.37% |
| 47 | Raleigh | 465,517 | 127,830 | 27.46% |
| 48 | Kings Mountain | 11,246 | 2,907 | 25.85% |
| 49 | Sanford | 30,373 | 7,673 | 25.26% |
| 50 | Pineville | 10,532 | 2,579 | 24.49% |
| 51 | Mebane | 17,899 | 4,370 | 24.41% |
| 52 | Albemarle | 16,444 | 4,014 | 24.41% |
| 53 | Garner | 31,684 | 7,638 | 24.11% |
| 54 | Graham | 17,136 | 4,054 | 23.66% |
| 55 | Clayton | 26,837 | 6,309 | 23.51% |
| 56 | Monroe | 34,897 | 8,010 | 22.95% |
| 57 | Kannapolis | 53,314 | 11,683 | 21.91% |
| 58 | Concord | 105,335 | 22,868 | 21.71% |
| 59 | Lincolnton | 11,225 | 2,315 | 20.62% |
| 60 | Wake Forest | 48,047 | 8,597 | 17.89% |
| 61 | Thomasville | 27,130 | 4,839 | 17.84% |
| 62 | Jacksonville | 71,908 | 12,759 | 17.74% |
| 63 | Harrisburg | 18,934 | 3,334 | 17.61% |
| 64 | Kernersville | 27,177 | 4,550 | 16.74% |
| 65 | Wilmington | 116,933 | 18,792 | 16.07% |
| 66 | Havelock | 16,759 | 2,647 | 15.79% |
| 67 | Fuquay-Varina | 35,428 | 5,555 | 15.68% |
| 68 | Aberdeen | 8,674 | 1,359 | 15.67% |
| 69 | Mint Hill | 26,537 | 4,040 | 15.22% |
| 70 | Siler City | 7,847 | 1,155 | 14.72% |
| 71 | Mount Holly | 17,644 | 2,515 | 14.25% |
| 72 | Lenoir | 18,301 | 2,514 | 13.74% |
| 73 | Asheboro | 27,117 | 3,619 | 13.35% |
| 74 | Southern Pines | 15,701 | 2,087 | 13.29% |
| 75 | Morganton | 17,457 | 2,315 | 13.26% |
| 76 | Hickory | 43,352 | 5,733 | 13.22% |
| 77 | Lewisville | 13,509 | 1,770 | 13.1% |
| 78 | Huntersville | 61,202 | 7,935 | 12.97% |
| 79 | Brevard | 7,777 | 1,004 | 12.91% |
| 80 | Carrboro | 21,242 | 2,734 | 12.87% |
| 81 | Hillsborough | 9,534 | 1,185 | 12.43% |
| 82 | Matthews | 29,613 | 3,561 | 12.03% |
| 83 | Marion | 7,652 | 890 | 11.63% |
| 84 | Morrisville | 29,756 | 3,435 | 11.54% |
| 85 | Newton | 13,173 | 1,478 | 11.22% |
| 86 | Asheville | 93,695 | 9,735 | 10.39% |
| 87 | Mooresville | 50,025 | 5,179 | 10.35% |
| 88 | Chapel Hill | 58,919 | 6,082 | 10.32% |
| 89 | Bessemer City | 5,472 | 553 | 10.11% |
| 90 | Stallings | 16,193 | 1,592 | 9.83% |
| 91 | Wesley Chapel | 8,763 | 852 | 9.72% |
| 92 | Mount Airy | 10,621 | 1,023 | 9.63% |
| 93 | Holly Springs | 42,023 | 4,005 | 9.53% |
| 94 | Indian Trail | 40,325 | 3,595 | 8.92% |
| 95 | Leland | 24,473 | 2,140 | 8.74% |
| 96 | Davidson | 15,199 | 1,243 | 8.18% |
| 97 | Waxhaw | 20,665 | 1,659 | 8.03% |
| 98 | Cary | 174,880 | 14,021 | 8.02% |
| 99 | Apex | 65,541 | 5,052 | 7.71% |
| 100 | Elon | 11,161 | 771 | 6.91% |
What about East Spencer in Rowan County? The percentage of black people is 85%
Love these reports. I am looking to move and this helps tremendously. Thanks again.