
Most African American cities in Pennsylvania research summary. We used Saturday Night Science to analyze Pennsylvania’s most recent Census data to determine the blackest cities in Pennsylvania based on the percentage of Black residents. Here are the results of our analysis:
-
The city with the largest African American population in Pennsylvania is Yeadon based on the most recent Census data.
-
Yeadon is 85.08% Black.
-
The least African American city in Pennsylvania is Olyphant.
-
Olyphant is 0.0% Black.
-
Pennsylvania is 10.3% Black.
-
Pennsylvania is the 20th blackest state in the United States.
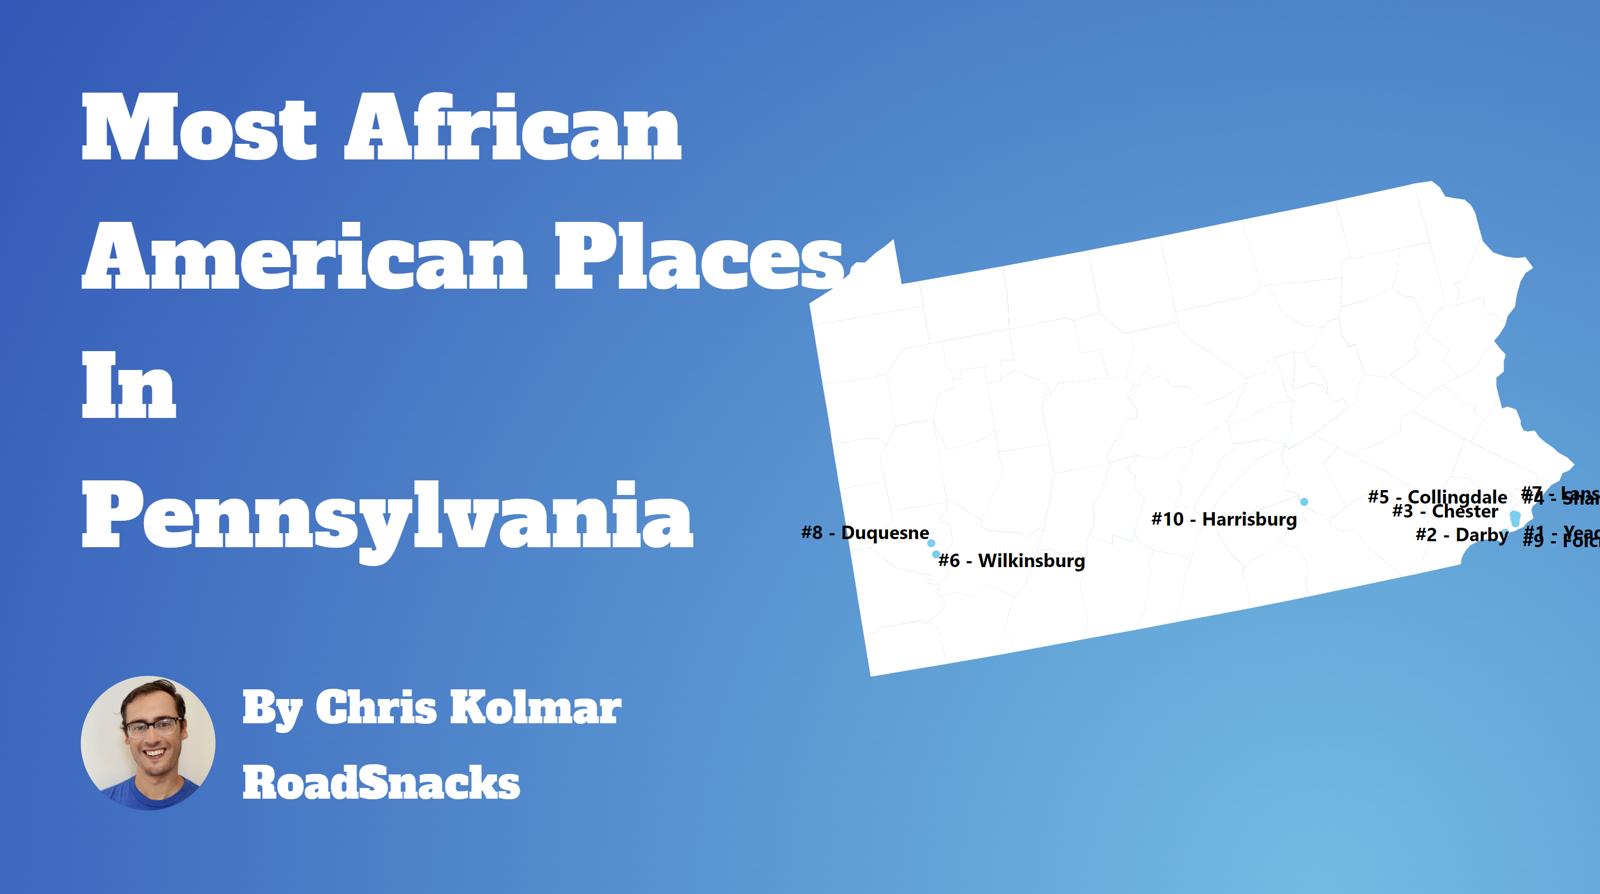
Table Of Contents: Top Ten | Methodology | Summary | Table
The Black community is one of the fastest-growing communities in America this decade.
Roughly 42 million people identifying as Black or African American live in the United States, making up 12% of the total population. According to the most recent American Community Survey, the Black population in Pennsylvania is 1,339,554 – at 10.3% of the total population of Pennsylvania.
The percentage growth of Blacks in America is the third largest percentage change for any race according to the Census’s race and ethnicity definition. Most scholars and historians agree that increasing diversity in America is a good thing.
We agree.
But how has the increase in the black population impacted Pennsylvania? Which cities and towns in Pennsylvania have seen the greatest increase in its Black population?
We broke down the most recent census data to determine the cities in Pennsylvania with the largest African American population in 2025:
Most African American Places In Pennsylvania
What’s the blackest city in Pennsylvania? The city with the largest Black population in Pennsylvania for 2025 is Yeadon. See if Yeadon ranked as one of the most african american places in America.
And if you already knew these places were Black, check out the best places to live in Pennsylvania or the most diverse places in Pennsylvania.
The 10 Blackest Cities In Pennsylvania For 2025
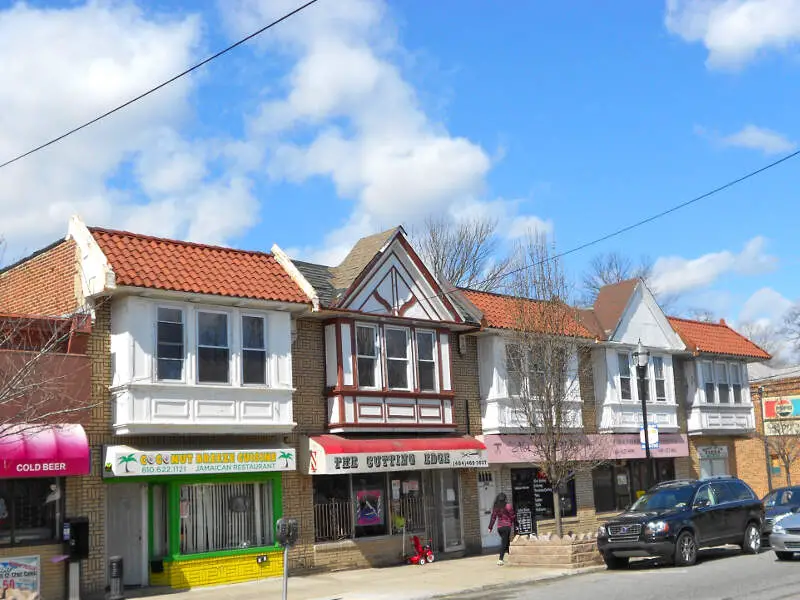
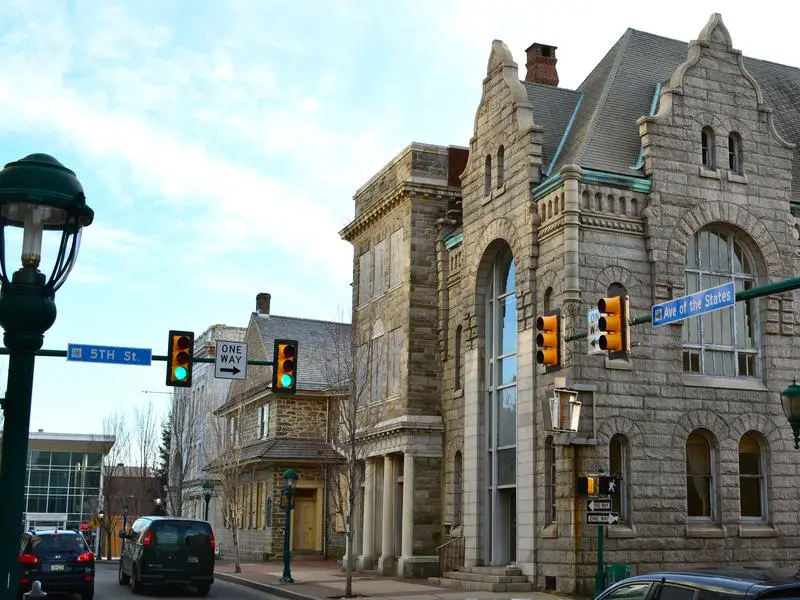
1. Yeadon
/10
Population: 12,091
% African American: 85.08%
# Of African American Residents: 10,287
Percent Change Since 2010: -0.6%
More on Yeadon: Data
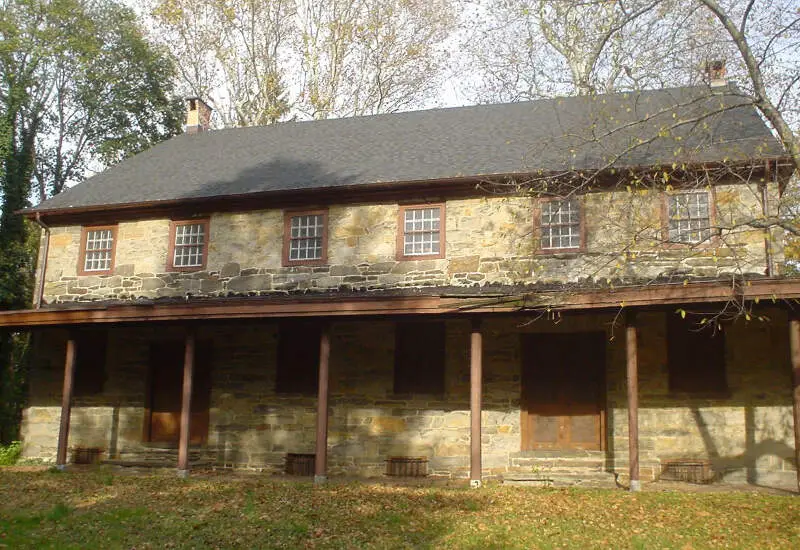
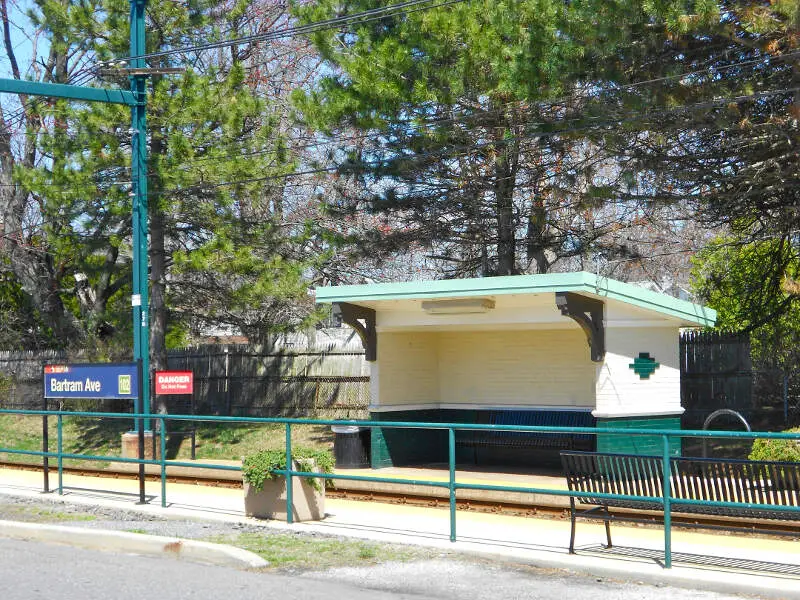
2. Darby
/10
Population: 10,664
% African American: 85.03%
# Of African American Residents: 9,068
Percent Change Since 2010: 11.39%
More on Darby: Data
3. Sharon Hill
/10
Population: 5,978
% African American: 71.41%
# Of African American Residents: 4,269
Percent Change Since 2010: 43.79%
More on Sharon Hill: Data
4. Chester
/10
Population: 33,209
% African American: 70.85%
# Of African American Residents: 23,530
Percent Change Since 2010: -14.42%
More on Chester: Data
5. Collingdale
/10
Population: 8,862
% African American: 60.64%
# Of African American Residents: 5,374
Percent Change Since 2010: 94.78%
More on Collingdale: Data
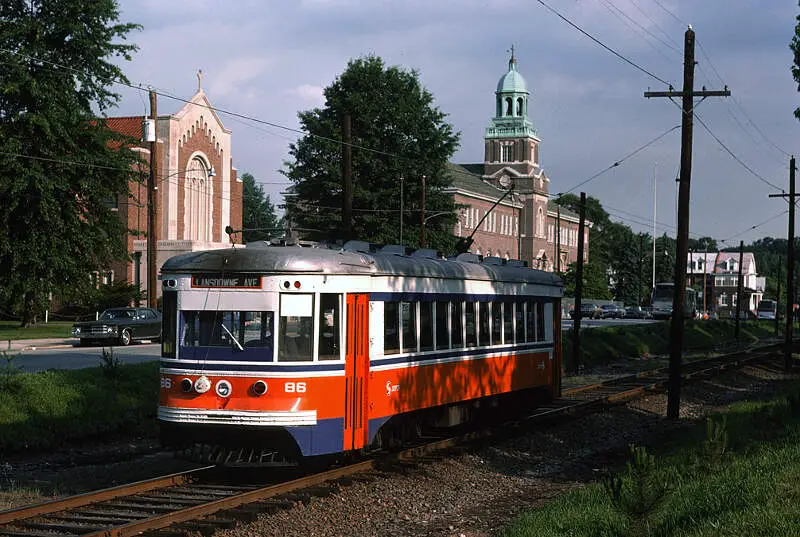
6. Lansdowne
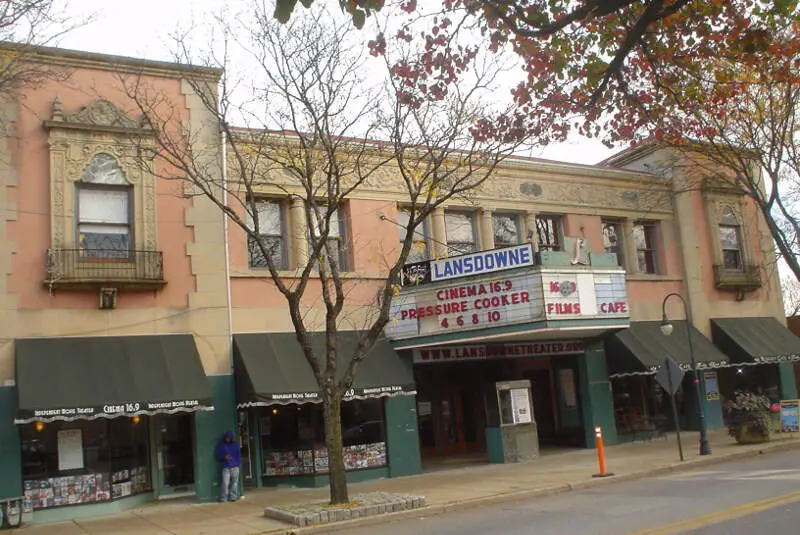
/10
Population: 11,064
% African American: 49.59%
# Of African American Residents: 5,487
Percent Change Since 2010: 31.55%
More on Lansdowne: Data
7. Wilkinsburg
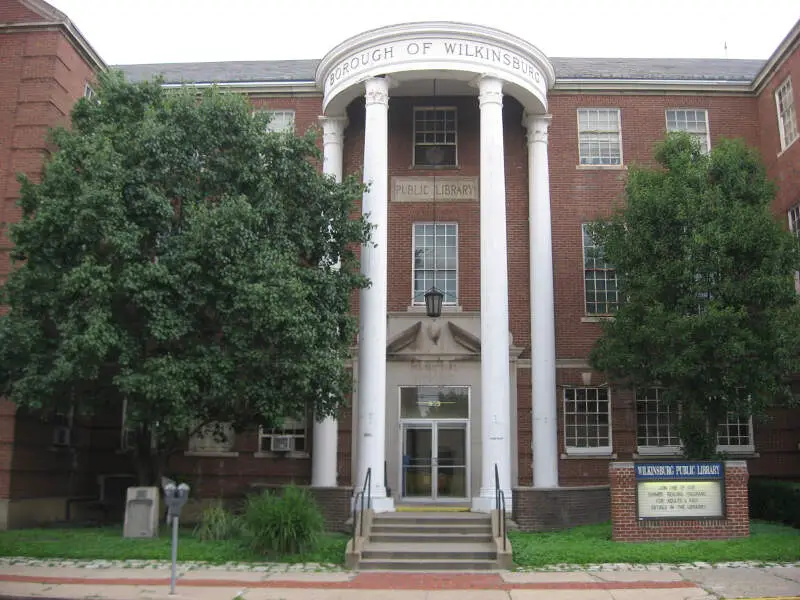
/10
Population: 14,165
% African American: 48.02%
# Of African American Residents: 6,802
Percent Change Since 2010: -35.4%
More on Wilkinsburg: Data
8. Clairton
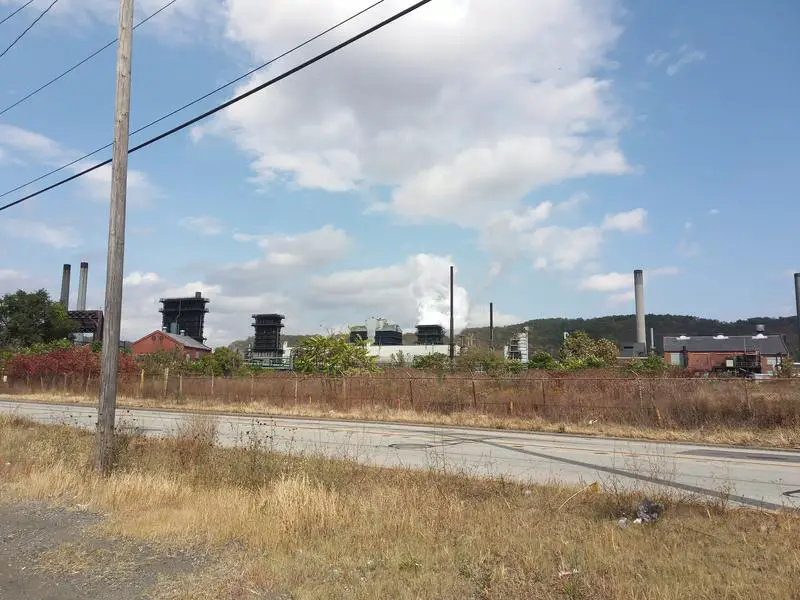
/10
Population: 6,105
% African American: 44.65%
# Of African American Residents: 2,726
Percent Change Since 2010: 27.15%
More on Clairton: Data
9. Duquesne
/10
Population: 5,186
% African American: 43.91%
# Of African American Residents: 2,277
Percent Change Since 2010: -19.6%
More on Duquesne: Data
10. Folcroft
/10
Population: 6,748
% African American: 42.8%
# Of African American Residents: 2,888
Percent Change Since 2010: 78.93%
More on Folcroft: Data
Methodology: How We Determined The Cities In Pennsylvania With The Largest Black Population For 2025
We still believe in the accuracy of data — especially from the Census. So that’s where we went to get the race breakdown across Pennsylvania.
That leads us to the Census’s most recently available data, the 2019-2023 American Community Survey data from the US Census.
Specifically, we looked at table B03002: Hispanic OR LATINO ORIGIN BY RACE. Here are the category names as defined by the Census:
- Hispanic or Latino
- White alone*
- Black or African American alone*
- American Indian and Alaska Native alone*
- Asian alone*
- Native Hawaiian and Other Pacific Islander alone*
- Some other race alone*
- Two or more races*
Our particular column of interest was the number of people who identified as Black or African American.
We limited our analysis to non-CDPs with a population greater than 5,000 people in Pennsylvania. That left us with 185 cities.
We then calculated the percentage of residents that are Black or African American. The percentages ranked from 85.1% to 0.0%.
Finally, we ranked each city based on the percentage of the Black population, with a higher score being more Black than a lower score. Yeadon took the distinction of being the most Black, while Olyphant was the least African American city.
We updated this article for 2025. This is our tenth time ranking the cities in Pennsylvania with the largest African American population.
Read on for more information on how the cities in Pennsylvania ranked by population of African American residents or, for a more general take on diversity in America, head over to our ranking of the most diverse cities in America.
Summary: Black Populations Across Pennsylvania
If you’re looking for a breakdown of African American populations across Pennsylvania according to the most recent data, this is an accurate list.
The blackest cities in Pennsylvania are Yeadon, Darby, Sharon Hill, Chester, Collingdale, Lansdowne, Wilkinsburg, Clairton, Duquesne, and Folcroft.
If you’re curious enough, here are the least African American places in Pennsylvania:
- Olyphant
- Palmerton
- Lehighton
For more Pennsylvania reading, check out:
- Best Places To Raise A Family In Pennsylvania
- Worst Places To Live In Pennsylvania
- Cheapest Places To Live In Pennsylvania
African American Population By City In Pennsylvania
| Rank | City | Population | African American Population | % African American |
|---|---|---|---|---|
| 1 | Yeadon | 12,091 | 10,287 | 85.08% |
| 2 | Darby | 10,664 | 9,068 | 85.03% |
| 3 | Sharon Hill | 5,978 | 4,269 | 71.41% |
| 4 | Chester | 33,209 | 23,530 | 70.85% |
| 5 | Collingdale | 8,862 | 5,374 | 60.64% |
| 6 | Lansdowne | 11,064 | 5,487 | 49.59% |
| 7 | Wilkinsburg | 14,165 | 6,802 | 48.02% |
| 8 | Clairton | 6,105 | 2,726 | 44.65% |
| 9 | Duquesne | 5,186 | 2,277 | 43.91% |
| 10 | Folcroft | 6,748 | 2,888 | 42.8% |
| 11 | Harrisburg | 50,092 | 20,790 | 41.5% |
| 12 | Philadelphia | 1,582,432 | 614,807 | 38.85% |
| 13 | Mckeesport | 17,520 | 6,672 | 38.08% |
| 14 | Clifton Heights | 6,821 | 2,572 | 37.71% |
| 15 | Aliquippa | 9,146 | 3,405 | 37.23% |
| 16 | Steelton | 6,267 | 2,197 | 35.06% |
| 17 | Coatesville | 13,323 | 4,604 | 34.56% |
| 18 | Norri | 35,782 | 11,509 | 32.16% |
| 19 | Swissvale | 8,499 | 2,329 | 27.4% |
| 20 | Mckees Rocks | 5,827 | 1,493 | 25.62% |
| 21 | Beaver Falls | 8,885 | 2,245 | 25.27% |
| 22 | Turtle Creek | 5,046 | 1,250 | 24.77% |
| 23 | York | 44,830 | 10,429 | 23.26% |
| 24 | Pittsburgh | 303,620 | 67,779 | 22.32% |
| 25 | Pott | 23,392 | 5,199 | 22.23% |
| 26 | Monessen | 6,825 | 1,271 | 18.62% |
| 27 | Glenolden | 7,207 | 1,264 | 17.54% |
| 28 | East Stroudsburg | 9,278 | 1,625 | 17.51% |
| 29 | Uniontown | 9,819 | 1,613 | 16.43% |
| 30 | Sharon | 13,019 | 2,032 | 15.61% |
| 31 | Erie | 94,156 | 14,493 | 15.39% |
| 32 | Coraopolis | 5,464 | 800 | 14.64% |
| 33 | Munhall | 10,633 | 1,540 | 14.48% |
| 34 | Wilson | 8,196 | 1,157 | 14.12% |
| 35 | Easton | 29,079 | 4,035 | 13.88% |
| 36 | Ambridge | 6,912 | 944 | 13.66% |
| 37 | Johnstown | 18,245 | 2,468 | 13.53% |
| 38 | Washington | 13,361 | 1,804 | 13.5% |
| 39 | Ambler | 6,822 | 902 | 13.22% |
| 40 | Williamsport | 27,629 | 3,548 | 12.84% |
| 41 | West Chester | 19,235 | 2,381 | 12.38% |
| 42 | New Kensington | 12,072 | 1,472 | 12.19% |
| 43 | Lancaster | 57,683 | 7,016 | 12.16% |
| 44 | California | 5,046 | 590 | 11.69% |
| 45 | Stroudsburg | 5,898 | 689 | 11.68% |
| 46 | Wilkes-Barre | 44,217 | 5,153 | 11.65% |
| 47 | Allentown | 125,320 | 13,766 | 10.98% |
| 48 | Downin | 8,163 | 887 | 10.87% |
| 49 | New Brighton | 5,600 | 607 | 10.84% |
| 50 | Bellevue | 8,186 | 869 | 10.62% |
| 51 | Prospect Park | 6,402 | 673 | 10.51% |
| 52 | New Castle | 21,727 | 2,253 | 10.37% |
| 53 | Swarthmore | 6,524 | 667 | 10.22% |
| 54 | Carlisle | 21,335 | 2,119 | 9.93% |
| 55 | Carnegie | 8,015 | 791 | 9.87% |
| 56 | Forest Hills | 6,332 | 611 | 9.65% |
| 57 | Kingston | 13,333 | 1,268 | 9.51% |
| 58 | Chambersburg | 22,051 | 2,001 | 9.07% |
| 59 | West Mifflin | 19,338 | 1,668 | 8.63% |
| 60 | Jeannette | 8,719 | 738 | 8.46% |
| 61 | Bethlehem | 77,069 | 6,476 | 8.4% |
| 62 | Morrisville | 9,740 | 794 | 8.15% |
| 63 | Brookhaven | 8,288 | 673 | 8.12% |
| 64 | Crafton | 5,995 | 485 | 8.09% |
| 65 | Nanticoke | 10,610 | 856 | 8.07% |
| 66 | Reading | 94,836 | 7,429 | 7.83% |
| 67 | Middl | 9,567 | 740 | 7.73% |
| 68 | Brentwood | 9,927 | 762 | 7.68% |
| 69 | Collegeville | 5,226 | 400 | 7.65% |
| 70 | Ridley Park | 7,245 | 549 | 7.58% |
| 71 | Hatboro | 8,219 | 557 | 6.78% |
| 72 | Scranton | 76,074 | 4,831 | 6.35% |
| 73 | Columbia | 10,217 | 635 | 6.22% |
| 74 | Lansdale | 18,865 | 1,160 | 6.15% |
| 75 | Pleasant Hills | 8,418 | 497 | 5.9% |
| 76 | Dormont | 8,120 | 478 | 5.89% |
| 77 | Meadville | 12,723 | 748 | 5.88% |
| 78 | Plymouth | 5,761 | 335 | 5.81% |
| 79 | Pittston | 7,618 | 427 | 5.61% |
| 80 | Indiana | 14,170 | 784 | 5.53% |
| 81 | Exeter | 5,514 | 290 | 5.26% |
| 82 | Red Lion | 6,494 | 314 | 4.84% |
| 83 | Phoenixville | 19,062 | 913 | 4.79% |
| 84 | Castle Shannon | 8,237 | 391 | 4.75% |
| 85 | Franklin | 6,026 | 286 | 4.75% |
| 86 | Gettysburg | 7,929 | 359 | 4.53% |
| 87 | Canonsburg | 9,682 | 428 | 4.42% |
| 88 | Lock Haven | 8,386 | 357 | 4.26% |
| 89 | Selinsgrove | 5,655 | 239 | 4.23% |
| 90 | Whitehall | 14,863 | 619 | 4.16% |
| 91 | Waynesboro | 11,044 | 459 | 4.16% |
| 92 | Berwick | 10,291 | 421 | 4.09% |
| 93 | Bloomsburg | 12,906 | 524 | 4.06% |
| 94 | New Holland | 5,743 | 233 | 4.06% |
| 95 | Baldwin | 21,159 | 857 | 4.05% |
| 96 | Conshohocken | 9,235 | 370 | 4.01% |
| 97 | Bristol | 9,874 | 392 | 3.97% |
| 98 | Kennett Square | 6,096 | 241 | 3.95% |
| 99 | Millersville | 8,711 | 329 | 3.78% |
| 100 | Pottsville | 13,374 | 495 | 3.7% |