
Most African American cities in Tennessee research summary. We used Saturday Night Science to analyze Tennessee’s most recent Census data to determine the blackest cities in Tennessee based on the percentage of Black residents. Here are the results of our analysis:
-
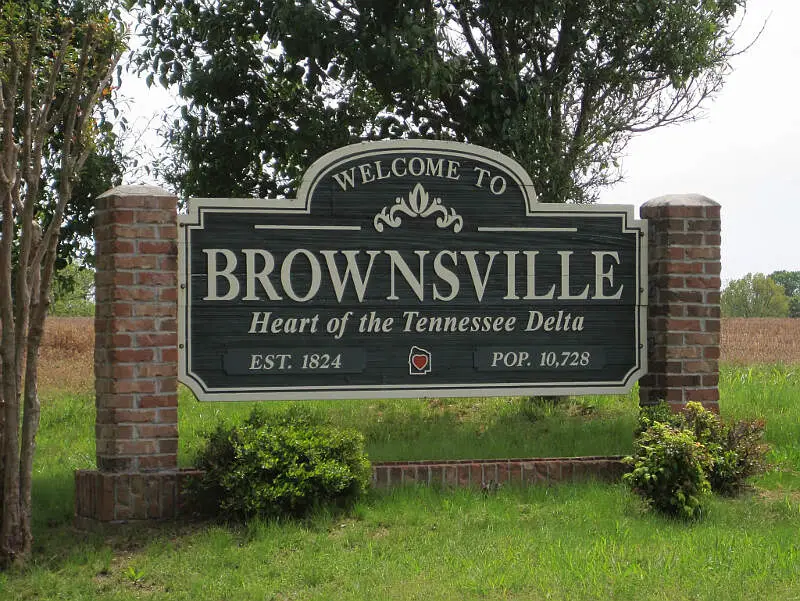
The city with the largest African American population in Tennessee is Brownsville based on the most recent Census data.
-
Brownsville is 69.27% Black.
-
The least African American city in Tennessee is Mount Carmel.
-
Mount Carmel is 0.0% Black.
-
Tennessee is 15.7% Black.
-
Tennessee is the 10th blackest state in the United States.
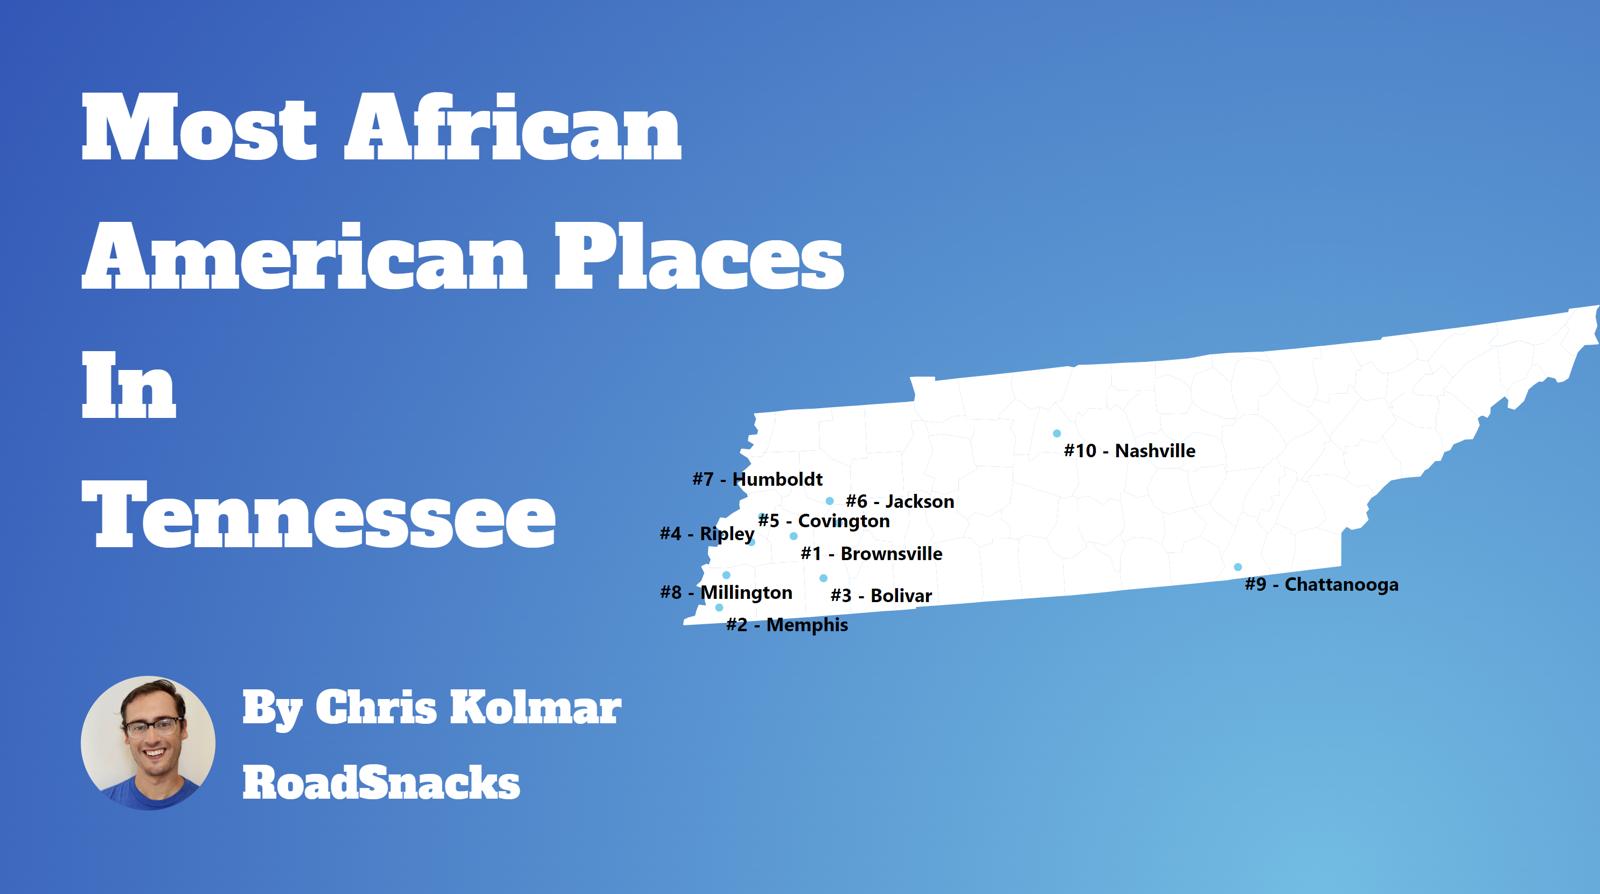
Table Of Contents: Top Ten | Methodology | Summary | Table
The Black community is one of the fastest-growing communities in America this decade.
Roughly 42 million people identifying as Black or African American live in the United States, making up 12% of the total population. According to the most recent American Community Survey, the Black population in Tennessee is 1,099,942 – at 15.7% of the total population of Tennessee.
The percentage growth of Blacks in America is the third largest percentage change for any race according to the Census’s race and ethnicity definition. Most scholars and historians agree that increasing diversity in America is a good thing.
We agree.
But how has the increase in the black population impacted Tennessee? Which cities and towns in Tennessee have seen the greatest increase in its Black population?
We broke down the most recent census data to determine the cities in Tennessee with the largest African American population in 2025:
Most African American Places In Tennessee
What’s the blackest city in Tennessee? The city with the largest Black population in Tennessee for 2025 is Brownsville. See if Brownsville ranked as one of the most african american places in America.
And if you already knew these places were Black, check out the best places to live in Tennessee or the most diverse places in Tennessee.
The 10 Blackest Cities In Tennessee For 2025
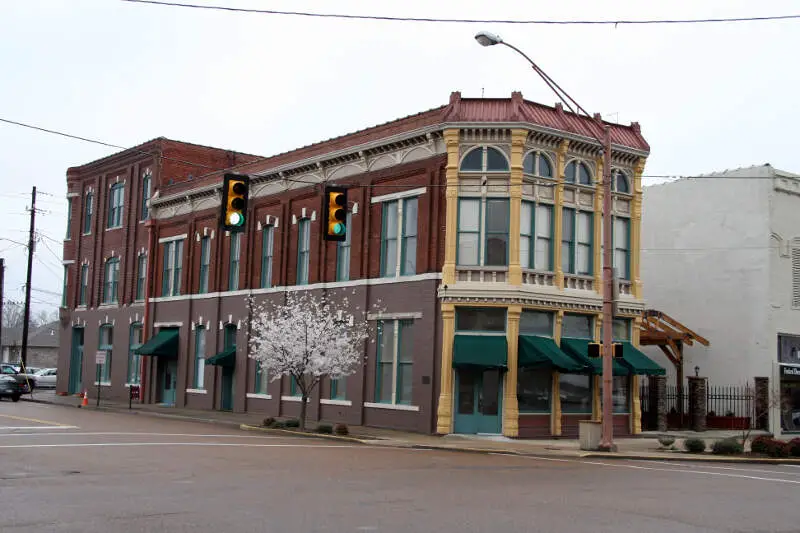
1. Brownsville
/10
Population: 9,634
% African American: 69.27%
# Of African American Residents: 6,673
Percent Change Since 2010: -3.56%
More on Brownsville: Data
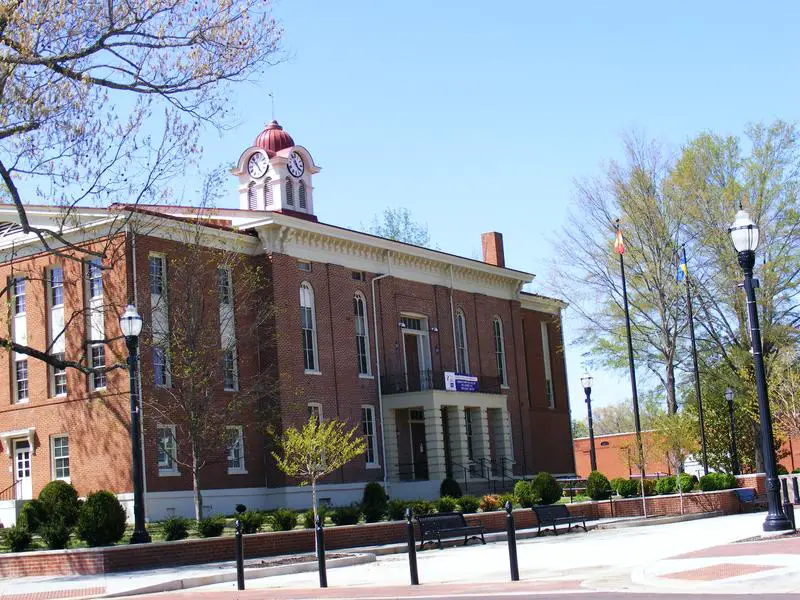
2. Bolivar
/10
Population: 5,171
% African American: 66.85%
# Of African American Residents: 3,457
Percent Change Since 2010: 2.61%
More on Bolivar: Data
3. Memphis

/10
Population: 629,063
% African American: 62.68%
# Of African American Residents: 394,321
Percent Change Since 2010: -3.47%
More on Memphis: Data
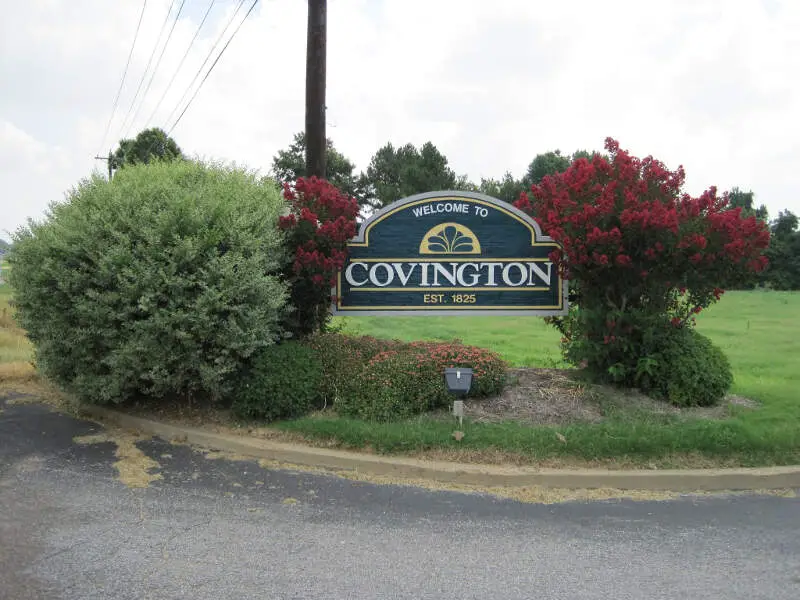
4. Covington
/10
Population: 8,612
% African American: 58.63%
# Of African American Residents: 5,049
Percent Change Since 2010: -2.34%
More on Covington: Data
5. Ripley
/10
Population: 7,718
% African American: 54.86%
# Of African American Residents: 4,234
Percent Change Since 2010: -2.93%
More on Ripley: Data
6. Jackson
/10
Population: 68,098
% African American: 44.44%
# Of African American Residents: 30,261
Percent Change Since 2010: 3.57%
More on Jackson: Data
7. Humboldt
/10
Population: 7,799
% African American: 37.2%
# Of African American Residents: 2,901
Percent Change Since 2010: -30.51%
More on Humboldt: Data
8. Millington
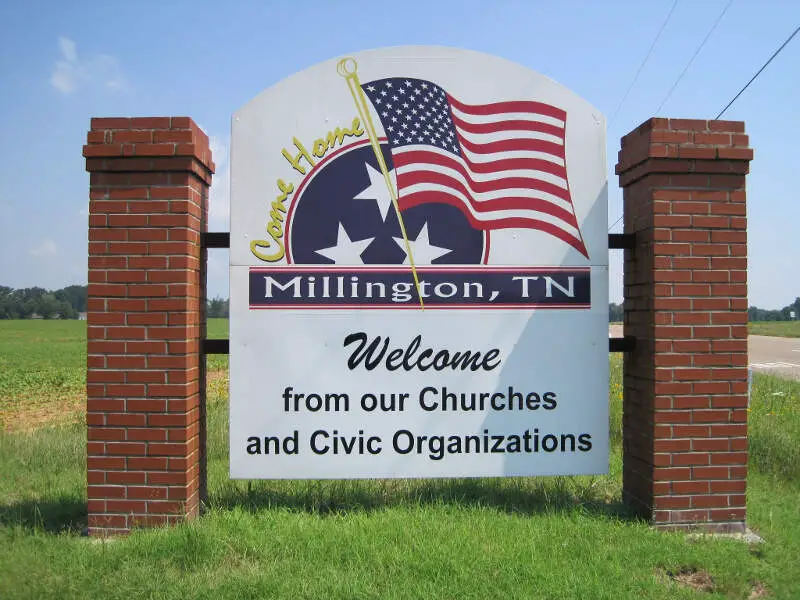
/10
Population: 11,117
% African American: 32.2%
# Of African American Residents: 3,580
Percent Change Since 2010: 30.75%
More on Millington: Data
9. Chattanooga
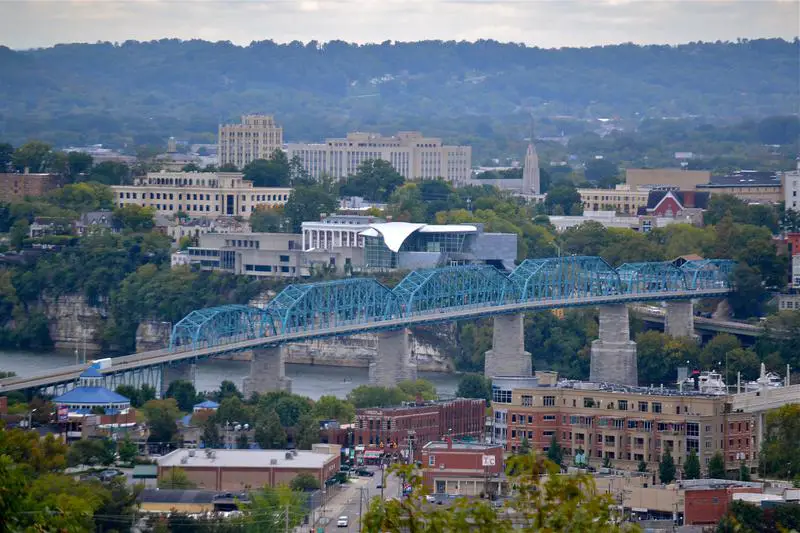
/10
Population: 182,832
% African American: 28.37%
# Of African American Residents: 51,870
Percent Change Since 2010: -8.4%
More on Chattanooga: Data
10. Dyersburg
/10
Population: 16,075
% African American: 27.67%
# Of African American Residents: 4,448
Percent Change Since 2010: -7.35%
More on Dyersburg: Data
Methodology: How We Determined The Cities In Tennessee With The Largest Black Population For 2025
We still believe in the accuracy of data — especially from the Census. So that’s where we went to get the race breakdown across Tennessee.
That leads us to the Census’s most recently available data, the 2019-2023 American Community Survey data from the US Census.
Specifically, we looked at table B03002: Hispanic OR LATINO ORIGIN BY RACE. Here are the category names as defined by the Census:
- Hispanic or Latino
- White alone*
- Black or African American alone*
- American Indian and Alaska Native alone*
- Asian alone*
- Native Hawaiian and Other Pacific Islander alone*
- Some other race alone*
- Two or more races*
Our particular column of interest was the number of people who identified as Black or African American.
We limited our analysis to non-CDPs with a population greater than 5,000 people in Tennessee. That left us with 92 cities.
We then calculated the percentage of residents that are Black or African American. The percentages ranked from 69.3% to 0.0%.
Finally, we ranked each city based on the percentage of the Black population, with a higher score being more Black than a lower score. Brownsville took the distinction of being the most Black, while Mount Carmel was the least African American city.
We updated this article for 2025. This is our tenth time ranking the cities in Tennessee with the largest African American population.
Read on for more information on how the cities in Tennessee ranked by population of African American residents or, for a more general take on diversity in America, head over to our ranking of the most diverse cities in America.
Summary: Black Populations Across Tennessee
If you’re looking for a breakdown of African American populations across Tennessee according to the most recent data, this is an accurate list.
The blackest cities in Tennessee are Brownsville, Bolivar, Memphis, Covington, Ripley, Jackson, Humboldt, Millington, Chattanooga, and Dyersburg.
If you’re curious enough, here are the least African American places in Tennessee:
- Mount Carmel
- Church Hill
- La Follette
For more Tennessee reading, check out:
- Worst Places To Live In Tennessee
- Cheapest Places To Live In Tennessee
- Most Dangerous Cities In Tennessee
African American Population By City In Tennessee
| Rank | City | Population | African American Population | % African American |
|---|---|---|---|---|
| 1 | Brownsville | 9,634 | 6,673 | 69.27% |
| 2 | Bolivar | 5,171 | 3,457 | 66.85% |
| 3 | Memphis | 629,063 | 394,321 | 62.68% |
| 4 | Covington | 8,612 | 5,049 | 58.63% |
| 5 | Ripley | 7,718 | 4,234 | 54.86% |
| 6 | Jackson | 68,098 | 30,261 | 44.44% |
| 7 | Humboldt | 7,799 | 2,901 | 37.2% |
| 8 | Millington | 11,117 | 3,580 | 32.2% |
| 9 | Chattanooga | 182,832 | 51,870 | 28.37% |
| 10 | Dyersburg | 16,075 | 4,448 | 27.67% |
| 11 | La Vergne | 38,944 | 10,428 | 26.78% |
| 12 | Milan | 8,194 | 2,150 | 26.24% |
| 13 | Goodlettsville | 17,598 | 4,559 | 25.91% |
| 14 | Oakland | 9,544 | 2,260 | 23.68% |
| 15 | Clarksville | 171,897 | 38,590 | 22.45% |
| 16 | Bartlett | 56,998 | 12,701 | 22.28% |
| 17 | Union City | 11,040 | 2,429 | 22.0% |
| 18 | Henderson | 6,349 | 1,394 | 21.96% |
| 19 | Springfield | 18,985 | 3,875 | 20.41% |
| 20 | Pulaski | 8,305 | 1,588 | 19.12% |
| 21 | Fayetteville | 7,037 | 1,303 | 18.52% |
| 22 | Paris | 10,313 | 1,876 | 18.19% |
| 23 | Martin | 10,864 | 1,898 | 17.47% |
| 24 | Murfreesboro | 157,547 | 26,685 | 16.94% |
| 25 | Mckenzie | 5,706 | 936 | 16.4% |
| 26 | Smyrna | 55,066 | 9,020 | 16.38% |
| 27 | Gallatin | 46,667 | 7,470 | 16.01% |
| 28 | Columbia | 43,971 | 6,860 | 15.6% |
| 29 | Knoxville | 193,721 | 29,987 | 15.48% |
| 30 | Lexington | 7,943 | 1,171 | 14.74% |
| 31 | Arlington | 14,989 | 1,779 | 11.87% |
| 32 | Lakeland | 14,068 | 1,664 | 11.83% |
| 33 | Shelbyville | 24,125 | 2,827 | 11.72% |
| 34 | Alcoa | 11,635 | 1,363 | 11.71% |
| 35 | East Ridge | 22,034 | 2,551 | 11.58% |
| 36 | Hartsville/trousdale County | 11,805 | 1,330 | 11.27% |
| 37 | Collegedale | 11,185 | 1,241 | 11.1% |
| 38 | Atoka | 10,237 | 1,126 | 11.0% |
| 39 | Collierville | 51,212 | 5,570 | 10.88% |
| 40 | Lebanon | 41,951 | 4,528 | 10.79% |
| 41 | Winchester | 9,600 | 1,027 | 10.7% |
| 42 | Harriman | 6,021 | 526 | 8.74% |
| 43 | Hendersonville | 62,390 | 5,232 | 8.39% |
| 44 | Millersville | 5,885 | 480 | 8.16% |
| 45 | Lewisburg | 12,607 | 1,026 | 8.14% |
| 46 | Savannah | 7,219 | 565 | 7.83% |
| 47 | Mount Juliet | 40,828 | 3,139 | 7.69% |
| 48 | Dickson | 16,246 | 1,234 | 7.6% |
| 49 | Cleveland | 48,185 | 3,643 | 7.56% |
| 50 | Red Bank | 11,960 | 831 | 6.95% |
| 51 | Tullahoma | 20,672 | 1,308 | 6.33% |
| 52 | Johnson City | 71,455 | 4,476 | 6.26% |
| 53 | Manchester | 12,651 | 792 | 6.26% |
| 54 | Oak Ridge | 32,088 | 1,970 | 6.14% |
| 55 | Athens | 14,250 | 863 | 6.06% |
| 56 | Franklin | 85,575 | 4,935 | 5.77% |
| 57 | Morristown | 30,983 | 1,526 | 4.93% |
| 58 | Spring Hill | 53,585 | 2,583 | 4.82% |
| 59 | Lawrenceburg | 11,732 | 553 | 4.71% |
| 60 | Sweetwater | 6,462 | 295 | 4.57% |
| 61 | Elizabethton | 14,364 | 617 | 4.3% |
| 62 | Brentwood | 45,272 | 1,866 | 4.12% |
| 63 | Germantown | 40,812 | 1,678 | 4.11% |
| 64 | Mcminnville | 13,765 | 541 | 3.93% |
| 65 | Kingston | 6,042 | 216 | 3.57% |
| 66 | Cookeville | 35,544 | 1,270 | 3.57% |
| 67 | Munford | 6,459 | 226 | 3.5% |
| 68 | Portland | 13,325 | 462 | 3.47% |
| 69 | Jefferson City | 8,472 | 277 | 3.27% |
| 70 | Kingsport | 55,807 | 1,822 | 3.26% |
| 71 | Dayton | 7,191 | 216 | 3.0% |
| 72 | Crossville | 12,265 | 353 | 2.88% |
| 73 | Maryville | 32,196 | 900 | 2.8% |
| 74 | Bristol | 27,490 | 720 | 2.62% |
| 75 | White House | 13,875 | 355 | 2.56% |
| 76 | Greeneville | 15,531 | 386 | 2.49% |
| 77 | Nolensville | 14,545 | 360 | 2.48% |
| 78 | Pigeon Forge | 6,345 | 128 | 2.02% |
| 79 | Clinton | 10,141 | 186 | 1.83% |
| 80 | Sevierville | 18,105 | 255 | 1.41% |
| 81 | Fairview | 9,751 | 122 | 1.25% |
| 82 | Newport | 6,881 | 86 | 1.25% |
| 83 | Rockwood | 5,510 | 59 | 1.07% |
| 84 | Lenoir City | 10,681 | 109 | 1.02% |
| 85 | Farragut | 24,309 | 221 | 0.91% |
| 86 | Soddy-Daisy | 13,117 | 91 | 0.69% |
| 87 | Greenbrier | 6,960 | 41 | 0.59% |
| 88 | Erwin | 6,001 | 34 | 0.57% |
| 89 | Signal Mountain | 8,861 | 46 | 0.52% |
| 90 | La Follette | 7,308 | 14 | 0.19% |
| 91 | Church Hill | 7,057 | 12 | 0.17% |
| 92 | Mount Carmel | 5,504 | 0 | 0.0% |
Which Tennesse cities have issues of racism? Amongst, neighbours, people and in schools. I am from South Africa, born and raised, and I am black. I love everything I read up about the southern way of life. I have watched a lot of movies about the southern way of life, and I am even considering applying to a university in Tennesse. I would like to know if there are any racial issues for black people in Tennesse, or will there be peace amongst all races?
I think Nashville is the best place to live in Tennessee.
Hi Mr. Khumalo,
Tennessee has become much more diversified throughout the years. The chances of you finding yourself in the face a racial bigotry is very small, but possible. Tennessee is full of God loving wonderful people. As long as you arrive hear with a good attitude, open heart and a good smile you will be successful in all that you do.
Please feel free to reach out to me anytime.
Email: [email protected]
~ God bless