
Like all states, California has certain places that are going on hard times. These California places have an above-average percentage of people living in poverty, out of work, or not making as much as they should be.
Even as the economy continues to improve, it’s worthwhile to look at the places in each state struggling to make ends meet. So we set our sites on locating the poorest places in California.
To do so, we used Saturday Night Science to analyze the newest Census data from the American Community Survey for the 428 cities in California with more than 5,000 people.
Table Of Contents: Top Ten | Methodology | Summary | Table
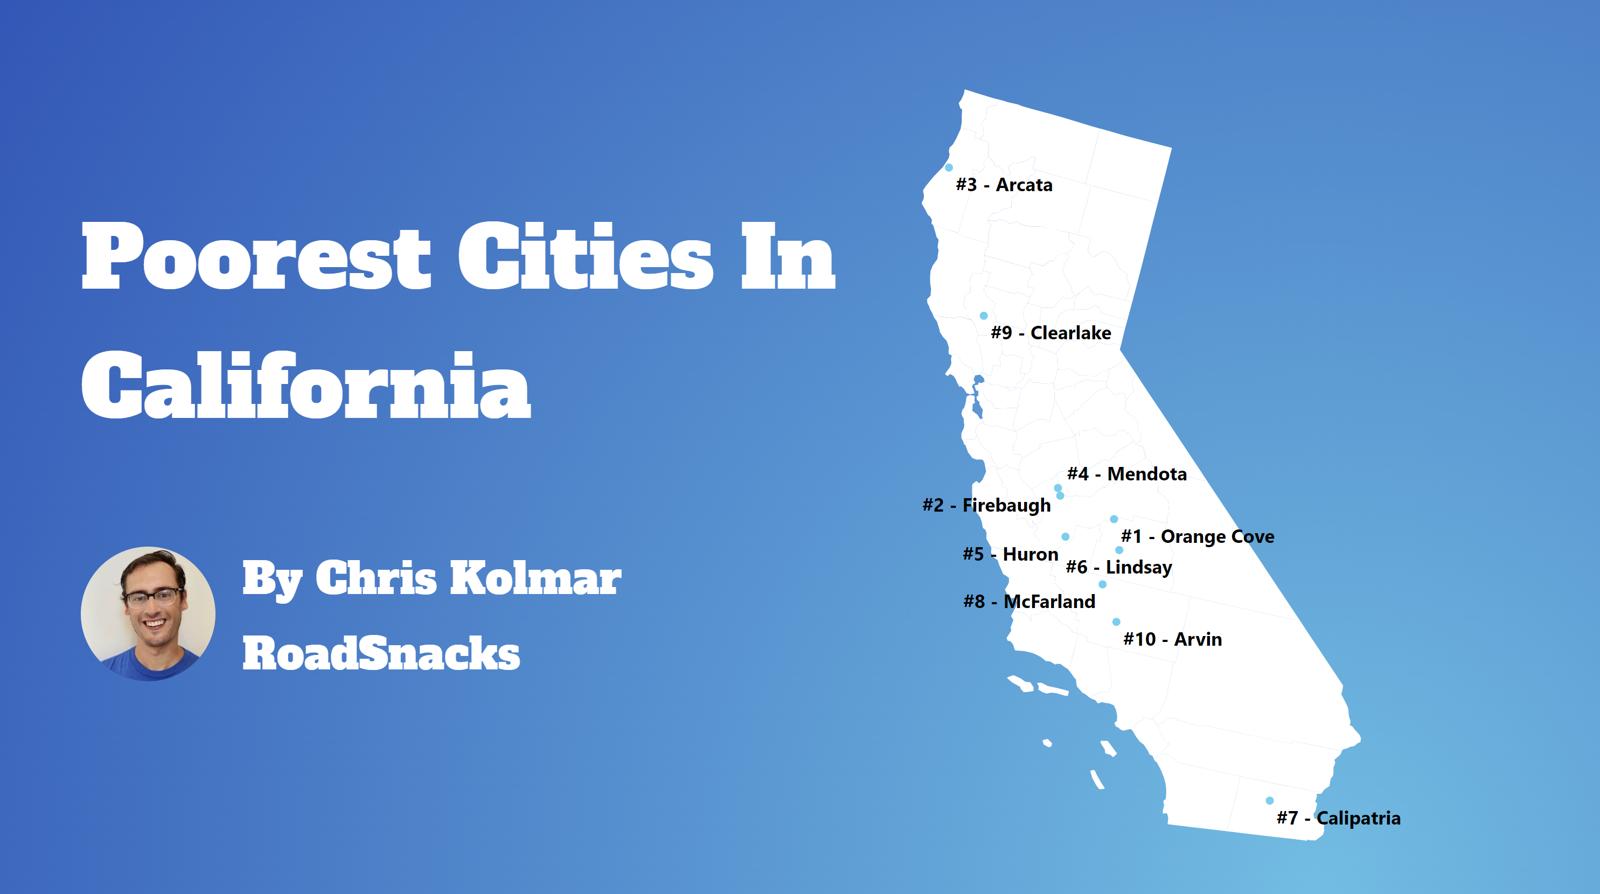
What’s the poorest city in California? According to the facts, Orange Cove is the poorest place in California for 2026.
This isn’t a commentary on the people that live there or the vibrant culture and traditions of these places. Instead, it’s just a look at the facts.
For more California reading, check out:
- Best Places To Live In California
- Cheapest Places To Live In California
- Most Dangerous Cities In California
- The poorest states in the US
- The poorest cities in the US
The 10 Poorest Cities In California For 2026
1. Orange Cove
/10
Population: 9,695
Rank Last Year: 1 (No Change)
Median Income: $46,629 (6th lowest)
Poverty Rate: 34.0% (3rd highest)
People In Poverty: 3,296
More on Orange Cove: Data | Crime | Cost Of Living | Movers
Orange Cove, unfortunately, ranks as the poorest place in California thanks to combination of low pay and and a lack of jobs.
The city of 9,695 people averages the 6th lowest median household income in California and the 3rd highest poverty rate. At the very least, the cost of living ranks in the bottom 15% of place in the state, so things like housing are relatively affordable.
2. Firebaugh

/10
Population: 8,392
Rank Last Year: 3 (Up 1)
Median Income: $47,734 (9th lowest)
Poverty Rate: 36.6% (highest)
People In Poverty: 3,069
More on Firebaugh: Data | Crime | Cost Of Living | Movers
The second poorest city in California is Firebaugh.
The city ranks as having the highest incidence of poverty and 9th lowest median household income. However, the unemployment rate ‘only’ ranks as the 3rd highest in the Golden State.
3. Arvin
/10
Population: 19,539
Rank Last Year: 5 (Up 2)
Median Income: $49,183 (10th lowest)
Poverty Rate: 34.6% (2nd highest)
People In Poverty: 6,766
More on Arvin: Data | Crime | Cost Of Living | Movers
Placing as the third poorest city, Arvin’s median income ranks as the 10th lowest.
And that’s a sign that there’s a relatively substantial jump in the quality of the economy from second to third place on our list. The poverty rate is 34.63% and ranks near the bottom of places in the state.
But what makes up for the relatively low incomes of the city is its low cost of living. The income you do make here goes further than in most parts of the Golden State.
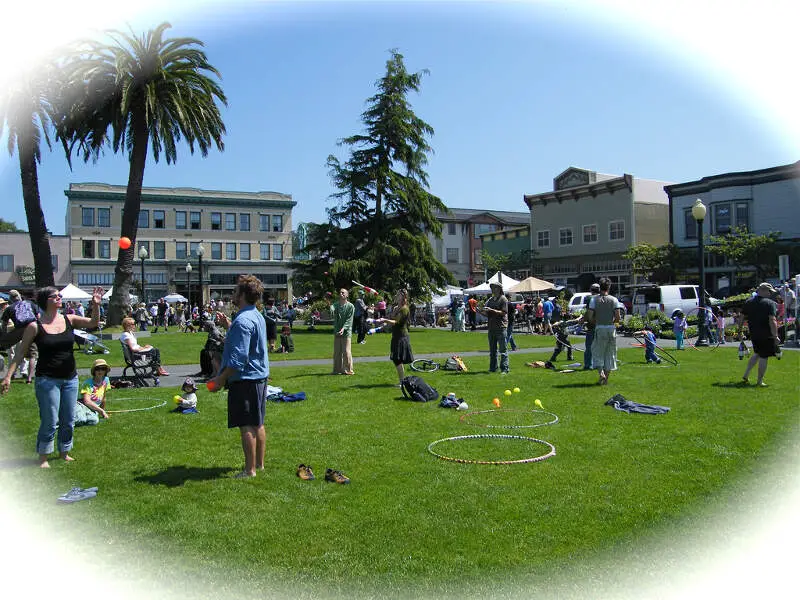
4. Arcata
/10
Population: 18,607
Rank Last Year: 6 (Up 2)
Median Income: $46,713 (7th lowest)
Poverty Rate: 27.2% (10th highest)
People In Poverty: 5,061
More on Arcata: Data | Crime | Cost Of Living | Movers
Arcata ranks as the fourth poorest place in California.
The town ranks as having the 7th lowest median household income and the 10th highest incidence of poverty in the state.
That being said, there’s still a ton of cultural diversity in the city as it hosts many events throughout the year.
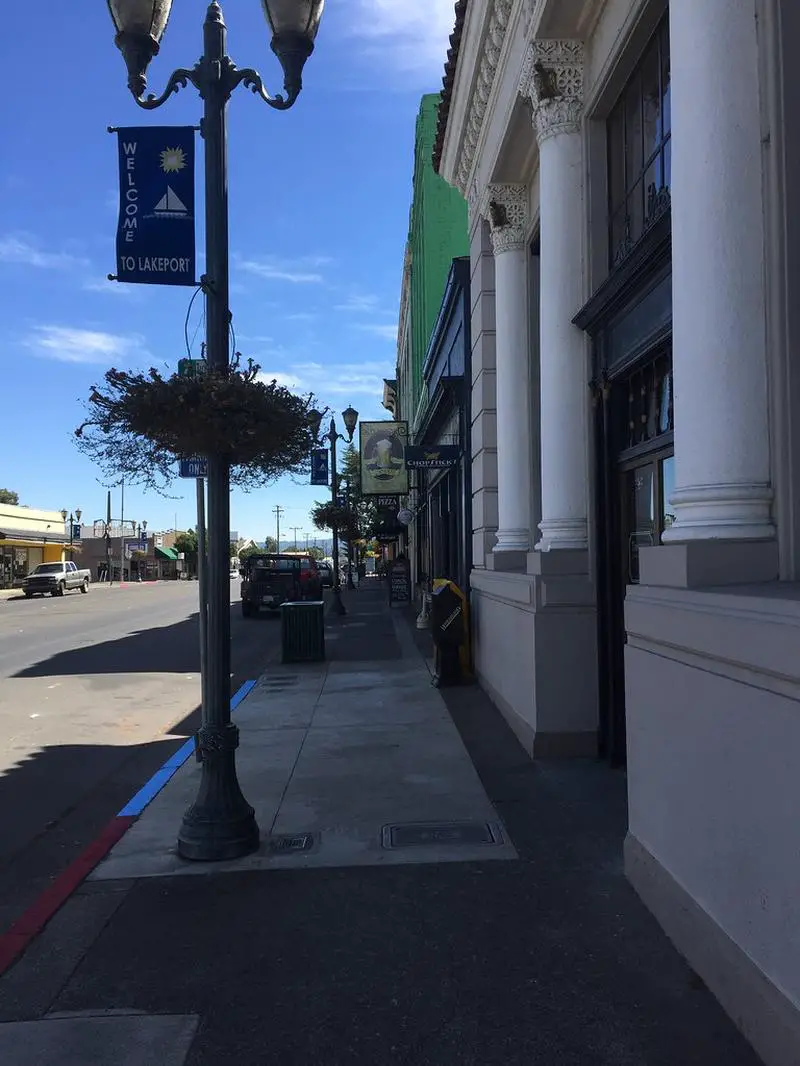
5. Clearlake
/10
Population: 16,659
Rank Last Year: 7 (Up 2)
Median Income: $41,867 (2nd lowest)
Poverty Rate: 25.5% (16th highest)
People In Poverty: 4,246
More on Clearlake: Data | Crime | Cost Of Living | Movers
The fifth poorest city in California is Clearlake.
The city ranks as having the 2nd lowest median income in the state. However, an extremely low cost of living prevents a good number of folks from living in poverty as the poverty rate only ranks as the 16th highest in California.
Still not the best news for Clearlake.
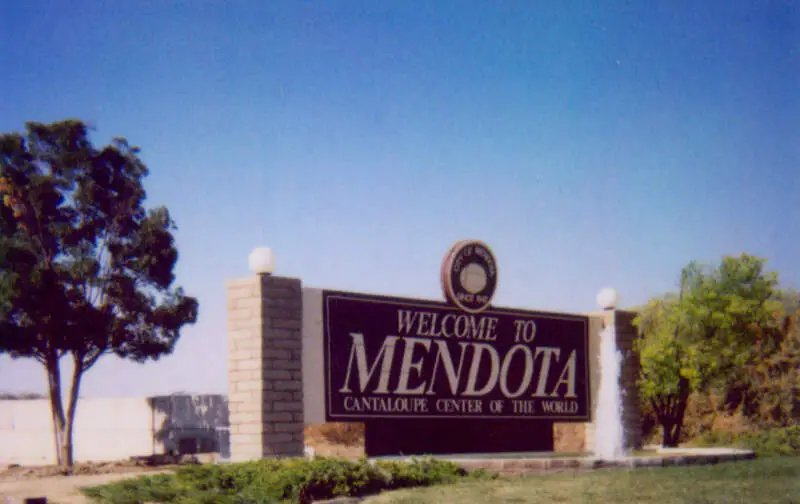
6. Mendota
/10
Population: 12,577
Rank Last Year: 4 (Down 2)
Median Income: $50,342 (12th lowest)
Poverty Rate: 27.5% (9th highest)
People In Poverty: 3,461
More on Mendota: Data | Crime | Cost Of Living | Movers
Mendota ranks as the sixth poorest place in the Golden State.
It ranks as having the 9th highest incidence of poverty and the 24th highest unemployment rate.
7. Woodlake
/10
Population: 7,702
Rank Last Year: 14 (Up 7)
Median Income: $46,266 (5th lowest)
Poverty Rate: 25.3% (17th highest)
People In Poverty: 1,950
More on Woodlake: Data | Crime | Cost Of Living | Movers
Woodlake places as the seventh poorest city in California.
The city of over 7,702 ranks as having the 17th highest incidence of poverty in the state. However, it has a very low cost of living which helps to pay the bills each month.
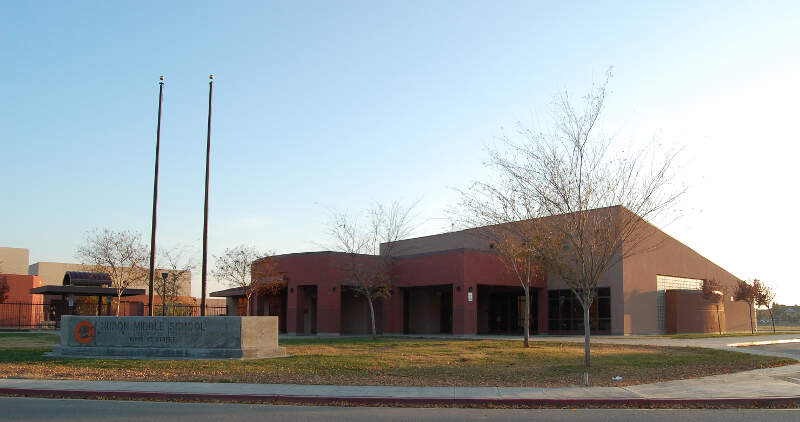
8. Huron
/10
Population: 6,519
Rank Last Year: 2 (Down 6)
Median Income: $52,500 (18th lowest)
Poverty Rate: 30.4% (5th highest)
People In Poverty: 1,983
More on Huron: Data | Crime | Cost Of Living | Movers
Huron ranks as the eighth poorest city in California.
The big issue for the town is the unemployment rate which ranks as one of the highest in the state.
9. Lindsay
/10
Population: 12,643
Rank Last Year: 9 (No Change)
Median Income: $53,201 (2lowest)
Poverty Rate: 33.1% (4th highest)
People In Poverty: 4,183
More on Lindsay: Data | Crime | Cost Of Living | Movers
Lindsay couldn’t stay out of the top ten poorest places in California; it ranks number 9.
While the median income is the 2lowest, there are a substantial number of people that live below the poverty line. Overall, Lindsay ranks as having the 4th most people living in poverty of all the places we analyzed in California.
10. Parlier

/10
Population: 14,507
Rank Last Year: 8 (Down 2)
Median Income: $52,357 (17th lowest)
Poverty Rate: 27.1% (11th highest)
People In Poverty: 3,935
More on Parlier: Data | Crime | Cost Of Living | Movers
And rounding out the top ten poorest cities in California is Parlier.
The city of 14,507 people ranks in the bottom 20% for both median income and poverty rate in the Golden State.
Methodology: How We Determined The Poorest Places In California for 2026
The first thing that comes to most people’s minds when they think about determining the poorest places is to simply the poverty rate. That is, the number of people living below a federally established level of income for a household of a certain size.
However, we don’t think that one statistic wholly encompasses what it means to be one of the “poorest places”. So we used Saturday Night Science to look at this set of criteria from the newly released 2020-2024 American Community Survey:
- Poverty Level
- Median Household Income
After we collected the data for all 428 places with more than 5,000 people in California, we ranked each place from 1 to 428 for each of the criteria, with 1 being the poorest.
We then averaged all the rankings for a place into a “Poor Score” with the place having the lowest overall Poor Score, Orange Cove, crowned the “Poorest Place In California For 2026”.
This report has been updated for 2026, which is our eleventh time ranking the poorest places in California.
Summary: The Poorest Cities In California For 2026
Like we said earlier, when we set out to identify the poorest places in California, we weren’t sure what we’d encounter, but it ended up being some of the best places to live in California.
When you look at the data, the cities and places mentioned above meet the criteria for being at the very bottom of the income ladder for everyone that lives there.
If you’re curious enough, here are the richest cities in California, according to data:
-
Richest: Orinda
2nd Richest: Los Altos
3rd Richest: Saratoga
For more California reading, check out:
- Richest Cities In California
- Safest Places In California
- Worst Places To Live In California
- Most Expensive Places To Live In California
Detailed List Of The Poorest Places To Live In California
| Rank | City | Population | Poverty Rate | Median Income | People In Poverty |
|---|---|---|---|---|---|
| 1 | Orange Cove | 9,695 | 34.0% | $46,629 | 3,296 |
| 2 | Firebaugh | 8,392 | 36.6% | $47,734 | 3,069 |
| 3 | Arvin | 19,539 | 34.6% | $49,183 | 6,766 |
| 4 | Arcata | 18,607 | 27.2% | $46,713 | 5,061 |
| 5 | Clearlake | 16,659 | 25.5% | $41,867 | 4,246 |
| 6 | Mendota | 12,577 | 27.5% | $50,342 | 3,461 |
| 7 | Woodlake | 7,702 | 25.3% | $46,266 | 1,950 |
| 8 | Huron | 6,519 | 30.4% | $52,500 | 1,983 |
| 9 | Lindsay | 12,643 | 33.1% | $53,201 | 4,183 |
| 10 | Parlier | 14,507 | 27.1% | $52,357 | 3,935 |
| 11 | Cudahy | 22,087 | 28.7% | $56,615 | 6,338 |
| 12 | Calipatria | 6,548 | 25.6% | $53,299 | 1,673 |
| 13 | Anderson | 11,255 | 21.2% | $47,375 | 2,383 |
| 14 | Grass Valley | 14,113 | 22.1% | $51,764 | 3,120 |
| 15 | McFarland | 14,222 | 24.1% | $54,608 | 3,421 |
| 16 | Barstow | 25,100 | 23.1% | $53,380 | 5,790 |
| 17 | Marysville | 12,726 | 24.5% | $56,430 | 3,120 |
| 18 | Oroville | 19,752 | 21.4% | $52,270 | 4,222 |
| 19 | Dinuba | 25,475 | 26.8% | $59,484 | 6,834 |
| 20 | El Centro | 44,240 | 21.6% | $53,082 | 9,551 |
| 21 | Calexico | 38,585 | 19.7% | $49,783 | 7,616 |
| 22 | Red Bluff | 14,549 | 18.8% | $51,529 | 2,727 |
| 23 | California City | 14,414 | 22.8% | $60,113 | 3,289 |
| 24 | Brawley | 27,283 | 21.3% | $59,311 | 5,822 |
| 25 | Farmersville | 10,397 | 22.9% | $60,804 | 2,380 |
| 26 | Wasco | 26,558 | 18.4% | $51,727 | 4,881 |
| 27 | Madera | 67,831 | 25.6% | $63,933 | 17,351 |
| 28 | Kerman | 16,815 | 21.3% | $59,799 | 3,583 |
| 29 | Avenal | 13,608 | 19.1% | $54,741 | 2,605 |
| 30 | Guadalupe | 8,566 | 27.7% | $66,930 | 2,372 |
| 31 | Merced | 91,953 | 23.9% | $63,122 | 21,949 |
| 32 | Dos Palos | 5,765 | 17.6% | $42,367 | 1,012 |
| 33 | Bell | 32,476 | 21.6% | $61,020 | 7,027 |
| 34 | Corcoran | 22,491 | 20.7% | $59,905 | 4,651 |
| 35 | Blythe | 17,396 | 18.9% | $56,625 | 3,294 |
| 36 | Reedley | 25,609 | 22.3% | $63,307 | 5,713 |
| 37 | Crescent City | 6,046 | 17.2% | $35,540 | 1,038 |
| 38 | Desert Hot Springs | 33,200 | 18.0% | $52,761 | 5,969 |
| 39 | Fort Bragg | 7,032 | 18.2% | $56,481 | 1,279 |
| 40 | King City | 13,604 | 22.9% | $66,761 | 3,122 |
| 41 | Yreka | 7,820 | 17.0% | $43,982 | 1,330 |
| 42 | Chico | 102,188 | 22.7% | $66,977 | 23,186 |
| 43 | Maywood | 24,317 | 19.4% | $60,943 | 4,712 |
| 44 | Eureka | 26,010 | 18.1% | $57,662 | 4,707 |
| 45 | Selma | 24,659 | 19.0% | $60,241 | 4,692 |
| 46 | Atwater | 32,162 | 20.9% | $64,472 | 6,737 |
| 47 | Bell Gardens | 38,229 | 20.0% | $62,298 | 7,630 |
| 48 | Corning | 8,155 | 17.9% | $56,627 | 1,458 |
| 49 | Huntington Park | 53,108 | 18.3% | $59,996 | 9,729 |
| 50 | Banning | 31,093 | 18.8% | $61,764 | 5,829 |
| 51 | Gridley | 7,330 | 17.9% | $57,974 | 1,310 |
| 52 | Willows | 6,190 | 19.3% | $64,068 | 1,195 |
| 53 | San Luis Obispo | 48,491 | 30.4% | $73,685 | 14,721 |
| 54 | Chowchilla | 19,020 | 19.6% | $66,514 | 3,722 |
| 55 | Fortuna | 12,326 | 18.2% | $62,289 | 2,239 |
| 56 | El Cajon | 104,449 | 20.5% | $67,511 | 21,443 |
| 57 | Fowler | 7,094 | 19.4% | $66,983 | 1,372 |
| 58 | Holtville | 5,617 | 18.7% | $65,039 | 1,049 |
| 59 | Susanville | 14,177 | 17.6% | $61,641 | 2,497 |
| 60 | Shafter | 21,193 | 20.7% | $71,215 | 4,391 |
| 61 | Porterville | 63,157 | 17.3% | $60,461 | 10,919 |
| 62 | Fresno | 545,970 | 20.1% | $70,991 | 109,630 |
| 63 | San Bernardino | 222,724 | 18.6% | $67,415 | 41,471 |
| 64 | Ukiah | 16,304 | 17.9% | $66,160 | 2,918 |
| 65 | South El Monte | 19,287 | 20.9% | $72,990 | 4,032 |
| 66 | Paradise | 7,392 | 18.2% | $67,687 | 1,343 |
| 67 | Coalinga | 17,203 | 21.7% | $75,451 | 3,726 |
| 68 | Hemet | 91,326 | 14.9% | $57,719 | 13,625 |
| 69 | Yucca Valley | 21,770 | 15.7% | $59,563 | 3,413 |
| 70 | El Monte | 106,109 | 17.4% | $68,030 | 18,516 |
| 71 | Colusa | 6,505 | 18.1% | $71,250 | 1,176 |
| 72 | Orland | 8,357 | 16.9% | $64,945 | 1,411 |
| 73 | Los Banos | 47,593 | 17.4% | $68,171 | 8,257 |
| 74 | Tulare | 70,945 | 17.9% | $72,410 | 12,727 |
| 75 | Victorville | 137,627 | 18.4% | $74,410 | 25,254 |
| 76 | Laguna Woods | 17,289 | 14.2% | $59,269 | 2,448 |
| 77 | Adelanto | 37,964 | 17.2% | $68,685 | 6,544 |
| 78 | Delano | 51,679 | 16.0% | $67,010 | 8,247 |
| 79 | Lompoc | 43,646 | 17.3% | $72,004 | 7,533 |
| 80 | Lynwood | 64,578 | 18.0% | $74,844 | 11,604 |
| 81 | Placerville | 10,762 | 15.8% | $67,274 | 1,705 |
| 82 | Twentynine Palms | 27,355 | 14.5% | $62,554 | 3,961 |
| 83 | Live Oak | 9,347 | 17.4% | $73,571 | 1,622 |
| 84 | Apple Valley | 75,473 | 16.6% | $69,882 | 12,551 |
| 85 | Hesperia | 100,775 | 16.9% | $72,160 | 17,081 |
| 86 | National City | 58,893 | 14.6% | $66,841 | 8,598 |
| 87 | Taft | 7,125 | 16.9% | $72,772 | 1,203 |
| 88 | Livingston | 14,606 | 17.1% | $74,494 | 2,496 |
| 89 | Compton | 92,698 | 17.9% | $78,465 | 16,602 |
| 90 | Montclair | 37,810 | 17.7% | $77,659 | 6,688 |
| 91 | Davis | 66,978 | 26.5% | $90,045 | 17,735 |
| 92 | Highland | 56,675 | 17.1% | $77,120 | 9,697 |
| 93 | Inglewood | 104,569 | 14.6% | $72,750 | 15,308 |
| 94 | Hawaiian Gardens | 13,691 | 16.3% | $76,341 | 2,233 |
| 95 | Redding | 93,409 | 14.1% | $70,466 | 13,189 |
| 96 | Shasta Lake | 10,311 | 13.3% | $67,401 | 1,369 |
| 97 | Hawthorne | 85,191 | 15.5% | $75,848 | 13,221 |
| 98 | Colton | 53,772 | 13.7% | $71,208 | 7,366 |
| 99 | Sanger | 26,699 | 15.8% | $77,500 | 4,205 |
| 100 | Tehachapi | 11,946 | 13.9% | $72,957 | 1,665 |
Blythe is more poor than Coachella they don’t even have a place to shop for clothes. All they have is a Albertsons and RiteAid. Coachella is next to multiple other towns not even far they don’t even have to go on a Freeway just down some roads.