
Like all states, Illinois has certain places that are going on hard times. These Illinois places have an above-average percentage of people living in poverty, out of work, or not making as much as they should be.
Even as the economy continues to improve, it’s worthwhile to look at the places in each state struggling to make ends meet. So we set our sites on locating the poorest places in Illinois.
To do so, we used Saturday Night Science to analyze the newest Census data from the American Community Survey for the 330 cities in Illinois with more than 5,000 people.
Table Of Contents: Top Ten | Methodology | Summary | Table
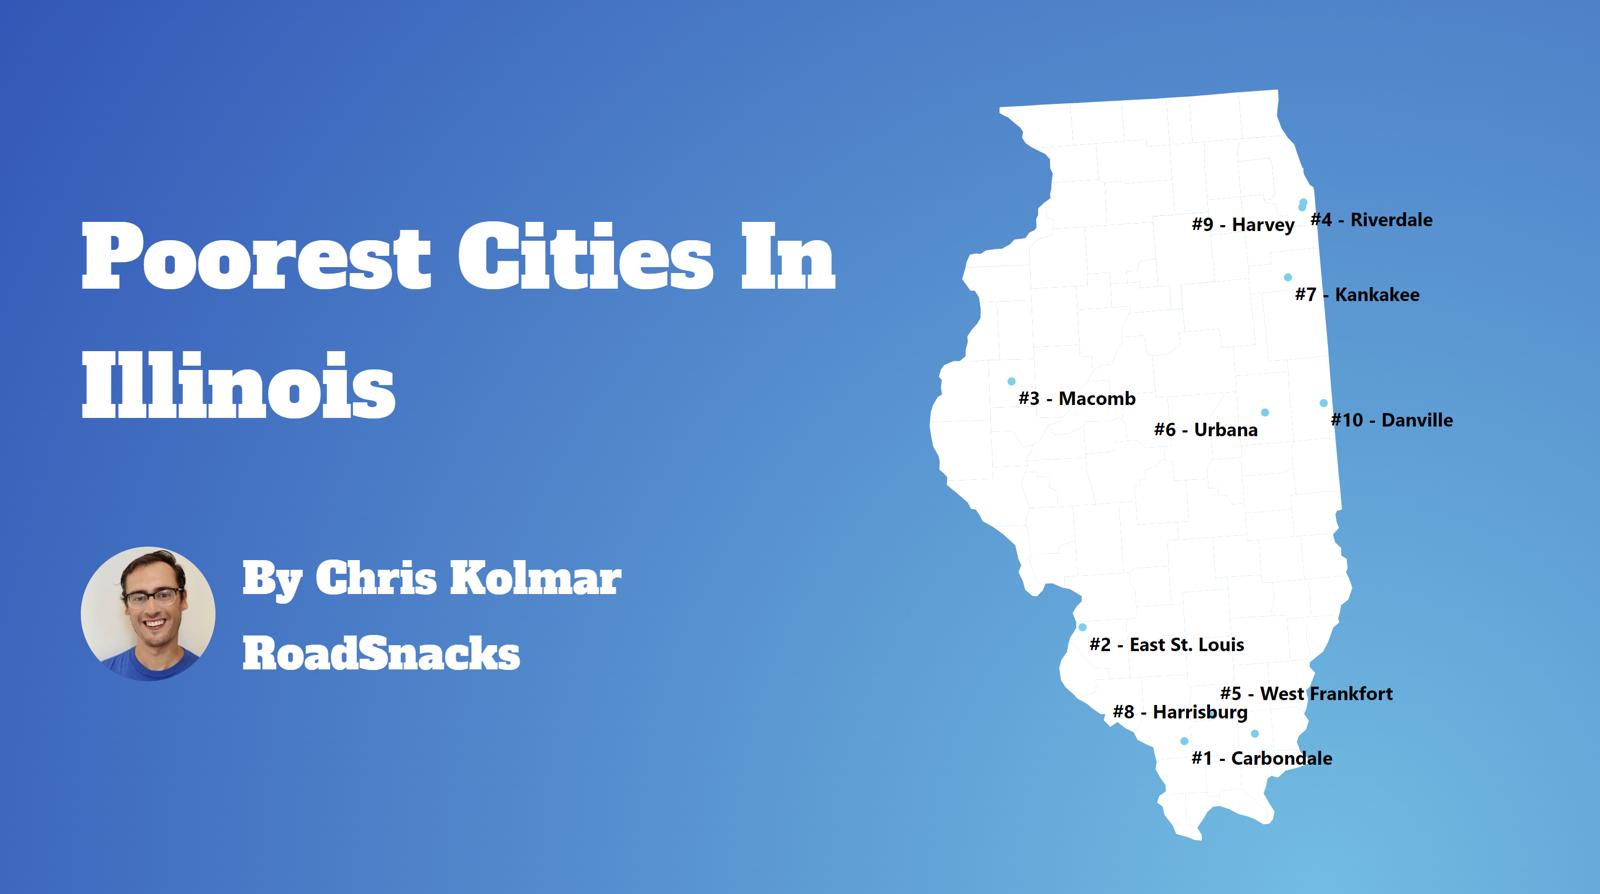
What’s the poorest city in Illinois? According to the facts, Carbondale is the poorest place in Illinois for 2025.
This isn’t a commentary on the people that live there or the vibrant culture and traditions of these places. Instead, it’s just a look at the facts.
For more Illinois reading, check out:
- Best Places To Live In Illinois
- Cheapest Places To Live In Illinois
- Most Dangerous Cities In Illinois
- The poorest states in the US
- The poorest cities in the US
The 10 Poorest Cities In Illinois For 2025
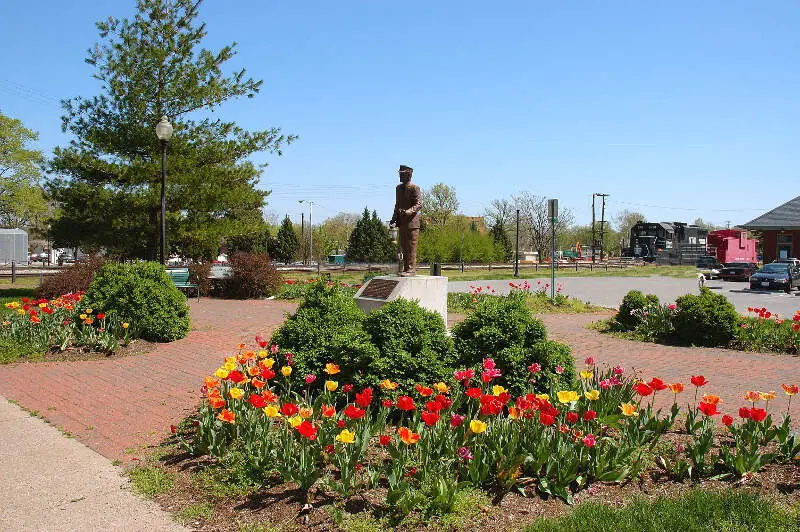
1. Carbondale
/10
Population: 21,813
Rank Last Year: 1 (No Change)
Median Income: $29,670 (lowest)
Poverty Rate: 36.9% (highest)
People In Poverty: 8,042
More on Carbondale: Data
Carbondale, unfortunately, ranks as the poorest place in Illinois thanks to combination of low pay and and a lack of jobs.
The city of 21,813 people averages the lowest median household income in Illinois and the highest poverty rate. At the very least, the cost of living ranks in the bottom 15% of place in the state, so things like housing are relatively affordable.
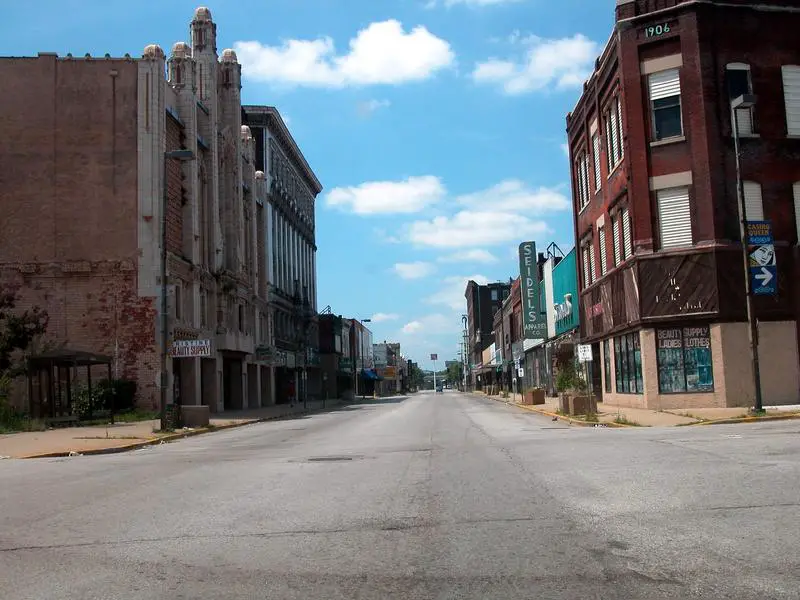
2. East St. Louis
/10
Population: 18,278
Rank Last Year: 2 (No Change)
Median Income: $30,992 (2nd lowest)
Poverty Rate: 32.9% (2nd highest)
People In Poverty: 6,004
More on East St. Louis:
The second poorest city in Illinois is East St. Louis.
The city ranks as having the 2nd highest incidence of poverty and 2nd lowest median household income. However, the unemployment rate ‘only’ ranks as the 4th highest in the Prairie State.
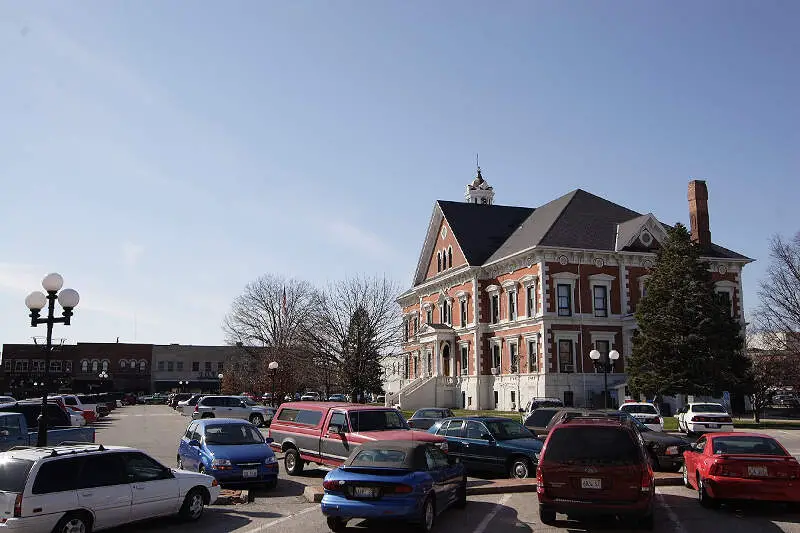
3. Macomb
/10
Population: 15,006
Rank Last Year: 3 (No Change)
Median Income: $39,753 (3rd lowest)
Poverty Rate: 29.4% (4th highest)
People In Poverty: 4,419
More on Macomb: Data
Placing as the third poorest city, Macomb’s median income ranks as the 3rd lowest.
And that’s a sign that there’s a relatively substantial jump in the quality of the economy from second to third place on our list. The poverty rate is 29.45% and ranks near the bottom of places in the state.
But what makes up for the relatively low incomes of the city is its low cost of living. The income you do make here goes further than in most parts of the Prairie State.
4. Riverdale
/10
Population: 10,515
Rank Last Year: 4 (No Change)
Median Income: $45,709 (11th lowest)
Poverty Rate: 32.3% (3rd highest)
People In Poverty: 3,393
More on Riverdale: Data
Riverdale ranks as the fourth poorest place in Illinois.
The town ranks as having the 11th lowest median household income and the 3rd highest incidence of poverty in the state.
That being said, there’s still a ton of cultural diversity in the city as it hosts many events throughout the year.
5. Harvey
/10
Population: 19,831
Rank Last Year: 8 (Up 3)
Median Income: $41,091 (4th lowest)
Poverty Rate: 25.2% (11th highest)
People In Poverty: 5,001
More on Harvey: Data
The fifth poorest city in Illinois is Harvey.
The city ranks as having the 4th lowest median income in the state. However, an extremely low cost of living prevents a good number of folks from living in poverty as the poverty rate only ranks as the 11th highest in Illinois.
Still not the best news for Harvey.
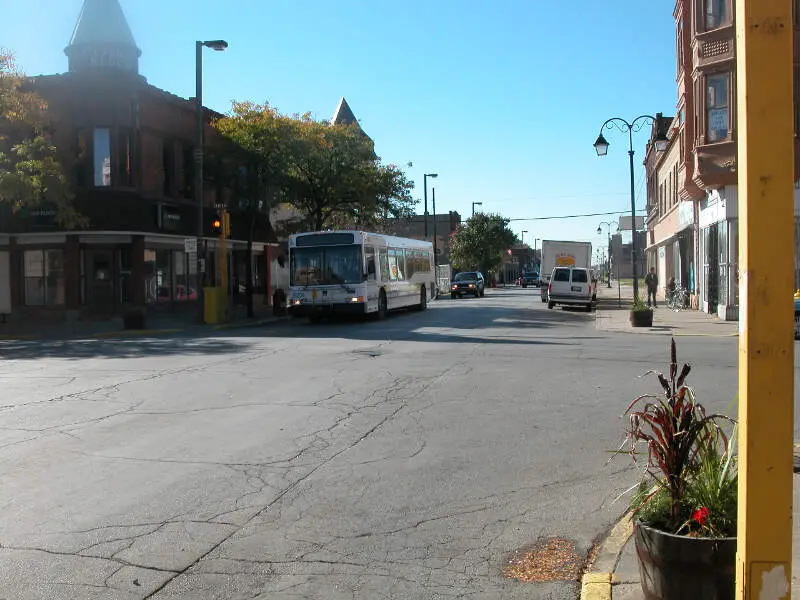
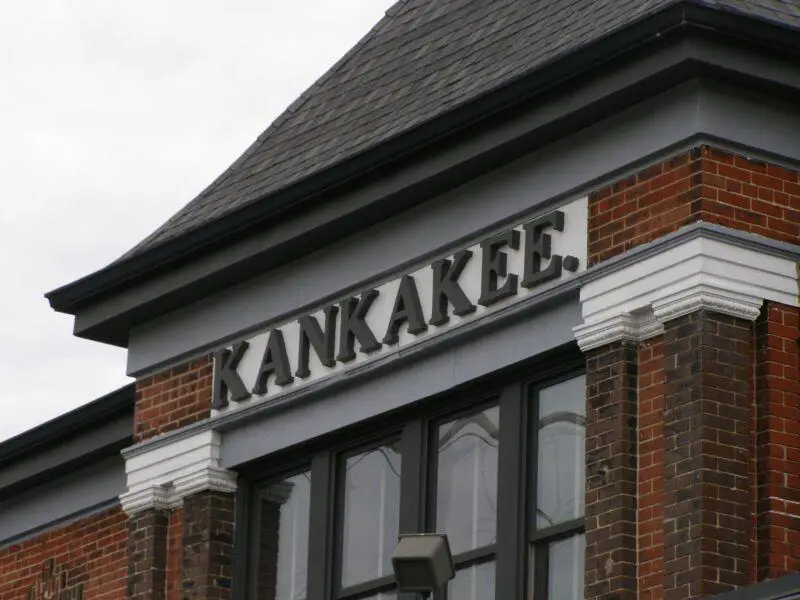
6. Kankakee
/10
Population: 24,384
Rank Last Year: 7 (Up 1)
Median Income: $45,119 (9th lowest)
Poverty Rate: 27.8% (6th highest)
People In Poverty: 6,766
More on Kankakee: Data
Kankakee ranks as the sixth poorest place in the Prairie State.
It ranks as having the 6th highest incidence of poverty and the 62nd highest unemployment rate.
7. Danville
/10
Population: 28,663
Rank Last Year: 10 (Up 3)
Median Income: $44,239 (7th lowest)
Poverty Rate: 25.1% (13th highest)
People In Poverty: 7,185
More on Danville: Data
Danville places as the seventh poorest city in Illinois.
The city of over 28,663 ranks as having the 13th highest incidence of poverty in the state. However, it has a very low cost of living which helps to pay the bills each month.
8. DeKalb
/10
Population: 40,464
Rank Last Year: 11 (Up 3)
Median Income: $46,564 (14th lowest)
Poverty Rate: 25.7% (7th highest)
People In Poverty: 10,399
More on Dekalb: Data
DeKalb ranks as the eighth poorest city in Illinois.
The big issue for the town is the unemployment rate which ranks as one of the highest in the state.
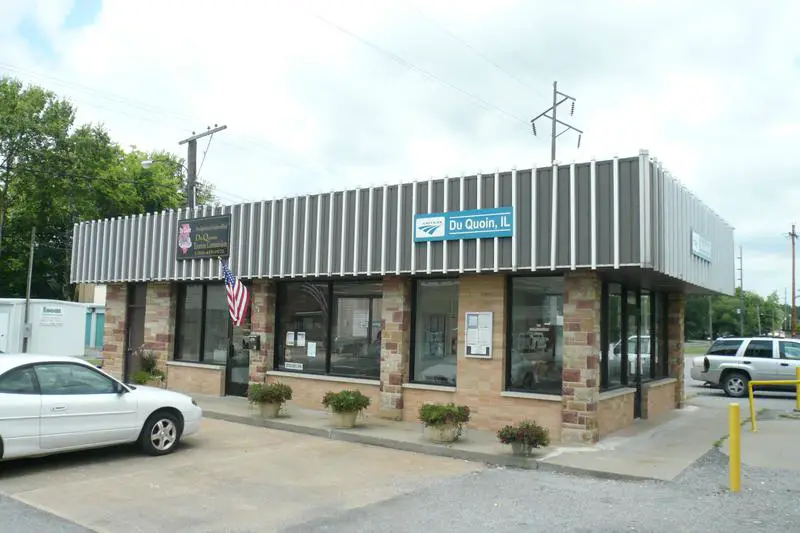
9. Du Quoin
/10
Population: 5,780
Rank Last Year: 16 (Up 7)
Median Income: $47,632 (18th lowest)
Poverty Rate: 28.2% (5th highest)
People In Poverty: 1,632
More on Du Quoin: Data
Du Quoin couldn’t stay out of the top ten poorest places in Illinois; it ranks number 9.
While the median income is the 18th lowest, there are a substantial number of people that live below the poverty line. Overall, Du Quoin ranks as having the 5th most people living in poverty of all the places we analyzed in Illinois.
10. Urbana
/10
Population: 38,447
Rank Last Year: 6 (Down 4)
Median Income: $45,854 (12th lowest)
Poverty Rate: 24.8% (14th highest)
People In Poverty: 9,531
More on Urbana: Data
And rounding out the top ten poorest cities in Illinois is Urbana.
The city of 38,447 people ranks in the bottom 20% for both median income and poverty rate in the Prairie State.
Methodology: How We Determined The Poorest Places In Illinois for 2025
The first thing that comes to most people’s minds when they think about determining the poorest places is to simply the poverty rate. That is, the number of people living below a federally established level of income for a household of a certain size.
However, we don’t think that one statistic wholly encompasses what it means to be one of the “poorest places”. So we used Saturday Night Science to look at this set of criteria from the newly released 2019-2023 American Community Survey:
- Poverty Level
- Median Household Income
After we collected the data for all 330 places with more than 5,000 people in Illinois, we ranked each place from 1 to 330 for each of the criteria, with 1 being the poorest.
We then averaged all the rankings for a place into a “Poor Score” with the place having the lowest overall Poor Score, Carbondale, crowned the “Poorest Place In Illinois For 2025”.
This report has been updated for 2025, which is our tenth time ranking the poorest places in Illinois.
Summary: The Poorest Cities In Illinois For 2025
Like we said earlier, when we set out to identify the poorest places in Illinois, we weren’t sure what we’d encounter, but it ended up being some of the best places to live in Illinois.
When you look at the data, the cities and places mentioned above meet the criteria for being at the very bottom of the income ladder for everyone that lives there.
If you’re curious enough, here are the richest cities in Illinois, according to data:
-
Richest: Hawthorn Woods
2nd Richest: Long Grove
3rd Richest: Hinsdale
For more Illinois reading, check out:
- Richest Cities In Illinois
- Safest Places In Illinois
- Worst Places To Live In Illinois
- Most Expensive Places To Live In Illinois
Detailed List Of The Poorest Places To Live In Illinois
| Rank | City | Population | Poverty Rate | Median Income | People In Poverty |
|---|---|---|---|---|---|
| 1 | Carbondale | 21,813 | 36.9% | $29,670 | 8,042 |
| 2 | East St. Louis | 18,278 | 32.9% | $30,992 | 6,004 |
| 3 | Macomb | 15,006 | 29.4% | $39,753 | 4,419 |
| 4 | Riverdale | 10,515 | 32.3% | $45,709 | 3,393 |
| 5 | Harvey | 19,831 | 25.2% | $41,091 | 5,001 |
| 6 | Kankakee | 24,384 | 27.8% | $45,119 | 6,766 |
| 7 | Danville | 28,663 | 25.1% | $44,239 | 7,185 |
| 8 | DeKalb | 40,464 | 25.7% | $46,564 | 10,399 |
| 9 | Du Quoin | 5,780 | 28.2% | $47,632 | 1,632 |
| 10 | Urbana | 38,447 | 24.8% | $45,854 | 9,531 |
| 11 | Vandalia | 6,041 | 22.1% | $43,184 | 1,336 |
| 12 | West Frankfort | 7,156 | 25.2% | $48,143 | 1,805 |
| 13 | Charleston | 17,212 | 25.3% | $49,057 | 4,349 |
| 14 | Harrisburg | 8,608 | 25.1% | $48,488 | 2,163 |
| 15 | Centralia | 12,009 | 22.6% | $47,308 | 2,712 |
| 16 | Galesburg | 29,653 | 20.7% | $45,213 | 6,135 |
| 17 | Rock Falls | 8,683 | 22.7% | $48,733 | 1,972 |
| 18 | Mattoon | 16,334 | 21.0% | $47,308 | 3,426 |
| 19 | Carlinville | 5,574 | 25.2% | $52,738 | 1,405 |
| 20 | Alton | 25,430 | 24.5% | $53,005 | 6,222 |
| 21 | Calumet City | 35,253 | 23.3% | $53,991 | 8,206 |
| 22 | Rockford | 147,649 | 21.9% | $53,328 | 32,290 |
| 23 | Decatur | 70,368 | 19.1% | $50,809 | 13,461 |
| 24 | Freeport | 23,636 | 18.2% | $48,181 | 4,297 |
| 25 | Murphysboro | 6,804 | 16.4% | $42,367 | 1,115 |
| 26 | Rantoul | 12,515 | 18.7% | $49,821 | 2,339 |
| 27 | Markham | 11,434 | 18.9% | $52,364 | 2,158 |
| 28 | Chicago Heights | 26,938 | 24.7% | $57,479 | 6,656 |
| 29 | North Chicago | 30,772 | 21.9% | $56,815 | 6,732 |
| 30 | Benton | 7,076 | 17.9% | $51,349 | 1,266 |
| 31 | Streator | 12,274 | 20.6% | $54,953 | 2,532 |
| 32 | Mount Vernon | 14,492 | 18.7% | $52,751 | 2,712 |
| 33 | Champaign | 88,822 | 23.9% | $57,544 | 21,219 |
| 34 | Worth | 10,731 | 21.1% | $56,998 | 2,265 |
| 35 | Mount Carmel | 6,892 | 15.9% | $45,884 | 1,094 |
| 36 | Metropolis | 5,898 | 16.6% | $51,548 | 981 |
| 37 | LaSalle | 9,471 | 18.6% | $54,246 | 1,764 |
| 38 | Sauk Village | 9,724 | 20.6% | $56,946 | 2,000 |
| 39 | Rock Island | 36,758 | 20.9% | $57,292 | 7,700 |
| 40 | Lincoln | 13,406 | 18.1% | $54,390 | 2,433 |
| 41 | Salem | 7,341 | 20.1% | $57,083 | 1,477 |
| 42 | Litchfield | 6,814 | 16.9% | $54,190 | 1,154 |
| 43 | Hillsboro | 5,693 | 15.8% | $48,158 | 896 |
| 44 | Sterling | 14,670 | 16.4% | $52,647 | 2,405 |
| 45 | Greenville | 7,159 | 16.5% | $52,727 | 1,178 |
| 46 | Justice | 12,372 | 21.0% | $58,514 | 2,595 |
| 47 | Pana | 5,277 | 14.6% | $45,083 | 772 |
| 48 | Dolton | 20,979 | 20.4% | $58,706 | 4,290 |
| 49 | Peoria | 112,126 | 20.0% | $58,716 | 22,391 |
| 50 | East Alton | 5,729 | 14.5% | $46,926 | 831 |
| 51 | Kewanee | 12,280 | 15.1% | $49,668 | 1,857 |
| 52 | Clinton | 7,012 | 16.4% | $55,960 | 1,149 |
| 53 | Dixon | 15,166 | 17.9% | $58,371 | 2,710 |
| 54 | Hazel Crest | 13,493 | 21.4% | $62,773 | 2,884 |
| 55 | Herrin | 12,271 | 17.4% | $58,501 | 2,137 |
| 56 | Taylorville | 11,149 | 14.7% | $52,720 | 1,636 |
| 57 | Marion | 16,796 | 16.0% | $57,281 | 2,682 |
| 58 | Quincy | 39,188 | 15.4% | $56,372 | 6,046 |
| 59 | Hoopeston | 5,039 | 15.3% | $55,180 | 770 |
| 60 | Princeton | 7,829 | 15.8% | $57,682 | 1,239 |
| 61 | Normal | 52,908 | 21.5% | $66,350 | 11,359 |
| 62 | Monmouth | 8,794 | 16.5% | $59,690 | 1,454 |
| 63 | Park Forest | 20,898 | 17.2% | $62,305 | 3,592 |
| 64 | East Moline | 20,837 | 18.1% | $63,328 | 3,771 |
| 65 | Canton | 13,408 | 14.0% | $54,881 | 1,881 |
| 66 | Olney | 8,864 | 15.4% | $57,997 | 1,365 |
| 67 | Granite City | 26,670 | 16.4% | $60,490 | 4,365 |
| 68 | Zion | 24,466 | 16.5% | $62,574 | 4,046 |
| 69 | Jacksonville | 17,490 | 16.6% | $62,615 | 2,894 |
| 70 | Eureka | 5,095 | 13.9% | $55,172 | 710 |
| 71 | Blue Island | 23,416 | 16.1% | $60,965 | 3,777 |
| 72 | Loves Park | 23,185 | 15.0% | $58,633 | 3,477 |
| 73 | Paris | 8,154 | 11.5% | $51,798 | 939 |
| 74 | Pinckneyville | 5,055 | 13.0% | $55,000 | 656 |
| 75 | Calumet Park | 6,836 | 13.7% | $57,389 | 938 |
| 76 | Pontoon Beach | 6,131 | 14.9% | $59,375 | 914 |
| 77 | Steger | 9,449 | 15.0% | $59,691 | 1,413 |
| 78 | Belvidere | 24,510 | 15.5% | $62,462 | 3,808 |
| 79 | Moline | 42,235 | 16.0% | $63,959 | 6,757 |
| 80 | Springfield | 113,714 | 16.5% | $65,537 | 18,774 |
| 81 | Milan | 5,037 | 15.2% | $61,188 | 763 |
| 82 | Belleville | 41,722 | 14.9% | $60,529 | 6,208 |
| 83 | Mendota | 6,915 | 13.9% | $58,939 | 959 |
| 84 | Chicago Ridge | 14,147 | 17.0% | $69,389 | 2,399 |
| 85 | Pekin | 31,812 | 13.0% | $58,355 | 4,135 |
| 86 | Beardstown | 6,047 | 13.2% | $58,765 | 795 |
| 87 | Chester | 6,830 | 19.6% | $74,673 | 1,335 |
| 88 | Chillicothe | 6,185 | 14.5% | $62,108 | 896 |
| 89 | Silvis | 7,939 | 16.2% | $67,569 | 1,282 |
| 90 | Round Lake Park | 7,833 | 11.5% | $57,486 | 900 |
| 91 | Maywood | 23,173 | 15.2% | $66,498 | 3,533 |
| 92 | Chicago | 2,707,648 | 16.8% | $75,134 | 455,697 |
| 93 | Effingham | 12,258 | 14.8% | $65,718 | 1,816 |
| 94 | Summit | 10,896 | 12.0% | $60,417 | 1,306 |
| 95 | Genoa | 5,685 | 19.1% | $79,343 | 1,084 |
| 96 | University Park | 7,109 | 14.5% | $65,580 | 1,032 |
| 97 | Lansing | 28,415 | 16.0% | $71,805 | 4,535 |
| 98 | Waukegan | 88,919 | 15.3% | $70,578 | 13,631 |
| 99 | Bridgeview | 16,721 | 13.2% | $65,153 | 2,208 |
| 100 | Park City | 7,631 | 12.1% | $62,875 | 924 |