
Like all states, Missouri has certain places that are going on hard times. These Missouri places have an above-average percentage of people living in poverty, out of work, or not making as much as they should be.
Even as the economy continues to improve, it’s worthwhile to look at the places in each state struggling to make ends meet. So we set our sites on locating the poorest places in Missouri.
To do so, we used Saturday Night Science to analyze the newest Census data from the American Community Survey for the 131 cities in Missouri with more than 5,000 people.
Table Of Contents: Top Ten | Methodology | Summary | Table
The 10 Poorest Places In Missouri For 2026:
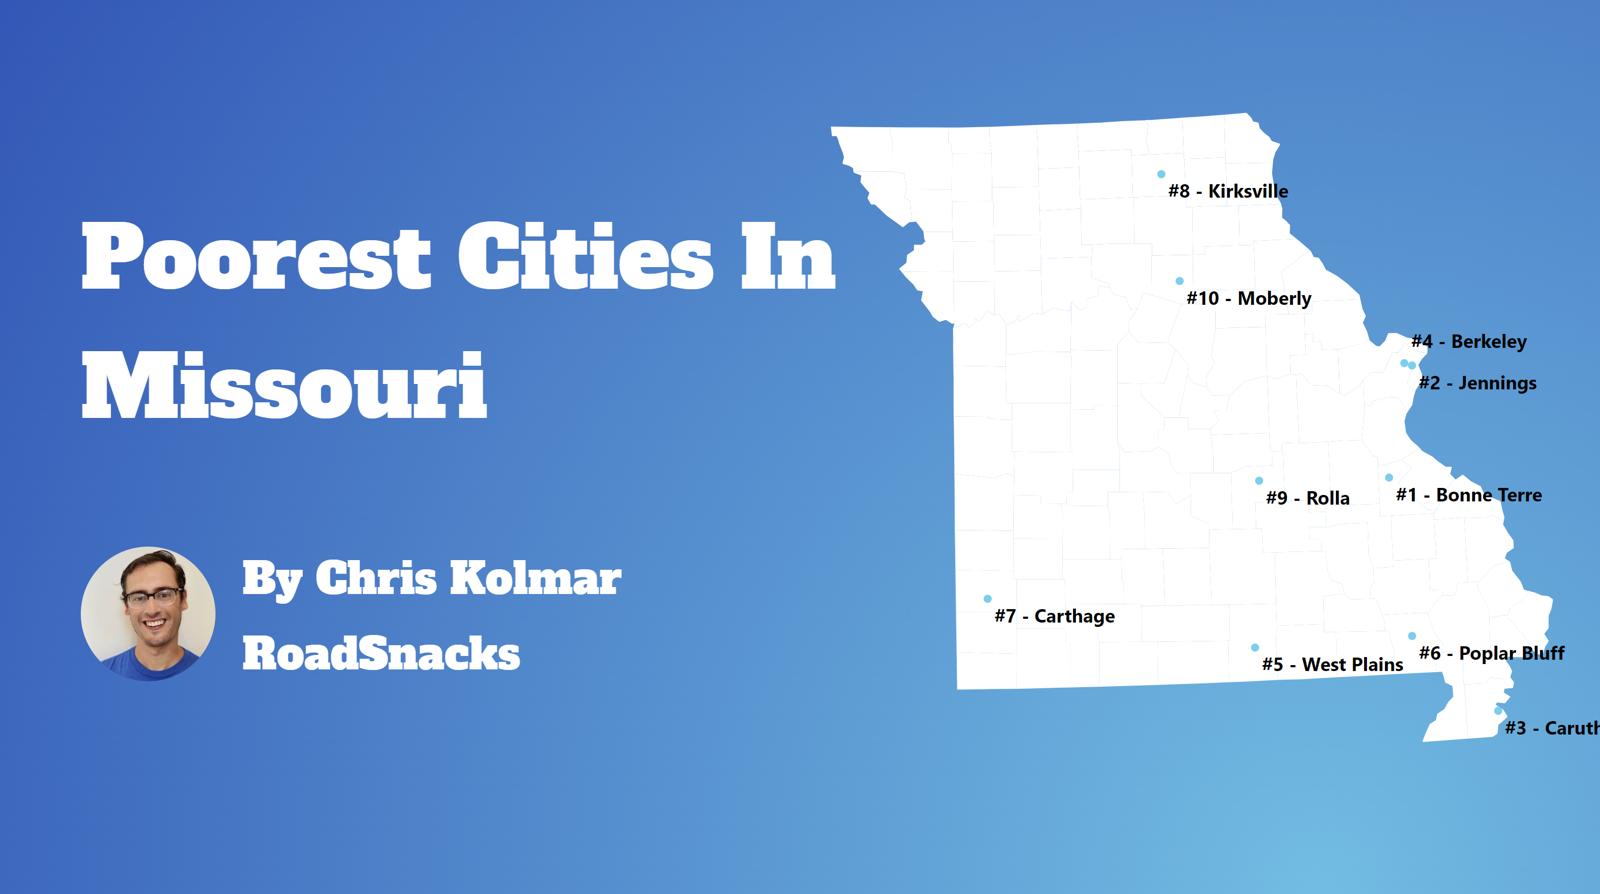
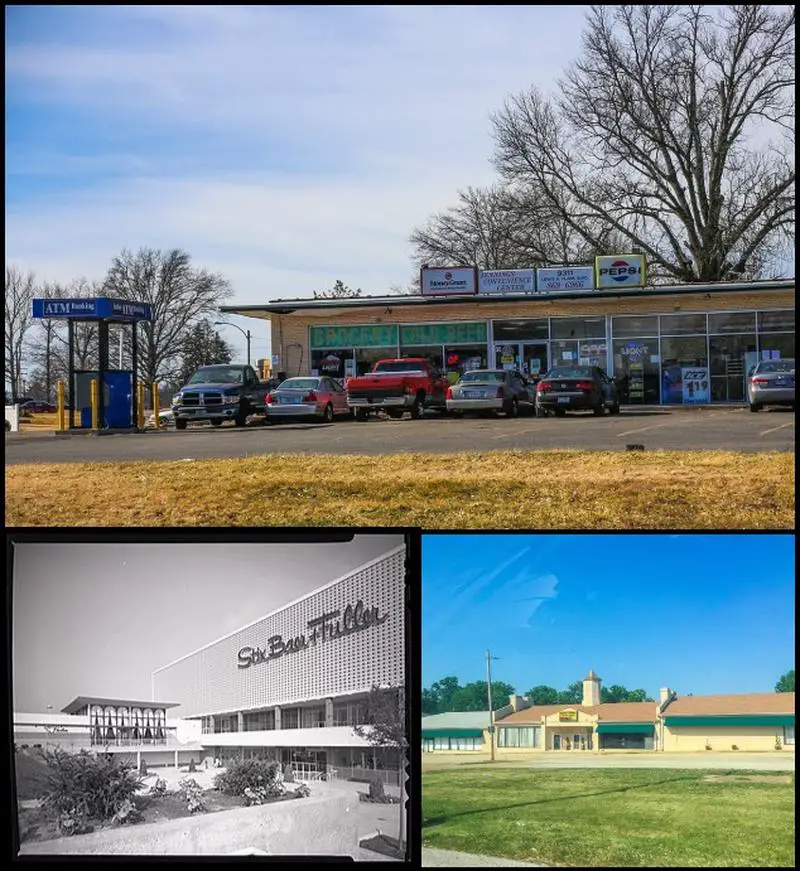
What’s the poorest city in Missouri? According to the facts, Caruthersville is the poorest place in Missouri for 2026.
This isn’t a commentary on the people that live there or the vibrant culture and traditions of these places. Instead, it’s just a look at the facts.
For more Missouri reading, check out:
- Best Places To Live In Missouri
- Cheapest Places To Live In Missouri
- Most Dangerous Cities in Missouri
- The poorest states in the US
- The poorest cities in the US
The 10 Poorest Cities In Missouri For 2026
1. Caruthersville
/10
Population: 5,326
Rank Last Year: 2 (Up 1)
Median Income: $34,652 (lowest)
Poverty Rate: 31.4% (2nd highest)
People In Poverty: 1,670
More on Caruthersville: Data | Crime | Cost Of Living | Movers
Caruthersville, unfortunately, ranks as the poorest place in Missouri thanks to combination of low pay and and a lack of jobs.
The city of 5,326 people averages the lowest median household income in Missouri and the 2nd highest poverty rate. At the very least, the cost of living ranks in the bottom 15% of place in the state, so things like housing are relatively affordable.
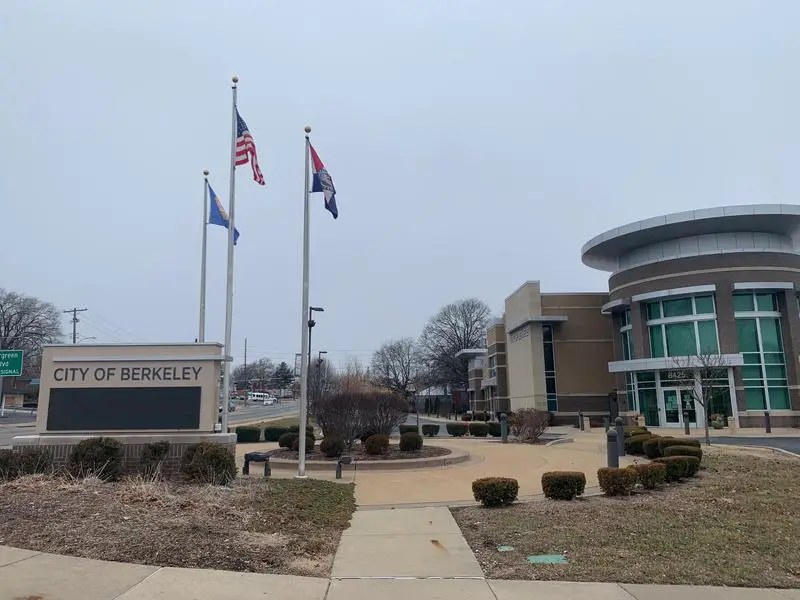
2. Berkeley
/10
Population: 8,123
Rank Last Year: 1 (Down 1)
Median Income: $44,265 (7th lowest)
Poverty Rate: 35.1% (highest)
People In Poverty: 2,852
More on Berkeley: Data | Crime | Cost Of Living | Movers
The second poorest city in Missouri is Berkeley.
The city ranks as having the highest incidence of poverty and 7th lowest median household income. However, the unemployment rate ‘only’ ranks as the 25th highest in the Show Me State.
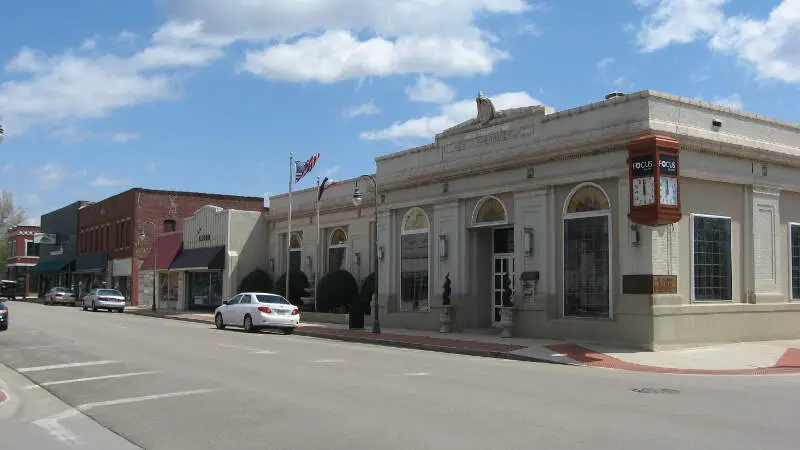
3. Nevada
/10
Population: 7,925
Rank Last Year: 8 (Up 5)
Median Income: $42,813 (4th lowest)
Poverty Rate: 27.8% (6th highest)
People In Poverty: 2,200
More on Nevada: Data | Crime | Cost Of Living | Movers
Placing as the third poorest city, Nevada’s median income ranks as the 4th lowest.
And that’s a sign that there’s a relatively substantial jump in the quality of the economy from second to third place on our list. The poverty rate is 27.77% and ranks near the bottom of places in the state.
But what makes up for the relatively low incomes of the city is its low cost of living. The income you do make here goes further than in most parts of the Show Me State.
4. Jennings
/10
Population: 12,918
Rank Last Year: 5 (Up 1)
Median Income: $38,984 (2nd lowest)
Poverty Rate: 25.2% (8th highest)
People In Poverty: 3,250
More on Jennings: Data | Cost Of Living | Movers
Jennings ranks as the fourth poorest place in Missouri.
The town ranks as having the 2nd lowest median household income and the 8th highest incidence of poverty in the state.
That being said, there’s still a ton of cultural diversity in the city as it hosts many events throughout the year.
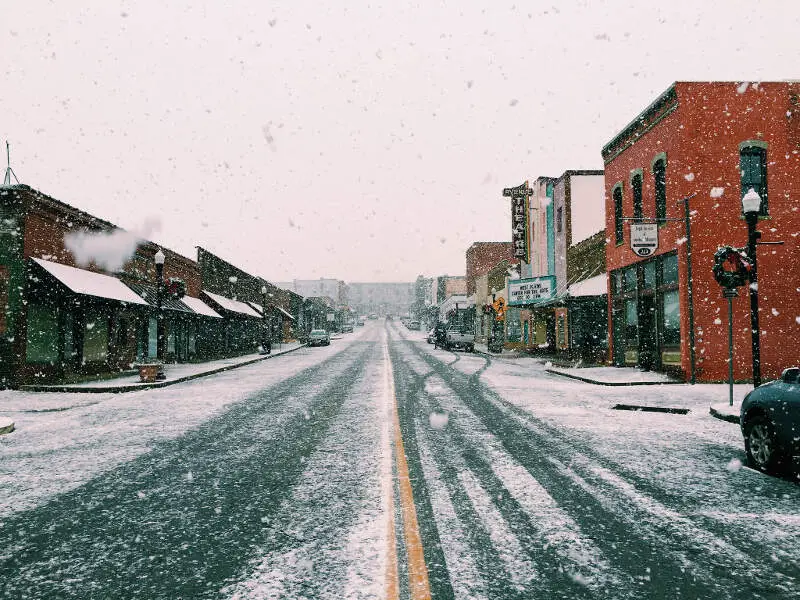
5. West Plains
/10
Population: 12,441
Rank Last Year: 3 (Down 2)
Median Income: $44,002 (5th lowest)
Poverty Rate: 28.1% (5th highest)
People In Poverty: 3,494
More on West Plains: Data | Crime | Cost Of Living | Movers
The fifth poorest city in Missouri is West Plains.
The city ranks as having the 5th lowest median income in the state. However, an extremely low cost of living prevents a good number of folks from living in poverty as the poverty rate only ranks as the 5th highest in Missouri.
Still not the best news for West Plains.
6. Bonne Terre
/10
Population: 6,683
Rank Last Year: 4 (Down 2)
Median Income: $46,179 (8th lowest)
Poverty Rate: 28.3% (3rd highest)
People In Poverty: 1,893
More on Bonne Terre: Data | Crime | Cost Of Living | Movers
Bonne Terre ranks as the sixth poorest place in the Show Me State.
It ranks as having the 3rd highest incidence of poverty and the 5highest unemployment rate.
7. Poplar Bluff
/10
Population: 16,254
Rank Last Year: 6 (Down 1)
Median Income: $41,941 (3rd lowest)
Poverty Rate: 20.8% (15th highest)
People In Poverty: 3,374
More on Poplar Bluff: Data | Crime | Cost Of Living | Movers
Poplar Bluff places as the seventh poorest city in Missouri.
The city of over 16,254 ranks as having the 15th highest incidence of poverty in the state. However, it has a very low cost of living which helps to pay the bills each month.
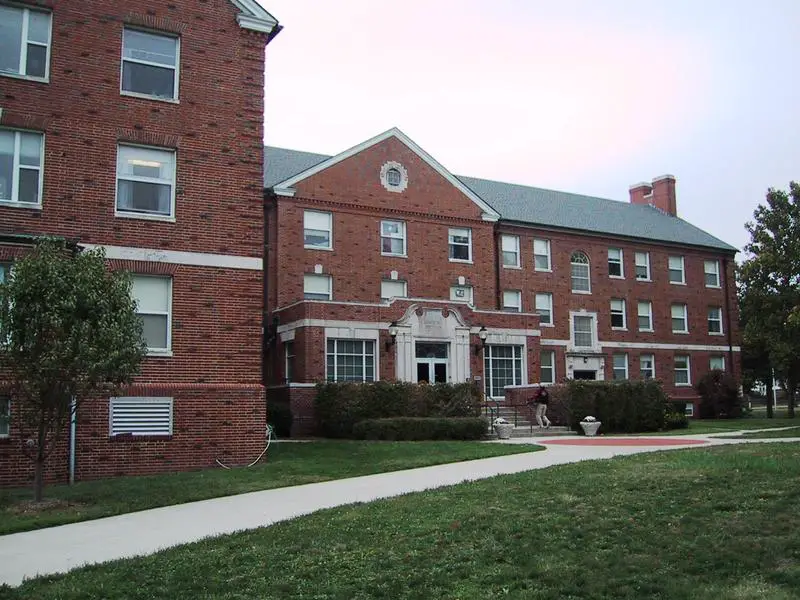
8. Rolla
/10
Population: 20,287
Rank Last Year: 7 (Down 1)
Median Income: $46,204 (9th lowest)
Poverty Rate: 23.6% (11th highest)
People In Poverty: 4,777
More on Rolla: Data | Crime | Cost Of Living | Movers
Rolla ranks as the eighth poorest city in Missouri.
The big issue for the town is the unemployment rate which ranks as one of the highest in the state.
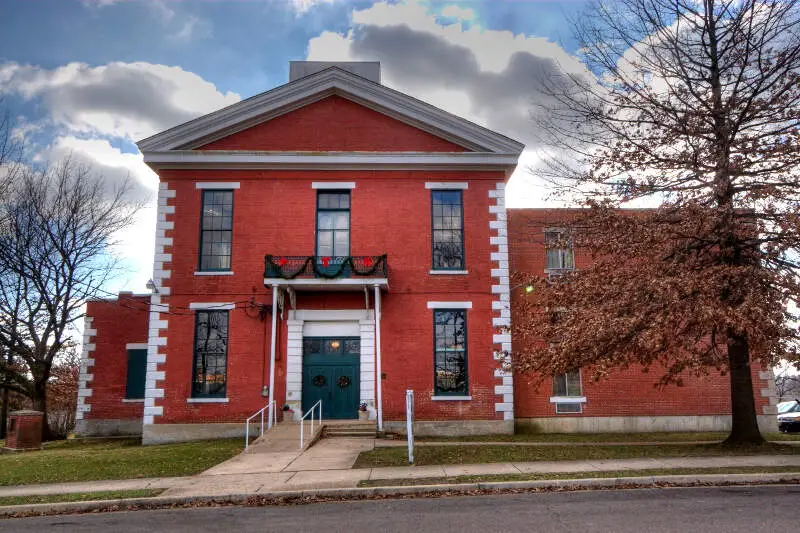
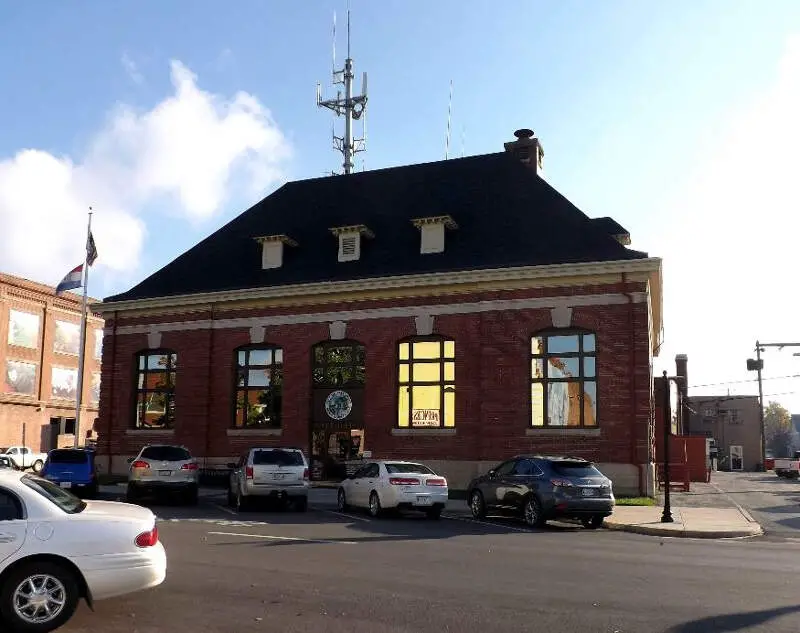
9. Ferguson
/10
Population: 18,213
Rank Last Year: 9 (No Change)
Median Income: $47,524 (10th lowest)
Poverty Rate: 24.2% (10th highest)
People In Poverty: 4,405
More on Ferguson: Data | Crime | Cost Of Living | Movers
Ferguson couldn’t stay out of the top ten poorest places in Missouri; it ranks number 9.
While the median income is the 10th lowest, there are a substantial number of people that live below the poverty line. Overall, Ferguson ranks as having the 10th most people living in poverty of all the places we analyzed in Missouri.
10. Kirksville
/10
Population: 17,563
Rank Last Year: 10 (No Change)
Median Income: $50,071 (19th lowest)
Poverty Rate: 28.2% (4th highest)
People In Poverty: 4,958
More on Kirksville: Data | Crime | Cost Of Living | Movers
And rounding out the top ten poorest cities in Missouri is Kirksville.
The city of 17,563 people ranks in the bottom 20% for both median income and poverty rate in the Show Me State.
Methodology: How We Determined The Poorest Places In Missouri for 2026
The first thing that comes to most people’s minds when they think about determining the poorest places is to simply the poverty rate. That is, the number of people living below a federally established level of income for a household of a certain size.
However, we don’t think that one statistic wholly encompasses what it means to be one of the “poorest places”. So we used Saturday Night Science to look at this set of criteria from the newly released 2020-2024 American Community Survey:
- Poverty Level
- Median Household Income
After we collected the data for all 131 places with more than 5,000 people in Missouri, we ranked each place from 1 to 131 for each of the criteria, with 1 being the poorest.
We then averaged all the rankings for a place into a “Poor Score” with the place having the lowest overall Poor Score, Caruthersville, crowned the “Poorest Place In Missouri For 2026”.
This report has been updated for 2026, which is our eleventh time ranking the poorest places in Missouri.
Summary: The Poorest Cities In Missouri For 2026
Like we said earlier, when we set out to identify the poorest places in Missouri, we weren’t sure what we’d encounter, but it ended up being some of the best places to live in Missouri.
When you look at the data, the cities and places mentioned above meet the criteria for being at the very bottom of the income ladder for everyone that lives there.
If you’re curious enough, here are the richest cities in Missouri, according to data:
-
Richest: Ladue
2nd Richest: Town And Country
3rd Richest: Weldon Spring
For more Missouri reading, check out:
- Richest Cities In Missouri
- Safest Places In Missouri
- Worst Places To Live In Missouri
- Most Expensive Places To Live In Missouri
Detailed List Of The Poorest Places To Live In Missouri
| Rank | City | Population | Poverty Rate | Median Income | People In Poverty |
|---|---|---|---|---|---|
| 1 | Caruthersville | 5,326 | 31.4% | $34,652 | 1,670 |
| 2 | Berkeley | 8,123 | 35.1% | $44,265 | 2,852 |
| 3 | Nevada | 7,925 | 27.8% | $42,813 | 2,200 |
| 4 | Jennings | 12,918 | 25.2% | $38,984 | 3,250 |
| 5 | West Plains | 12,441 | 28.1% | $44,002 | 3,494 |
| 6 | Bonne Terre | 6,683 | 28.3% | $46,179 | 1,893 |
| 7 | Poplar Bluff | 16,254 | 20.8% | $41,941 | 3,374 |
| 8 | Rolla | 20,287 | 23.6% | $46,204 | 4,777 |
| 9 | Ferguson | 18,213 | 24.2% | $47,524 | 4,405 |
| 10 | Kirksville | 17,563 | 28.2% | $50,071 | 4,958 |
| 11 | Lebanon | 15,270 | 21.7% | $48,359 | 3,307 |
| 12 | Bellefontaine Neighbors | 10,498 | 21.4% | $49,170 | 2,243 |
| 13 | Carthage | 15,574 | 27.2% | $51,328 | 4,233 |
| 14 | Moberly | 13,526 | 18.4% | $44,145 | 2,492 |
| 15 | Sedalia | 22,003 | 19.4% | $50,990 | 4,272 |
| 16 | Bolivar | 11,170 | 18.8% | $49,622 | 2,097 |
| 17 | Springfield | 169,954 | 18.4% | $49,311 | 31,271 |
| 18 | Maryville | 10,428 | 24.4% | $53,352 | 2,547 |
| 19 | Branson | 12,817 | 20.2% | $51,978 | 2,592 |
| 20 | Trenton | 5,536 | 18.1% | $50,015 | 1,000 |
| 21 | Aurora | 7,397 | 18.1% | $49,848 | 1,335 |
| 22 | Perryville | 8,536 | 19.0% | $51,897 | 1,620 |
| 23 | Mexico | 11,477 | 17.8% | $50,873 | 2,047 |
| 24 | Kennett | 10,196 | 19.1% | $52,500 | 1,952 |
| 25 | Hannibal | 16,771 | 19.5% | $53,721 | 3,266 |
| 26 | Cape Girardeau | 40,344 | 20.8% | $55,658 | 8,399 |
| 27 | St. Louis | 288,512 | 20.6% | $56,160 | 59,548 |
| 28 | Dexter | 7,891 | 17.0% | $51,701 | 1,339 |
| 29 | Grandview | 26,527 | 17.9% | $53,447 | 4,750 |
| 30 | Joplin | 52,593 | 16.9% | $52,097 | 8,888 |
| 31 | Monett | 9,873 | 15.2% | $49,390 | 1,496 |
| 32 | Clinton | 9,065 | 15.2% | $51,250 | 1,375 |
| 33 | Marshall | 13,739 | 17.1% | $54,437 | 2,353 |
| 34 | Ste. Genevieve | 5,010 | 12.8% | $48,097 | 642 |
| 35 | Pevely | 6,055 | 17.9% | $56,000 | 1,083 |
| 36 | Chillicothe | 8,923 | 16.8% | $54,493 | 1,499 |
| 37 | St. Robert | 5,356 | 19.2% | $62,641 | 1,026 |
| 38 | Farmington | 18,282 | 15.9% | $53,729 | 2,903 |
| 39 | Webb City | 13,221 | 20.5% | $65,469 | 2,712 |
| 40 | St. Joseph | 71,236 | 17.7% | $57,956 | 12,637 |
| 41 | Fulton | 12,617 | 13.9% | $51,429 | 1,760 |
| 42 | St. John | 6,527 | 15.4% | $53,755 | 1,004 |
| 43 | Waynesville | 5,442 | 16.5% | $56,836 | 899 |
| 44 | Hazelwood | 25,114 | 15.9% | $55,908 | 3,985 |
| 45 | Columbia | 128,548 | 19.2% | $66,498 | 24,745 |
| 46 | Park Hills | 8,678 | 14.4% | $52,563 | 1,247 |
| 47 | Warrensburg | 19,582 | 16.2% | $57,067 | 3,166 |
| 48 | St. Ann | 12,811 | 13.0% | $52,323 | 1,667 |
| 49 | De Soto | 6,470 | 13.1% | $52,500 | 845 |
| 50 | Richmond | 5,959 | 16.3% | $59,556 | 971 |
| 51 | Marshfield | 7,696 | 18.1% | $67,642 | 1,390 |
| 52 | Neosho | 13,224 | 15.2% | $57,891 | 2,012 |
| 53 | Independence | 121,740 | 15.8% | $60,339 | 19,259 |
| 54 | Republic | 19,829 | 17.7% | $65,729 | 3,501 |
| 55 | Boonville | 7,689 | 14.3% | $56,429 | 1,098 |
| 56 | Cameron | 8,519 | 15.7% | $61,791 | 1,339 |
| 57 | Warrenton | 9,066 | 14.6% | $61,031 | 1,325 |
| 58 | Sikeston | 16,320 | 14.2% | $58,915 | 2,325 |
| 59 | Festus | 13,201 | 17.1% | $73,532 | 2,252 |
| 60 | Kansas City | 510,612 | 14.7% | $69,166 | 74,804 |
| 61 | Macon | 5,466 | 10.5% | $61,642 | 573 |
| 62 | Excelsior Springs | 10,484 | 15.2% | $72,609 | 1,590 |
| 63 | Sullivan | 6,310 | 11.4% | $63,370 | 722 |
| 64 | Overland | 15,695 | 9.7% | $61,773 | 1,520 |
| 65 | Jefferson City | 42,488 | 12.0% | $66,371 | 5,094 |
| 66 | Florissant | 51,773 | 10.1% | $65,318 | 5,234 |
| 67 | Raytown | 29,445 | 12.5% | $68,840 | 3,686 |
| 68 | Bridgeton | 11,369 | 11.5% | $72,005 | 1,302 |
| 69 | Maplewood | 8,156 | 8.7% | $65,125 | 711 |
| 70 | Ozark | 22,417 | 12.6% | $74,182 | 2,817 |
| 71 | University City | 34,685 | 14.5% | $80,694 | 5,032 |
| 72 | Troy | 13,947 | 13.6% | $79,012 | 1,894 |
| 73 | Valley Park | 6,795 | 9.8% | $67,898 | 669 |
| 74 | Harrisonville | 9,970 | 7.2% | $62,473 | 714 |
| 75 | Belton | 25,008 | 9.7% | $69,226 | 2,430 |
| 76 | Gladstone | 27,207 | 11.0% | $79,271 | 2,984 |
| 77 | Oak Grove | 8,538 | 8.6% | $75,102 | 735 |
| 78 | Union | 12,781 | 8.2% | $73,435 | 1,041 |
| 79 | Jackson | 15,659 | 8.6% | $77,105 | 1,343 |
| 80 | Shrewsbury | 6,316 | 10.0% | $80,757 | 632 |
| 81 | Pacific | 7,475 | 5.5% | $62,860 | 410 |
| 82 | Arnold | 20,956 | 8.2% | $78,370 | 1,712 |
| 83 | Willard | 6,488 | 9.7% | $84,600 | 629 |
| 84 | Grain Valley | 16,271 | 9.8% | $89,649 | 1,586 |
| 85 | Carl Junction | 8,339 | 8.4% | $82,879 | 702 |
| 86 | Washington | 15,130 | 7.9% | $79,173 | 1,196 |
| 87 | Savannah | 5,053 | 4.3% | $62,535 | 219 |
| 88 | Nixa | 24,836 | 7.1% | $83,385 | 1,763 |
| 89 | St. Charles | 71,508 | 7.3% | $85,937 | 5,212 |
| 90 | Wright City | 5,240 | 5.8% | $80,152 | 304 |
| 91 | Blue Springs | 59,965 | 7.0% | $88,920 | 4,179 |
| 92 | Liberty | 30,689 | 7.0% | $88,542 | 2,135 |
| 93 | Black Jack | 6,589 | 5.0% | $78,331 | 329 |
| 94 | Manchester | 18,160 | 6.4% | $97,801 | 1,162 |
| 95 | St. Peters | 59,092 | 5.7% | $91,637 | 3,338 |
| 96 | Pleasant Hill | 8,847 | 6.0% | $95,602 | 535 |
| 97 | Herculaneum | 5,071 | 5.6% | $93,438 | 282 |
| 98 | Eureka | 13,081 | 7.9% | $108,394 | 1,036 |
| 99 | Odessa | 5,620 | 6.1% | $100,022 | 345 |
| 100 | Richmond Heights | 9,153 | 5.5% | $94,460 | 501 |
No wonder Eldon is ranked 10th; it lost all of it’s industry thinking it was a tourist town???????