
Like all states, Pennsylvania has certain places that are going on hard times. These Pennsylvania places have an above-average percentage of people living in poverty, out of work, or not making as much as they should be.
Even as the economy continues to improve, it’s worthwhile to look at the places in each state struggling to make ends meet. So we set our sites on locating the poorest places in Pennsylvania.
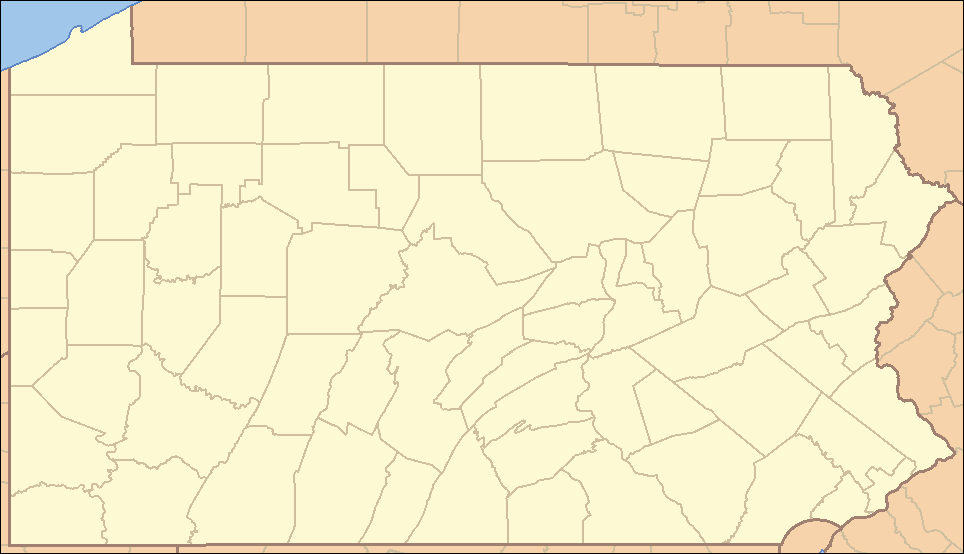
To do so, we used Saturday Night Science to analyze the newest Census data from the American Community Survey for the 192 cities in Pennsylvania with more than 5,000 people.
Table Of Contents: Top Ten | Methodology | Summary | Table
The 10 Poorest Places In Pennsylvania For 2025:
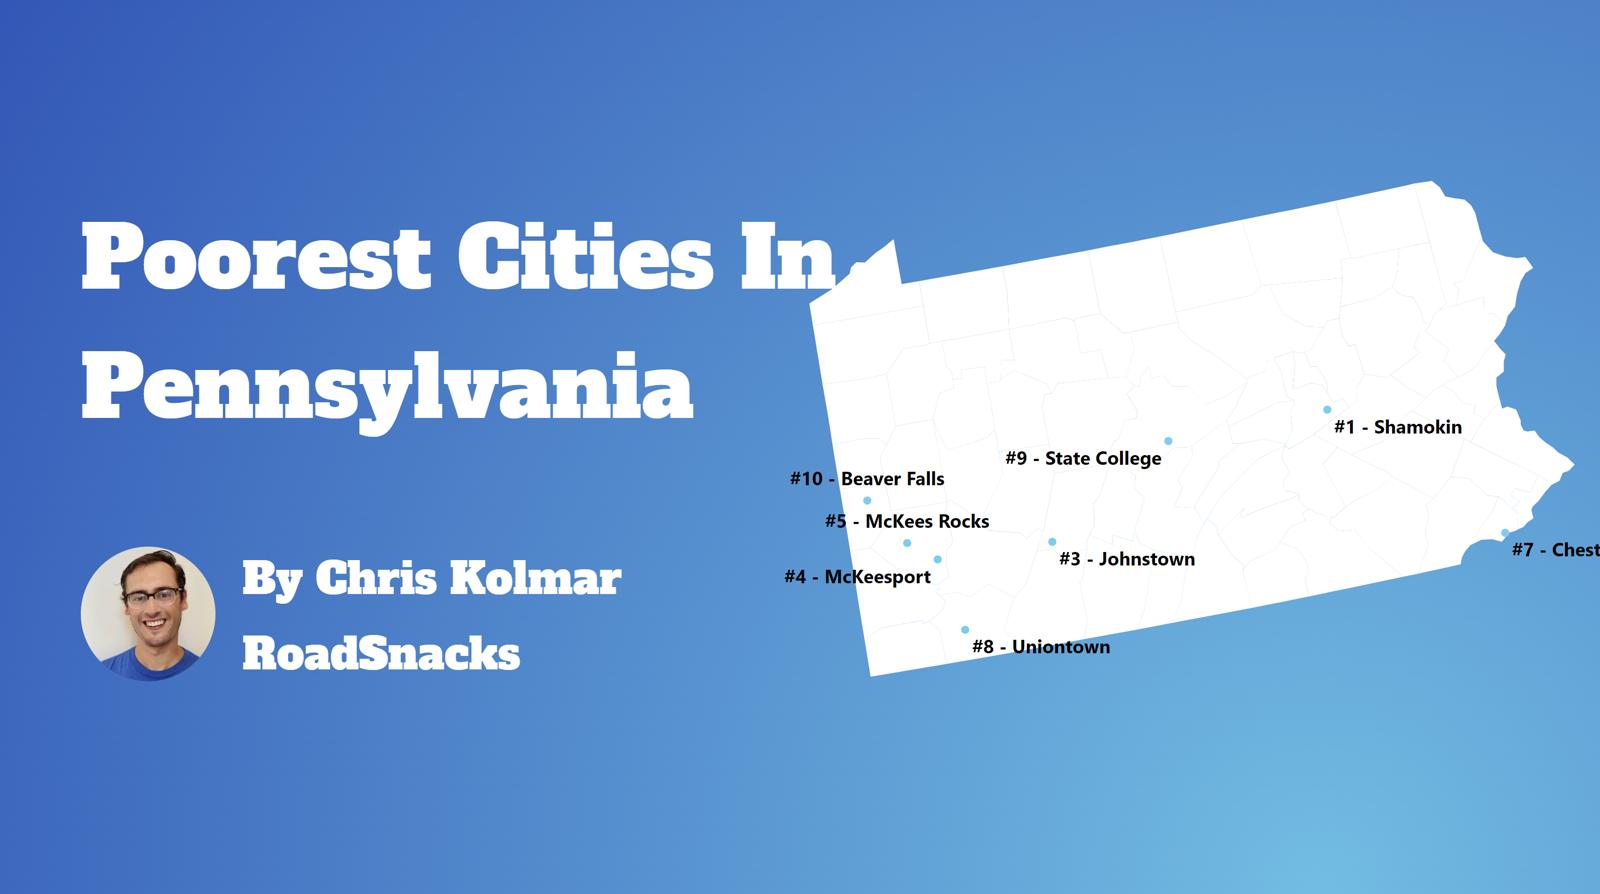
What’s the poorest city in Pennsylvania? According to the facts, Mckees Rocks is the poorest place in Pennsylvania for 2025.
This isn’t a commentary on the people that live there or the vibrant culture and traditions of these places. Instead, it’s just a look at the facts.
For more Pennsylvania reading, check out:
- Best Places To Live In Pennsylvania
- Cheapest Places To Live In Pennsylvania
- Most Dangerous Cities In Pennsylvania
- The poorest states in the US
- The poorest cities in the US
The 10 Poorest Cities In Pennsylvania For 2025
1. McKees Rocks
/10
Population: 5,827
Rank Last Year: 3 (Up 2)
Median Income: $33,510 (2nd lowest)
Poverty Rate: 33.1% (2nd highest)
People In Poverty: 1,931
More on Mckees Rocks: Data
McKees Rocks, unfortunately, ranks as the poorest place in Pennsylvania thanks to combination of low pay and and a lack of jobs.
The city of 5,827 people averages the 2nd lowest median household income in Pennsylvania and the 2nd highest poverty rate. At the very least, the cost of living ranks in the bottom 15% of place in the state, so things like housing are relatively affordable.
2. McKeesport
/10
Population: 17,520
Rank Last Year: 4 (Up 2)
Median Income: $31,854 (lowest)
Poverty Rate: 32.9% (3rd highest)
People In Poverty: 5,771
More on Mckeesport: Data
The second poorest city in Pennsylvania is McKeesport.
The city ranks as having the 3rd highest incidence of poverty and lowest median household income. However, the unemployment rate ‘only’ ranks as the 15th highest in the Keystone State.
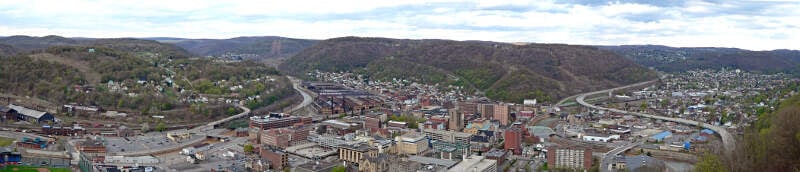
3. Johnstown
/10
Population: 18,245
Rank Last Year: 2 (Down 1)
Median Income: $34,784 (3rd lowest)
Poverty Rate: 31.2% (6th highest)
People In Poverty: 5,699
More on Johnstown: Data
Placing as the third poorest city, Johnstown’s median income ranks as the 3rd lowest.
And that’s a sign that there’s a relatively substantial jump in the quality of the economy from second to third place on our list. The poverty rate is 31.24% and ranks near the bottom of places in the state.
But what makes up for the relatively low incomes of the city is its low cost of living. The income you do make here goes further than in most parts of the Keystone State.
4. Chester
/10
Population: 33,209
Rank Last Year: 6 (Up 2)
Median Income: $39,809 (7th lowest)
Poverty Rate: 30.8% (7th highest)
People In Poverty: 10,235
More on Chester: Data
Chester ranks as the fourth poorest place in Pennsylvania.
The town ranks as having the 7th lowest median household income and the 7th highest incidence of poverty in the state.
That being said, there’s still a ton of cultural diversity in the city as it hosts many events throughout the year.
5. Lewi

/10
Population: 8,505
Rank Last Year: 5 (No Change)
Median Income: $40,179 (10th lowest)
Poverty Rate: 32.5% (4th highest)
People In Poverty: 2,761
More on Lewi: Data
The fifth poorest city in Pennsylvania is Lewi.
The city ranks as having the 10th lowest median income in the state. However, an extremely low cost of living prevents a good number of folks from living in poverty as the poverty rate only ranks as the 4th highest in Pennsylvania.
Still not the best news for Lewi.
6. Clairton
/10
Population: 6,105
Rank Last Year: 25 (Up 19)
Median Income: $39,884 (8th lowest)
Poverty Rate: 29.9% (9th highest)
People In Poverty: 1,825
More on Clairton: Data
Clairton ranks as the sixth poorest place in the Keystone State.
It ranks as having the 9th highest incidence of poverty and the 18th highest unemployment rate.
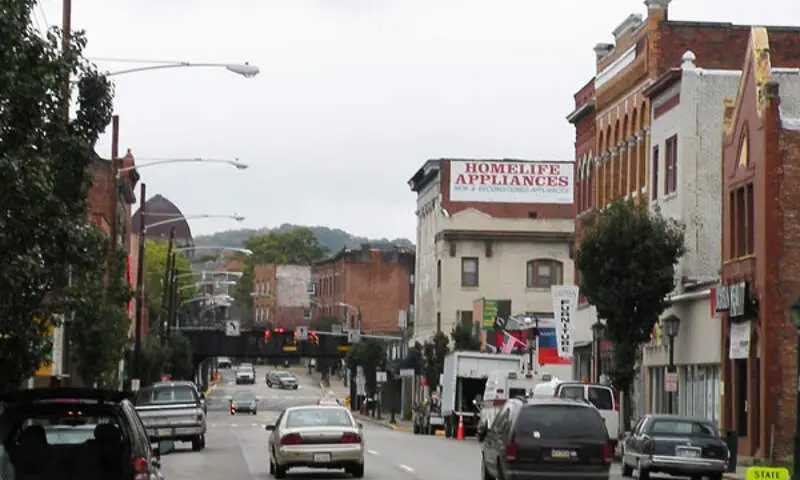
7. Shamokin
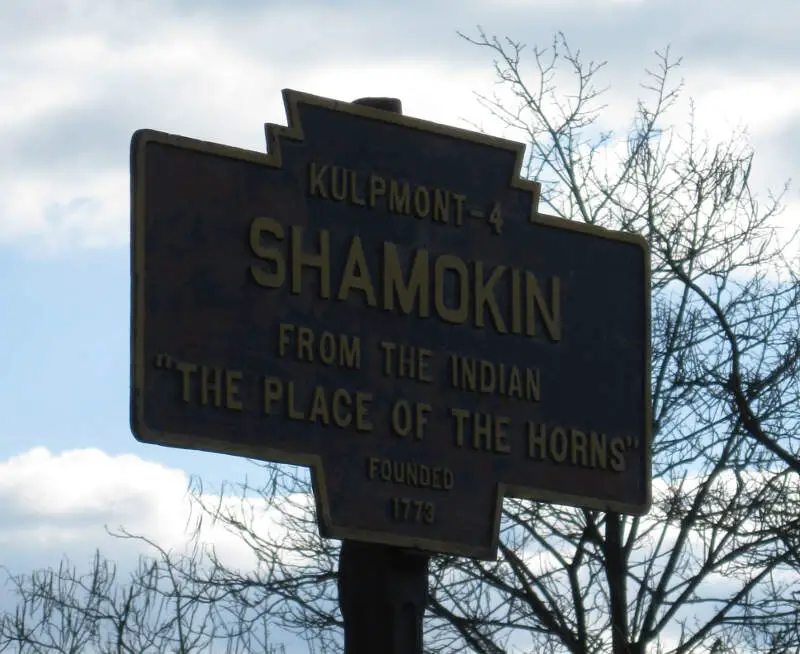
/10
Population: 6,890
Rank Last Year: 1 (Down 6)
Median Income: $36,438 (6th lowest)
Poverty Rate: 27.4% (13th highest)
People In Poverty: 1,885
More on Shamokin: Data
Shamokin places as the seventh poorest city in Pennsylvania.
The city of over 6,890 ranks as having the 13th highest incidence of poverty in the state. However, it has a very low cost of living which helps to pay the bills each month.
8. Duquesne
/10
Population: 5,186
Rank Last Year: 15 (Up 7)
Median Income: $41,208 (12th lowest)
Poverty Rate: 29.4% (10th highest)
People In Poverty: 1,525
More on Duquesne: Data
Duquesne ranks as the eighth poorest city in Pennsylvania.
The big issue for the town is the unemployment rate which ranks as one of the highest in the state.
9. Uniontown
/10
Population: 9,819
Rank Last Year: 7 (Down 2)
Median Income: $35,451 (4th lowest)
Poverty Rate: 26.0% (19th highest)
People In Poverty: 2,550
More on Uniontown: Data
Uniontown couldn’t stay out of the top ten poorest places in Pennsylvania; it ranks number 9.
While the median income is the 4th lowest, there are a substantial number of people that live below the poverty line. Overall, Uniontown ranks as having the 19th most people living in poverty of all the places we analyzed in Pennsylvania.
10. Darby
/10
Population: 10,664
Rank Last Year: 13 (Up 3)
Median Income: $45,128 (25th lowest)
Poverty Rate: 31.5% (5th highest)
People In Poverty: 3,360
More on Darby: Data
And rounding out the top ten poorest cities in Pennsylvania is Darby.
The city of 10,664 people ranks in the bottom 20% for both median income and poverty rate in the Keystone State.
Methodology: How We Determined The Poorest Places In Pennsylvania for 2025
The first thing that comes to most people’s minds when they think about determining the poorest places is to simply the poverty rate. That is, the number of people living below a federally established level of income for a household of a certain size.
However, we don’t think that one statistic wholly encompasses what it means to be one of the “poorest places”. So we used Saturday Night Science to look at this set of criteria from the newly released 2019-2023 American Community Survey:
- Poverty Level
- Median Household Income
After we collected the data for all 192 places with more than 5,000 people in Pennsylvania, we ranked each place from 1 to 192 for each of the criteria, with 1 being the poorest.
We then averaged all the rankings for a place into a “Poor Score” with the place having the lowest overall Poor Score, Mckees Rocks, crowned the “Poorest Place In Pennsylvania For 2025”.
This report has been updated for 2025, which is our tenth time ranking the poorest places in Pennsylvania.
Summary: The Poorest Cities In Pennsylvania For 2025
Like we said earlier, when we set out to identify the poorest places in Pennsylvania, we weren’t sure what we’d encounter, but it ended up being some of the best places to live in Pennsylvania.
When you look at the data, the cities and places mentioned above meet the criteria for being at the very bottom of the income ladder for everyone that lives there.
If you’re curious enough, here are the richest cities in Pennsylvania, according to data:
-
Richest: Fox Chapel
2nd Richest: Franklin Park
3rd Richest: Jefferson Hills
For more Pennsylvania reading, check out:
- Richest Cities In Pennsylvania
- Safest Places In Pennsylvania
- Worst Places To Live In Pennsylvania
- Most Expensive Places To Live In Pennsylvania
Detailed List Of The Poorest Places To Live In Pennsylvania
| Rank | City | Population | Poverty Rate | Median Income | People In Poverty |
|---|---|---|---|---|---|
| 1 | McKees Rocks | 5,827 | 33.1% | $33,510 | 1,931 |
| 2 | McKeesport | 17,520 | 32.9% | $31,854 | 5,771 |
| 3 | Johnstown | 18,245 | 31.2% | $34,784 | 5,699 |
| 4 | Chester | 33,209 | 30.8% | $39,809 | 10,235 |
| 5 | Lewi | 8,505 | 32.5% | $40,179 | 2,761 |
| 6 | Clairton | 6,105 | 29.9% | $39,884 | 1,825 |
| 7 | Shamokin | 6,890 | 27.4% | $36,438 | 1,885 |
| 8 | Duquesne | 5,186 | 29.4% | $41,208 | 1,525 |
| 9 | Uniontown | 9,819 | 26.0% | $35,451 | 2,550 |
| 10 | Darby | 10,664 | 31.5% | $45,128 | 3,360 |
| 11 | New Castle | 21,727 | 26.1% | $41,478 | 5,675 |
| 12 | Lock Haven | 8,386 | 25.0% | $40,131 | 2,093 |
| 13 | State College | 40,669 | 39.1% | $47,132 | 15,885 |
| 14 | Hazleton | 29,886 | 27.0% | $43,379 | 8,069 |
| 15 | Corry | 6,162 | 29.2% | $45,081 | 1,796 |
| 16 | Edinboro | 5,303 | 24.6% | $40,862 | 1,305 |
| 17 | Tamaqua | 6,922 | 26.1% | $44,803 | 1,805 |
| 18 | Titusville | 5,230 | 22.4% | $36,055 | 1,173 |
| 19 | Reading | 94,836 | 27.0% | $45,599 | 25,586 |
| 20 | Erie | 94,156 | 24.6% | $43,397 | 23,115 |
| 21 | Harrisburg | 50,092 | 29.1% | $47,783 | 14,566 |
| 22 | Butler | 13,306 | 22.9% | $41,705 | 3,048 |
| 23 | Bloomsburg | 12,906 | 30.6% | $49,096 | 3,945 |
| 24 | Turtle Creek | 5,046 | 23.6% | $44,449 | 1,188 |
| 25 | West Hazleton | 5,156 | 24.4% | $46,968 | 1,256 |
| 26 | California | 5,046 | 27.2% | $49,500 | 1,373 |
| 27 | Plymouth | 5,761 | 21.4% | $42,348 | 1,234 |
| 28 | Carbondale | 8,820 | 25.0% | $48,592 | 2,205 |
| 29 | Williamsport | 27,629 | 25.2% | $49,363 | 6,959 |
| 30 | Punxsutawney | 5,689 | 21.4% | $43,097 | 1,217 |
| 31 | York | 44,830 | 22.7% | $47,115 | 10,167 |
| 32 | Lebanon | 26,600 | 22.9% | $47,439 | 6,096 |
| 33 | Pittston | 7,618 | 22.7% | $47,525 | 1,729 |
| 34 | Sharon | 13,019 | 21.3% | $44,595 | 2,775 |
| 35 | Berwick | 10,291 | 21.7% | $45,338 | 2,234 |
| 36 | Vandergrift | 5,028 | 24.9% | $50,351 | 1,253 |
| 37 | Somerset | 5,984 | 19.5% | $41,782 | 1,166 |
| 38 | Collingdale | 8,862 | 24.1% | $49,578 | 2,134 |
| 39 | Indiana | 14,170 | 19.8% | $44,784 | 2,811 |
| 40 | Beaver Falls | 8,885 | 21.7% | $48,462 | 1,931 |
| 41 | Jeannette | 8,719 | 22.4% | $49,558 | 1,951 |
| 42 | Wilkes-Barre | 44,217 | 21.1% | $47,970 | 9,347 |
| 43 | Scranton | 76,074 | 22.0% | $49,531 | 16,705 |
| 44 | Wilkinsburg | 14,165 | 20.3% | $48,565 | 2,881 |
| 45 | Meadville | 12,723 | 18.3% | $46,012 | 2,324 |
| 46 | Connellsville | 6,914 | 17.9% | $47,176 | 1,238 |
| 47 | Bradford | 7,738 | 24.4% | $56,330 | 1,884 |
| 48 | Aliquippa | 9,146 | 19.9% | $51,050 | 1,820 |
| 49 | Allentown | 125,320 | 21.6% | $53,403 | 27,018 |
| 50 | Clearfield | 5,918 | 20.1% | $51,190 | 1,191 |
| 51 | Altoona | 43,508 | 18.8% | $50,171 | 8,196 |
| 52 | Monessen | 6,825 | 19.6% | $51,094 | 1,338 |
| 53 | Steelton | 6,267 | 22.3% | $55,963 | 1,395 |
| 54 | New Brighton | 5,600 | 18.7% | $50,426 | 1,044 |
| 55 | Lewisburg | 5,247 | 19.5% | $51,674 | 1,022 |
| 56 | Sunbury | 9,643 | 16.2% | $48,509 | 1,561 |
| 57 | New Kensington | 12,072 | 16.9% | $49,644 | 2,037 |
| 58 | Kingston | 13,333 | 19.3% | $53,885 | 2,573 |
| 59 | Oxford | 5,763 | 23.8% | $61,470 | 1,372 |
| 60 | Pott | 23,392 | 19.8% | $56,174 | 4,619 |
| 61 | Pottsville | 13,374 | 18.3% | $53,465 | 2,448 |
| 62 | Coatesville | 13,323 | 20.4% | $57,323 | 2,719 |
| 63 | Oil City | 9,517 | 18.0% | $52,688 | 1,710 |
| 64 | Columbia | 10,217 | 17.4% | $52,271 | 1,779 |
| 65 | Philadelphia | 1,582,432 | 22.0% | $60,698 | 348,135 |
| 66 | Ambridge | 6,912 | 15.6% | $50,978 | 1,081 |
| 67 | Mount Carmel | 5,695 | 16.2% | $52,667 | 924 |
| 68 | Washington | 13,361 | 16.1% | $52,350 | 2,157 |
| 69 | Franklin | 6,026 | 17.2% | $54,955 | 1,037 |
| 70 | Millersville | 8,711 | 24.5% | $65,721 | 2,135 |
| 71 | Exeter | 5,514 | 12.8% | $49,432 | 704 |
| 72 | Lancaster | 57,683 | 20.7% | $63,421 | 11,928 |
| 73 | Duryea | 5,054 | 21.4% | $64,028 | 1,083 |
| 74 | Munhall | 10,633 | 13.7% | $52,037 | 1,460 |
| 75 | Sharon Hill | 5,978 | 23.8% | $68,529 | 1,423 |
| 76 | Middl | 9,567 | 14.6% | $54,778 | 1,392 |
| 77 | Bellefonte | 6,022 | 16.3% | $57,157 | 983 |
| 78 | Carlisle | 21,335 | 17.4% | $59,742 | 3,710 |
| 79 | Warren | 9,273 | 11.7% | $50,877 | 1,085 |
| 80 | Folcroft | 6,748 | 17.1% | $58,899 | 1,151 |
| 81 | Nanticoke | 10,610 | 17.7% | $60,340 | 1,880 |
| 82 | Brentwood | 9,927 | 17.5% | $60,432 | 1,736 |
| 83 | Nazareth | 6,032 | 15.9% | $57,551 | 957 |
| 84 | Tyrone | 5,421 | 13.8% | $55,568 | 750 |
| 85 | Gettysburg | 7,929 | 12.6% | $52,656 | 995 |
| 86 | Pittsburgh | 303,620 | 19.5% | $64,137 | 59,114 |
| 87 | Shippensburg | 5,811 | 11.7% | $52,344 | 676 |
| 88 | Milton | 6,582 | 12.3% | $53,552 | 809 |
| 89 | Dickson City | 6,022 | 14.7% | $58,343 | 884 |
| 90 | Easton | 29,079 | 17.9% | $63,775 | 5,216 |
| 91 | Norri | 35,782 | 19.0% | $65,058 | 6,787 |
| 92 | Coraopolis | 5,464 | 15.1% | $60,174 | 823 |
| 93 | Chambersburg | 22,051 | 11.7% | $56,177 | 2,586 |
| 94 | Sayre | 5,444 | 11.3% | $55,393 | 616 |
| 95 | Taylor | 6,261 | 14.1% | $60,446 | 880 |
| 96 | Swissvale | 8,499 | 13.1% | $60,114 | 1,112 |
| 97 | Greenville | 5,533 | 11.6% | $56,850 | 643 |
| 98 | East Stroudsburg | 9,278 | 14.1% | $61,792 | 1,304 |
| 99 | Monaca | 5,557 | 15.9% | $64,839 | 885 |
| 100 | Red Lion | 6,494 | 14.2% | $63,672 | 922 |