
Most African American cities in Arkansas research summary. We used Saturday Night Science to analyze Arkansas’s most recent Census data to determine the blackest cities in Arkansas based on the percentage of Black residents. Here are the results of our analysis:
-
The city with the largest African American population in Arkansas is Pine Bluff based on the most recent Census data.
-
Pine Bluff is 76.2% Black.
-
The least African American city in Arkansas is Mena.
-
Mena is 0.11% Black.
-
Arkansas is 14.6% Black.
-
Arkansas is the 11th blackest state in the United States.
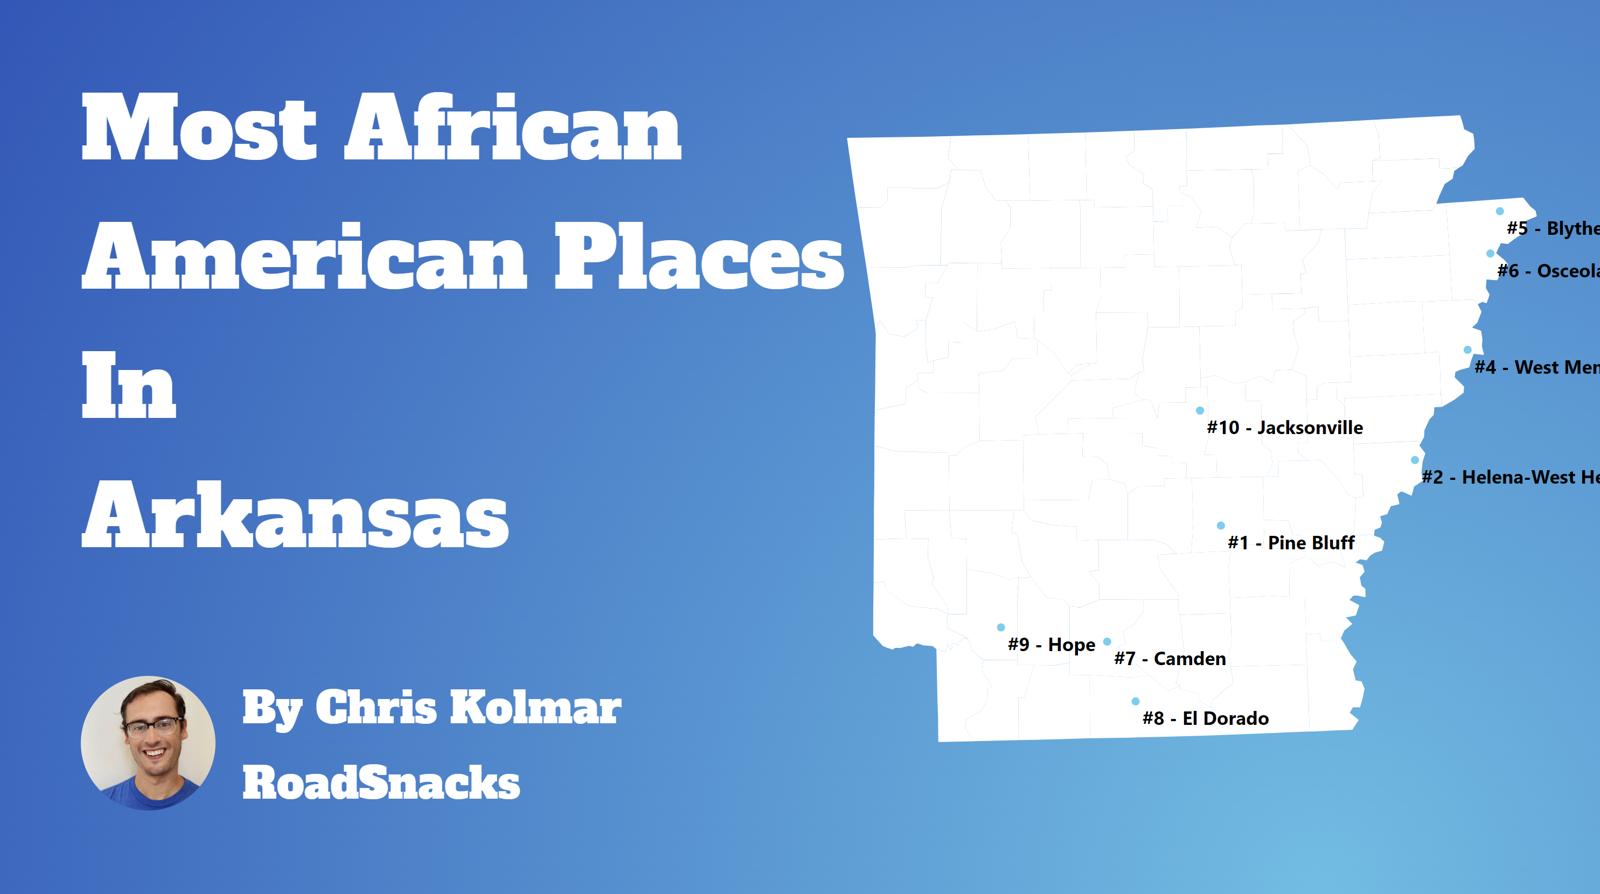
Table Of Contents: Top Ten | Methodology | Summary | Table
The Black community is one of the fastest-growing communities in America this decade.
Roughly 42 million people identifying as Black or African American live in the United States, making up 12% of the total population. According to the most recent American Community Survey, the Black population in Arkansas is 446,603 – at 14.6% of the total population of Arkansas.
The percentage growth of Blacks in America is the third largest percentage change for any race according to the Census’s race and ethnicity definition. Most scholars and historians agree that increasing diversity in America is a good thing.
We agree.
But how has the increase in the black population impacted Arkansas? Which cities and towns in Arkansas have seen the greatest increase in its Black population?
We broke down the most recent census data to determine the cities in Arkansas with the largest African American population in 2026:
Most African American Places In Arkansas
What’s the blackest city in Arkansas? The city with the largest Black population in Arkansas for 2026 is Pine Bluff. See if Pine Bluff ranked as one of the most african american places in America.
And if you already knew these places were Black, check out the best places to live in Arkansas or the most diverse places in Arkansas.
The 10 Blackest Cities In Arkansas For 2026
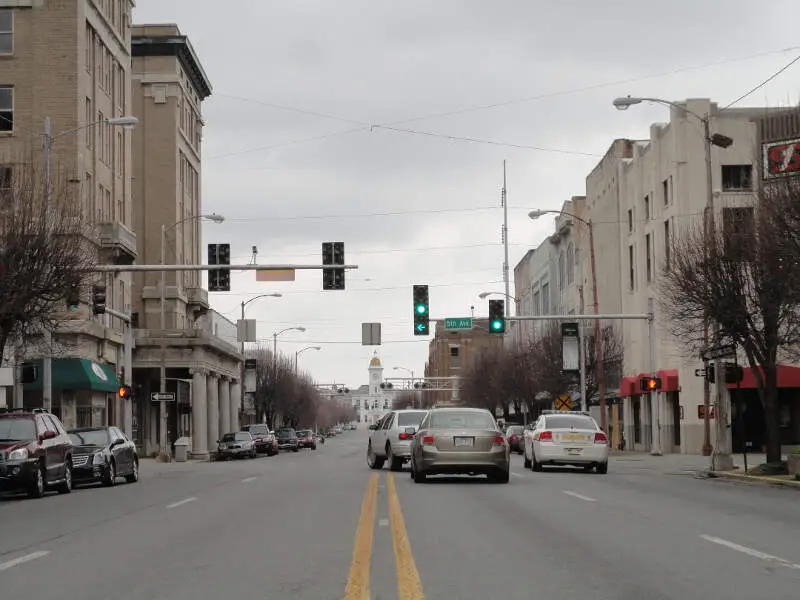
1. Pine Bluff
/10
Population: 39,743
% African American: 76.2%
# Of African American Residents: 30,285
Percent Change Since 2010: -17.04%
More on Pine Bluff: Data | Cost Of Living | Movers
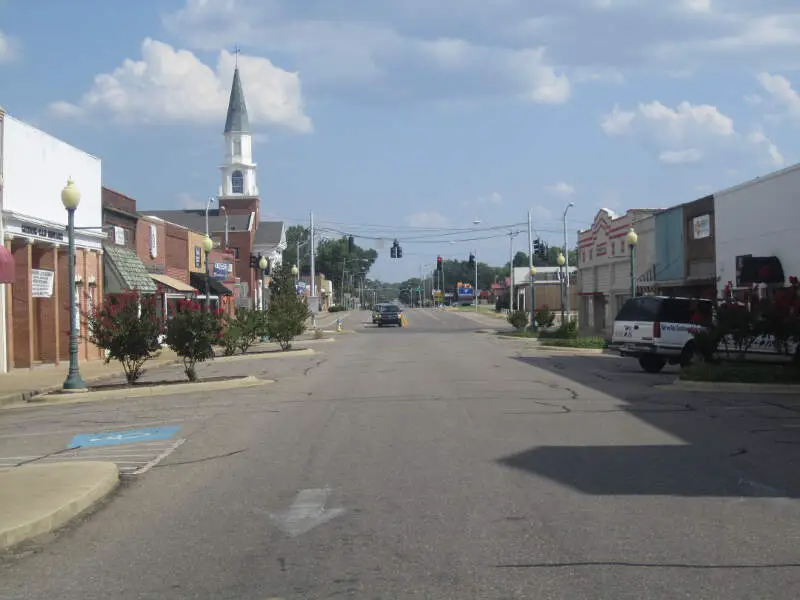
2. Forrest City
/10
Population: 12,646
% African American: 73.14%
# Of African American Residents: 9,249
Percent Change Since 2010: -10.12%
More on Forrest City: Data | Cost Of Living | Movers
3. Helena-West Helena

/10
Population: 8,935
% African American: 71.85%
# Of African American Residents: 6,420
Percent Change Since 2010: -33.02%
More on Helena-West Helena: Data | Cost Of Living | Movers
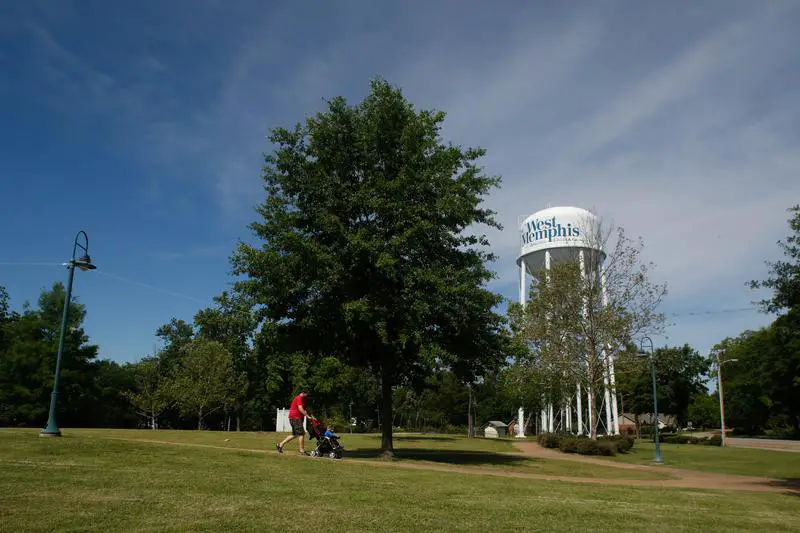
4. West Memphis
/10
Population: 23,929
% African American: 63.17%
# Of African American Residents: 15,117
Percent Change Since 2010: -6.62%
More on West Memphis: Data | Cost Of Living | Movers
5. Blytheville
/10
Population: 12,790
% African American: 58.38%
# Of African American Residents: 7,467
Percent Change Since 2010: -17.08%
More on Blytheville: Data | Cost Of Living | Movers
6. Osceola
/10
Population: 6,688
% African American: 55.82%
# Of African American Residents: 3,733
Percent Change Since 2010: -4.06%
More on Osceola: Data | Cost Of Living | Movers
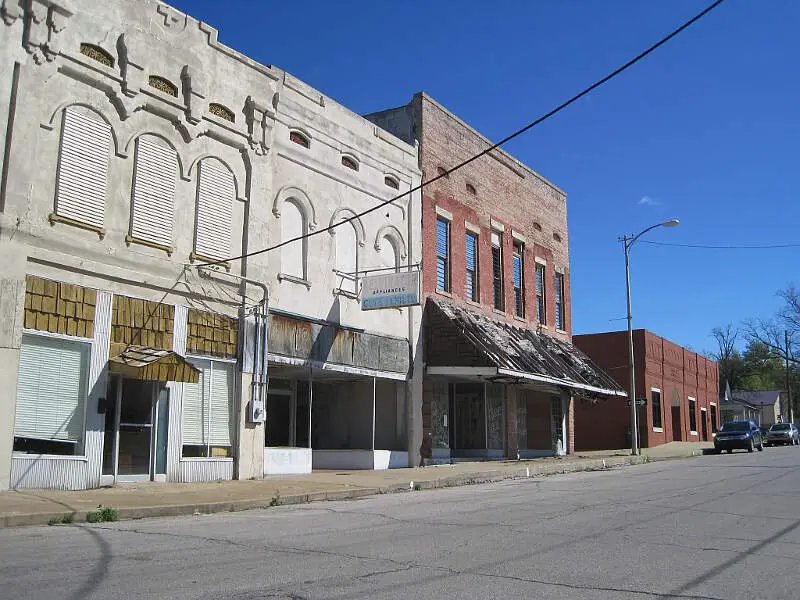
7. Camden
/10
Population: 10,307
% African American: 55.19%
# Of African American Residents: 5,688
Percent Change Since 2010: -13.07%
More on Camden: Data | Cost Of Living | Movers
8. El Dorado
/10
Population: 17,115
% African American: 48.73%
# Of African American Residents: 8,340
Percent Change Since 2010: -10.68%
More on El Dorado: Data | Cost Of Living | Movers
9. Jacksonville
/10
Population: 29,221
% African American: 48.35%
# Of African American Residents: 14,129
Percent Change Since 2010: 63.68%
More on Jacksonville: Data | Cost Of Living | Movers
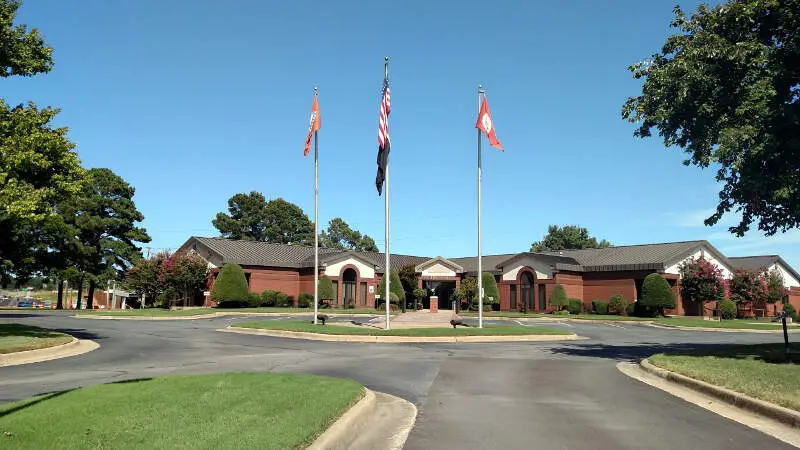
10. Hope
/10
Population: 8,671
% African American: 44.04%
# Of African American Residents: 3,819
Percent Change Since 2010: -16.58%
More on Hope: Data | Cost Of Living | Movers
Methodology: How We Determined The Cities In Arkansas With The Largest Black Population For 2026
We still believe in the accuracy of data — especially from the Census. So that’s where we went to get the race breakdown across Arkansas.
That leads us to the Census’s most recently available data, the 2020-2024 American Community Survey data from the US Census.
Specifically, we looked at table B03002: Hispanic OR LATINO ORIGIN BY RACE. Here are the category names as defined by the Census:
- Hispanic or Latino
- White alone*
- Black or African American alone*
- American Indian and Alaska Native alone*
- Asian alone*
- Native Hawaiian and Other Pacific Islander alone*
- Some other race alone*
- Two or more races*
Our particular column of interest was the number of people who identified as Black or African American.
We limited our analysis to non-CDPs with a population greater than 5,000 people in Arkansas. That left us with 59 cities.
We then calculated the percentage of residents that are Black or African American. The percentages ranked from 76.2% to 0.1%.
Finally, we ranked each city based on the percentage of the Black population, with a higher score being more Black than a lower score. Pine Bluff took the distinction of being the most Black, while Mena was the least African American city.
We updated this article for 2026. This is our eleventh time ranking the cities in Arkansas with the largest African American population.
Read on for more information on how the cities in Arkansas ranked by population of African American residents or, for a more general take on diversity in America, head over to our ranking of the most diverse cities in America.
Summary: Black Populations Across Arkansas
If you’re looking for a breakdown of African American populations across Arkansas according to the most recent data, this is an accurate list.
The blackest cities in Arkansas are Pine Bluff, Forrest City, Helena-West Helena, West Memphis, Blytheville, Osceola, Camden, El Dorado, Jacksonville, and Hope.
If you’re curious enough, here are the least African American places in Arkansas:
- Mena
- Harrison
- Cherokee Village
For more Arkansas reading, check out:
- Best Places To Live In Arkansas
- Worst Places To Live In Arkansas
- Cheapest Places To Live In Arkansas
African American Population By City In Arkansas
| Rank | City | Population | African American Population | % African American |
|---|---|---|---|---|
| 1 | Pine Bluff | 39,743 | 30,285 | 76.2% |
| 2 | Forrest City | 12,646 | 9,249 | 73.14% |
| 3 | Helena-West Helena | 8,935 | 6,420 | 71.85% |
| 4 | West Memphis | 23,929 | 15,117 | 63.17% |
| 5 | Blytheville | 12,790 | 7,467 | 58.38% |
| 6 | Osceola | 6,688 | 3,733 | 55.82% |
| 7 | Camden | 10,307 | 5,688 | 55.19% |
| 8 | El Dorado | 17,115 | 8,340 | 48.73% |
| 9 | Jacksonville | 29,221 | 14,129 | 48.35% |
| 10 | Hope | 8,671 | 3,819 | 44.04% |
| 11 | North Little Rock | 64,538 | 28,409 | 44.02% |
| 12 | Warren | 5,353 | 2,338 | 43.68% |
| 13 | Stuttgart | 7,903 | 3,337 | 42.22% |
| 14 | Magnolia | 10,894 | 4,588 | 42.11% |
| 15 | Monticello | 8,257 | 3,384 | 40.98% |
| 16 | Little Rock | 203,436 | 80,682 | 39.66% |
| 17 | Marion | 13,623 | 5,267 | 38.66% |
| 18 | Texarkana | 29,177 | 10,177 | 34.88% |
| 19 | White Hall | 5,512 | 1,686 | 30.59% |
| 20 | Arkadelphia | 10,099 | 3,057 | 30.27% |
| 21 | Malvern | 10,953 | 3,311 | 30.23% |
| 22 | Sherwood | 33,070 | 9,718 | 29.39% |
| 23 | Wynne | 8,120 | 2,103 | 25.9% |
| 24 | Newport | 8,024 | 1,994 | 24.85% |
| 25 | Jonesboro | 80,137 | 18,170 | 22.67% |
| 26 | Maumelle | 19,373 | 3,874 | 20.0% |
| 27 | Conway | 67,642 | 11,880 | 17.56% |
| 28 | Hot Springs | 37,920 | 5,905 | 15.57% |
| 29 | Bryant | 21,504 | 3,206 | 14.91% |
| 30 | Morrilton | 7,080 | 905 | 12.78% |
| 31 | Searcy | 23,340 | 2,515 | 10.78% |
| 32 | Benton | 36,595 | 3,638 | 9.94% |
| 33 | Trumann | 7,410 | 606 | 8.18% |
| 34 | Fort Smith | 89,805 | 6,285 | 7.0% |
| 35 | Centerton | 21,920 | 1,254 | 5.72% |
| 36 | De Queen | 6,058 | 328 | 5.41% |
| 37 | Fayetteville | 99,319 | 4,807 | 4.84% |
| 38 | Russellville | 29,162 | 1,172 | 4.02% |
| 39 | Paragould | 30,215 | 1,037 | 3.43% |
| 40 | Clarksville | 9,526 | 326 | 3.42% |
| 41 | Farmington | 9,094 | 311 | 3.42% |
| 42 | Alma | 5,906 | 200 | 3.39% |
| 43 | Bentonville | 58,249 | 1,952 | 3.35% |
| 44 | Cabot | 26,960 | 844 | 3.13% |
| 45 | Batesville | 11,445 | 334 | 2.92% |
| 46 | Springdale | 88,160 | 1,873 | 2.12% |
| 47 | Van Buren | 23,763 | 482 | 2.03% |
| 48 | Pocahontas | 7,538 | 133 | 1.76% |
| 49 | Siloam Springs | 18,699 | 298 | 1.59% |
| 50 | Lowell | 10,849 | 149 | 1.37% |
| 51 | Rogers | 72,981 | 729 | 1.0% |
| 52 | Beebe | 8,707 | 65 | 0.75% |
| 53 | Heber Springs | 7,161 | 53 | 0.74% |
| 54 | Mountain Home | 13,108 | 96 | 0.73% |
| 55 | Greenwood | 9,616 | 46 | 0.48% |
| 56 | Berryville | 5,707 | 26 | 0.46% |
| 57 | Cherokee Village | 5,046 | 13 | 0.26% |
| 58 | Harrison | 13,350 | 34 | 0.25% |
| 59 | Mena | 5,582 | 6 | 0.11% |