
Most African American cities in Georgia research summary. We used Saturday Night Science to analyze Georgia’s most recent Census data to determine the blackest cities in Georgia based on the percentage of Black residents. Here are the results of our analysis:
-
The city with the largest African American population in Georgia is Fairburn based on the most recent Census data.
-
Fairburn is 82.67% Black.
-
The least African American city in Georgia is Bremen.
-
Bremen is 1.43% Black.
-
Georgia is 30.7% Black.
-
Georgia is the 2nd blackest state in the United States.
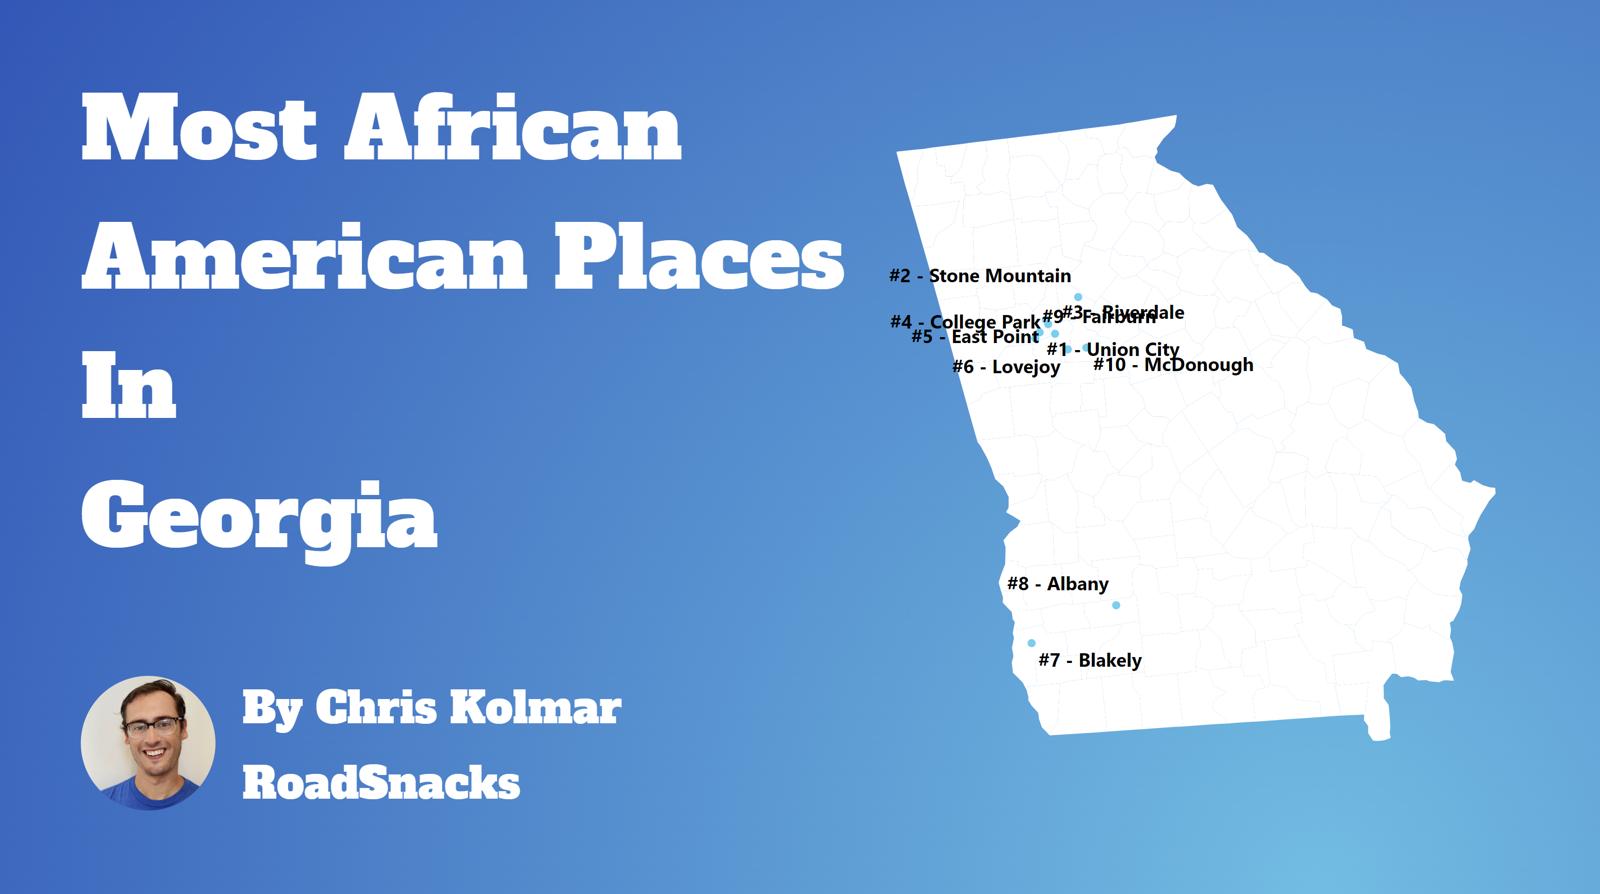
Table Of Contents: Top Ten | Methodology | Summary | Table
The Black community is one of the fastest-growing communities in America this decade.
Roughly 42 million people identifying as Black or African American live in the United States, making up 12% of the total population. According to the most recent American Community Survey, the Black population in Georgia is 3,362,270 – at 30.7% of the total population of Georgia.
The percentage growth of Blacks in America is the third largest percentage change for any race according to the Census’s race and ethnicity definition. Most scholars and historians agree that increasing diversity in America is a good thing.
We agree.
But how has the increase in the black population impacted Georgia? Which cities and towns in Georgia have seen the greatest increase in its Black population?
We broke down the most recent census data to determine the cities in Georgia with the largest African American population in 2026:
Most African American Places In Georgia
What’s the blackest city in Georgia? The city with the largest Black population in Georgia for 2026 is Fairburn. See if Fairburn ranked as one of the most african american places in America.
And if you already knew these places were Black, check out the best places to live in Georgia or the most diverse places in Georgia.
The 10 Blackest Cities In Georgia For 2026
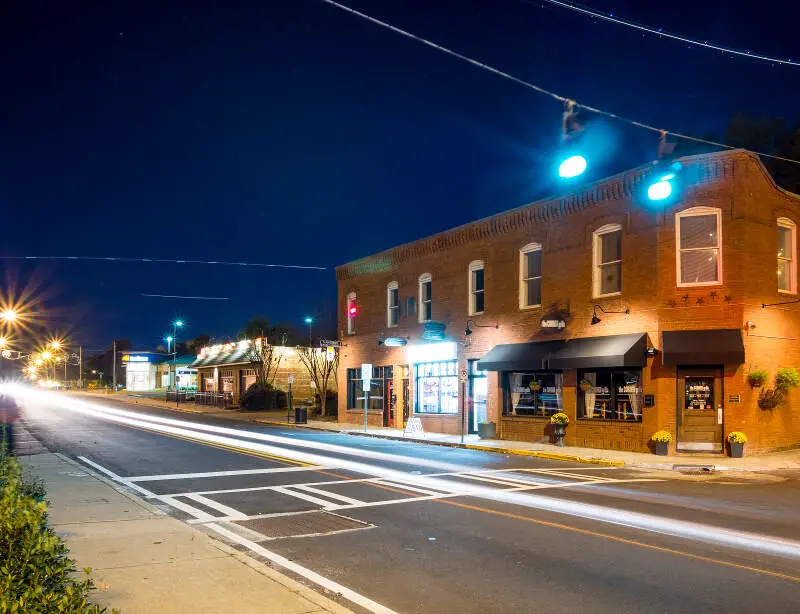
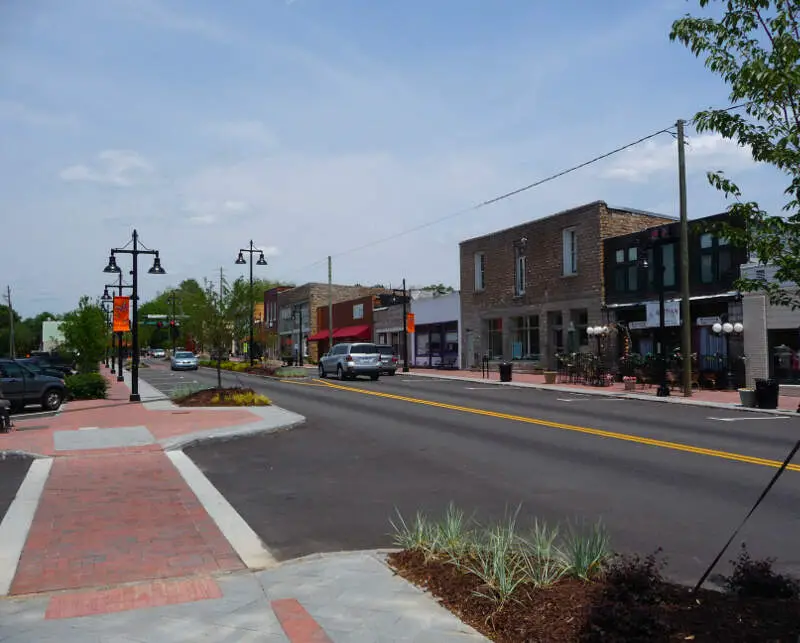
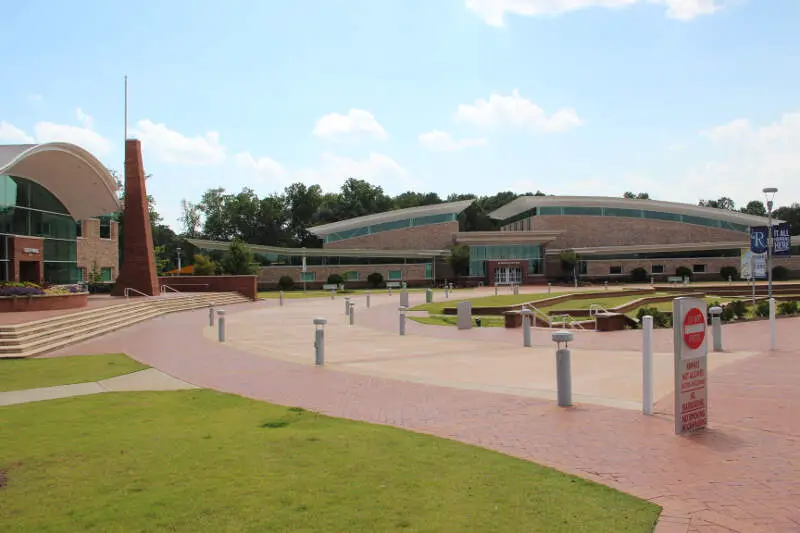
1. Fairburn
/10
Population: 16,831
% African American: 82.67%
# Of African American Residents: 13,915
Percent Change Since 2010: 66.09%
More on Fairburn: Data | Cost Of Living | Movers
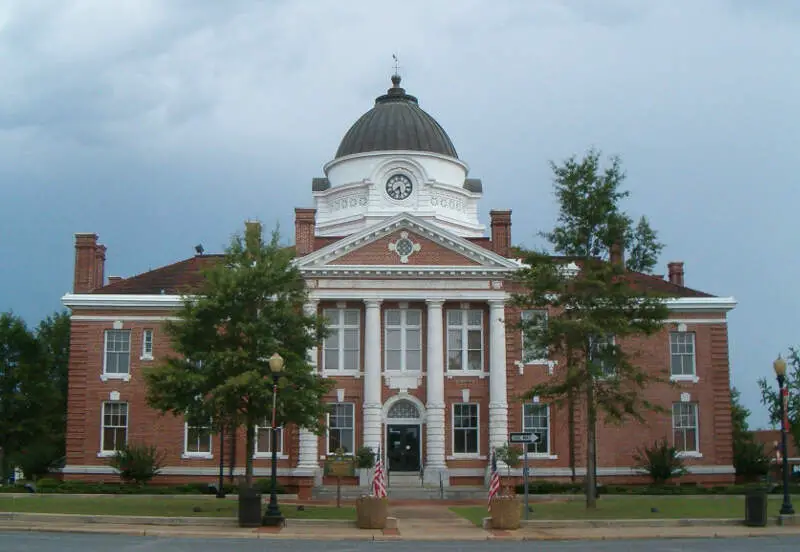
2. Union City
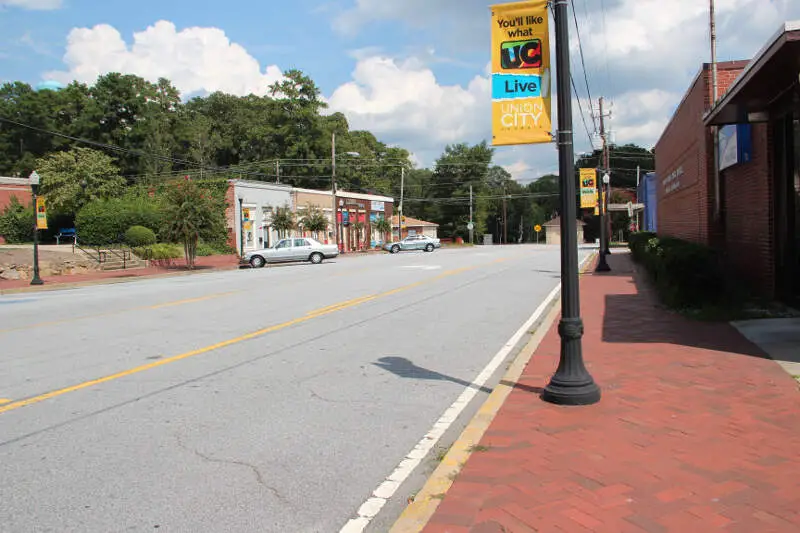
/10
Population: 27,728
% African American: 81.94%
# Of African American Residents: 22,721
Percent Change Since 2010: 56.85%
More on Union City: Data | Cost Of Living | Movers
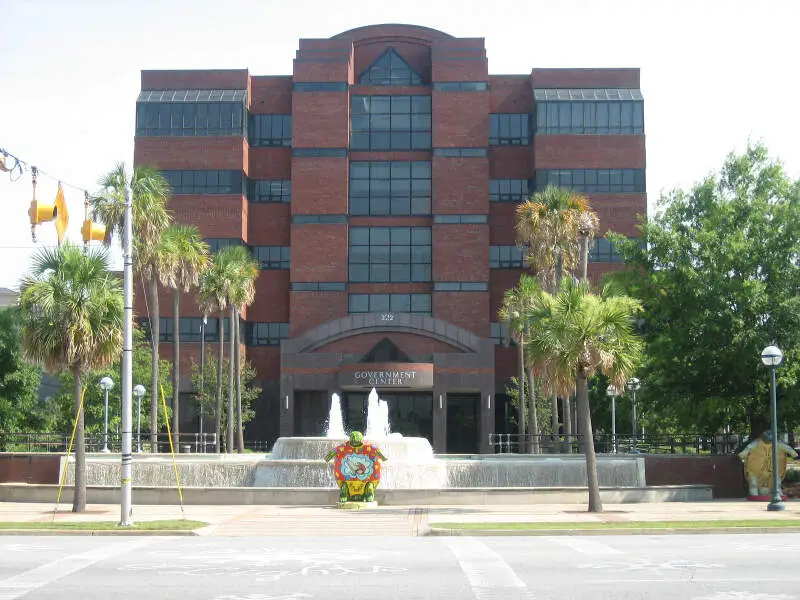
3. College Park
/10
Population: 14,712
% African American: 81.56%
# Of African American Residents: 11,999
Percent Change Since 2010: 7.26%
More on College Park: Data | Cost Of Living | Movers
4. Lovejoy

/10
Population: 11,508
% African American: 81.55%
# Of African American Residents: 9,385
Percent Change Since 2010: 129.8%
More on Lovejoy: Data | Cost Of Living | Movers
5. Stone Mountain
/10
Population: 6,623
% African American: 81.52%
# Of African American Residents: 5,399
Percent Change Since 2010: 23.24%
More on Stone Mountain: Data | Cost Of Living | Movers
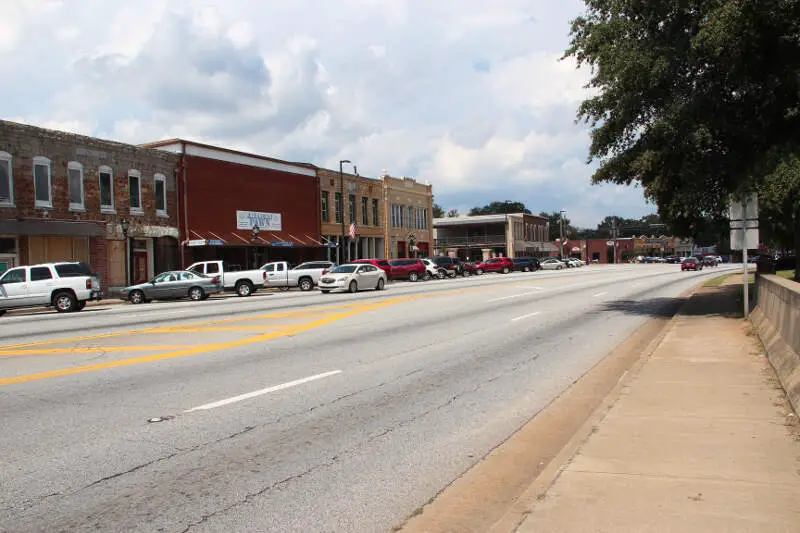
6. Blakely
/10
Population: 5,238
% African American: 77.78%
# Of African American Residents: 4,074
Percent Change Since 2010: 21.65%
More on Blakely: Data | Movers
7. Albany
/10
Population: 67,224
% African American: 76.36%
# Of African American Residents: 51,335
Percent Change Since 2010: -6.24%
More on Albany: Data | Cost Of Living | Movers
8. East Point
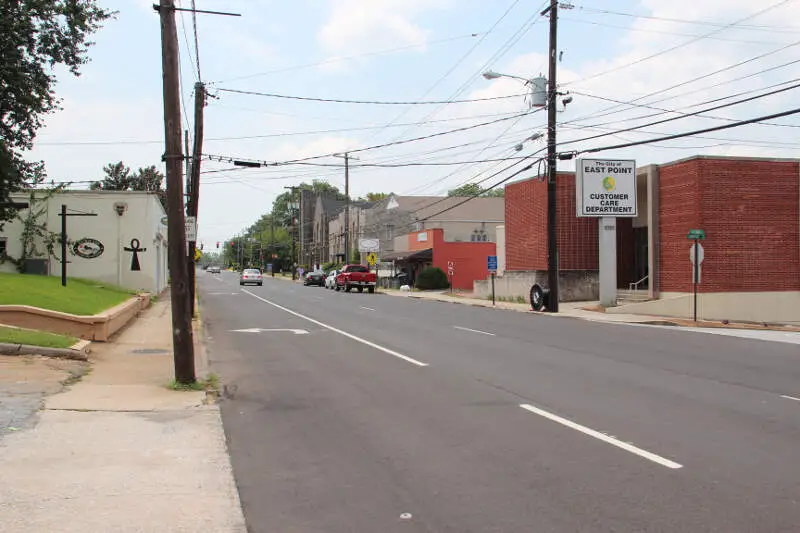
/10
Population: 38,335
% African American: 74.27%
# Of African American Residents: 28,470
Percent Change Since 2010: 15.07%
More on East Point: Data | Cost Of Living | Movers
9. Riverdale
/10
Population: 14,792
% African American: 73.64%
# Of African American Residents: 10,893
Percent Change Since 2010: -2.91%
More on Riverdale: Data | Cost Of Living | Movers
10. Mcdonough
/10
Population: 30,947
% African American: 71.87%
# Of African American Residents: 22,241
Percent Change Since 2010: 99.17%
More on Mcdonough: Data | Cost Of Living | Movers
Methodology: How We Determined The Cities In Georgia With The Largest Black Population For 2026
We still believe in the accuracy of data — especially from the Census. So that’s where we went to get the race breakdown across Georgia.
That leads us to the Census’s most recently available data, the 2020-2024 American Community Survey data from the US Census.
Specifically, we looked at table B03002: Hispanic OR LATINO ORIGIN BY RACE. Here are the category names as defined by the Census:
- Hispanic or Latino
- White alone*
- Black or African American alone*
- American Indian and Alaska Native alone*
- Asian alone*
- Native Hawaiian and Other Pacific Islander alone*
- Some other race alone*
- Two or more races*
Our particular column of interest was the number of people who identified as Black or African American.
We limited our analysis to non-CDPs with a population greater than 5,000 people in Georgia. That left us with 121 cities.
We then calculated the percentage of residents that are Black or African American. The percentages ranked from 82.7% to 1.4%.
Finally, we ranked each city based on the percentage of the Black population, with a higher score being more Black than a lower score. Fairburn took the distinction of being the most Black, while Bremen was the least African American city.
We updated this article for 2026. This is our eleventh time ranking the cities in Georgia with the largest African American population.
Read on for more information on how the cities in Georgia ranked by population of African American residents or, for a more general take on diversity in America, head over to our ranking of the most diverse cities in America.
Summary: Black Populations Across Georgia
If you’re looking for a breakdown of African American populations across Georgia according to the most recent data, this is an accurate list.
The blackest cities in Georgia are Fairburn, Union City, College Park, Lovejoy, Stone Mountain, Blakely, Albany, East Point, Riverdale, and McDonough.
If you’re curious enough, here are the least African American places in Georgia:
- Bremen
- Fort Oglethorpe
- LaFayette
For more Georgia reading, check out:
African American Population By City In Georgia
| Rank | City | Population | African American Population | % African American |
|---|---|---|---|---|
| 1 | Fairburn | 16,831 | 13,915 | 82.67% |
| 2 | Union City | 27,728 | 22,721 | 81.94% |
| 3 | College Park | 14,712 | 11,999 | 81.56% |
| 4 | Lovejoy | 11,508 | 9,385 | 81.55% |
| 5 | Stone Mountain | 6,623 | 5,399 | 81.52% |
| 6 | Blakely | 5,238 | 4,074 | 77.78% |
| 7 | Albany | 67,224 | 51,335 | 76.36% |
| 8 | East Point | 38,335 | 28,470 | 74.27% |
| 9 | Riverdale | 14,792 | 10,893 | 73.64% |
| 10 | Mcdonough | 30,947 | 22,241 | 71.87% |
| 11 | Camilla | 5,124 | 3,579 | 69.85% |
| 12 | Clarkston | 14,557 | 10,143 | 69.68% |
| 13 | Cordele | 9,994 | 6,754 | 67.58% |
| 14 | Austell | 8,447 | 5,646 | 66.84% |
| 15 | Stockbridge | 35,737 | 23,644 | 66.16% |
| 16 | Thomson | 6,821 | 4,505 | 66.05% |
| 17 | Douglasville | 37,536 | 24,678 | 65.74% |
| 18 | Waynesboro | 5,644 | 3,694 | 65.45% |
| 19 | Conyers | 18,512 | 11,994 | 64.79% |
| 20 | Dublin | 16,136 | 10,366 | 64.24% |
| 21 | Sandersville | 5,601 | 3,576 | 63.85% |
| 22 | Fort Valley | 8,858 | 5,446 | 61.48% |
| 23 | Americus | 15,813 | 9,566 | 60.49% |
| 24 | Bainbridge | 14,404 | 8,453 | 58.69% |
| 25 | Brunswick | 15,307 | 8,834 | 57.71% |
| 26 | Sylvester | 5,489 | 3,099 | 56.46% |
| 27 | Augusta-Richmond County Consolidated Government (Balance) | 201,528 | 113,318 | 56.23% |
| 28 | Douglas | 11,749 | 6,582 | 56.02% |
| 29 | Jonesboro | 6,143 | 3,439 | 55.98% |
| 30 | Valdosta | 55,252 | 30,613 | 55.41% |
| 31 | Waycross | 13,756 | 7,571 | 55.04% |
| 32 | Swainsboro | 7,571 | 4,097 | 54.11% |
| 33 | Thomasville | 18,666 | 9,979 | 53.46% |
| 34 | Hampton | 8,687 | 4,563 | 52.53% |
| 35 | Powder Springs | 18,009 | 9,217 | 51.18% |
| 36 | Fitzgerald | 8,918 | 4,549 | 51.01% |
| 37 | Griffin | 23,761 | 12,099 | 50.92% |
| 38 | Savannah | 147,898 | 75,238 | 50.87% |
| 39 | Lagrange | 32,078 | 16,313 | 50.85% |
| 40 | Locust Grove | 10,532 | 5,306 | 50.38% |
| 41 | Forest Park | 19,504 | 9,655 | 49.5% |
| 42 | Covington | 14,584 | 7,159 | 49.09% |
| 43 | Hinesville | 35,679 | 17,167 | 48.12% |
| 44 | Barnesville | 6,121 | 2,922 | 47.74% |
| 45 | Loganville | 15,527 | 7,329 | 47.2% |
| 46 | Villa Rica | 18,551 | 8,598 | 46.35% |
| 47 | Columbus | 203,711 | 93,972 | 46.13% |
| 48 | Adel | 5,641 | 2,600 | 46.09% |
| 49 | Moultrie | 14,588 | 6,697 | 45.91% |
| 50 | Atlanta | 505,268 | 229,631 | 45.45% |
| 51 | Eatonton | 6,515 | 2,915 | 44.74% |
| 52 | Centerville | 8,505 | 3,638 | 42.77% |
| 53 | Statesboro | 34,149 | 14,369 | 42.08% |
| 54 | Milledgeville | 16,748 | 6,948 | 41.49% |
| 55 | Monroe | 15,648 | 6,364 | 40.67% |
| 56 | Vidalia | 10,752 | 4,358 | 40.53% |
| 57 | Cairo | 10,055 | 4,060 | 40.38% |
| 58 | Warner Robins | 82,990 | 33,480 | 40.34% |
| 59 | Dallas | 14,714 | 5,875 | 39.93% |
| 60 | Snellville | 21,620 | 8,631 | 39.92% |
| 61 | Grovetown | 17,014 | 6,686 | 39.3% |
| 62 | Garden City | 10,426 | 4,093 | 39.26% |
| 63 | Fayetteville | 19,719 | 7,708 | 39.09% |
| 64 | Tyrone | 7,896 | 2,985 | 37.8% |
| 65 | Thomaston | 9,831 | 3,552 | 36.13% |
| 66 | Hapeville | 6,630 | 2,383 | 35.94% |
| 67 | Eastman | 5,584 | 1,955 | 35.01% |
| 68 | Tifton | 17,210 | 5,868 | 34.1% |
| 69 | Carrollton | 27,392 | 9,336 | 34.08% |
| 70 | Jesup | 9,942 | 3,328 | 33.47% |
| 71 | Newnan | 44,235 | 14,768 | 33.39% |
| 72 | Perry | 23,001 | 7,475 | 32.5% |
| 73 | Smyrna | 56,633 | 17,881 | 31.57% |
| 74 | Morrow | 6,364 | 2,000 | 31.43% |
| 75 | Pooler | 28,466 | 8,890 | 31.23% |
| 76 | Marietta | 62,263 | 19,198 | 30.83% |
| 77 | Lawrenceville | 30,954 | 8,548 | 27.62% |
| 78 | Athens-Clarke County Unified Government (Balance) | 127,345 | 32,707 | 25.68% |
| 79 | Duluth | 32,426 | 7,685 | 23.7% |
| 80 | Kennesaw | 34,605 | 7,722 | 22.31% |
| 81 | Rome | 38,189 | 8,452 | 22.13% |
| 82 | Acworth | 22,473 | 4,805 | 21.38% |
| 83 | Sandy Springs | 107,087 | 22,371 | 20.89% |
| 84 | Cedartown | 10,227 | 2,125 | 20.78% |
| 85 | Kingsland | 19,627 | 3,897 | 19.86% |
| 86 | Cusseta-Chattahoochee County Unified Government | 8,887 | 1,714 | 19.29% |
| 87 | Commerce | 8,013 | 1,533 | 19.13% |
| 88 | Winder | 19,437 | 3,707 | 19.07% |
| 89 | Chamblee | 30,895 | 5,662 | 18.33% |
| 90 | Sugar Hill | 26,128 | 4,123 | 15.78% |
| 91 | Toccoa | 9,238 | 1,429 | 15.47% |
| 92 | Dunwoody | 51,758 | 7,952 | 15.36% |
| 93 | Norcross | 18,007 | 2,746 | 15.25% |
| 94 | Cartersville | 24,074 | 3,497 | 14.53% |
| 95 | St. Marys | 19,166 | 2,774 | 14.47% |
| 96 | Gainesville | 45,032 | 6,461 | 14.35% |
| 97 | Lilburn | 15,390 | 2,181 | 14.17% |
| 98 | Richmond Hill | 18,181 | 2,520 | 13.86% |
| 99 | Suwanee | 22,349 | 3,043 | 13.62% |
| 100 | Canton | 35,741 | 4,657 | 13.03% |
Greetings! I don’t see the city of Macon-Bibb County on list.