
Most African American cities in Oregon research summary. We used Saturday Night Science to analyze Oregon’s most recent Census data to determine the blackest cities in Oregon based on the percentage of Black residents. Here are the results of our analysis:
-
The city with the largest African American population in Oregon is Fairview based on the most recent Census data.
-
Fairview is 11.39% Black.
-
The least African American city in Oregon is Milton-Freewater.
-
Milton-Freewater is 0.0% Black.
-
Oregon is 1.8% Black.
-
Oregon is the 41st blackest state in the United States.
Table Of Contents: Top Ten | Methodology | Summary | Table
The Black community is one of the fastest-growing communities in America this decade.
Roughly 42 million people identifying as Black or African American live in the United States, making up 12% of the total population. According to the most recent American Community Survey, the Black population in Oregon is 77,886 – at 1.8% of the total population of Oregon.
The percentage growth of Blacks in America is the third largest percentage change for any race according to the Census’s race and ethnicity definition. Most scholars and historians agree that increasing diversity in America is a good thing.
We agree.
But how has the increase in the black population impacted Oregon? Which cities and towns in Oregon have seen the greatest increase in its Black population?
We broke down the most recent census data to determine the cities in Oregon with the largest African American population in 2026:
Most African American Places In Oregon
What’s the blackest city in Oregon? The city with the largest Black population in Oregon for 2026 is Fairview. See if Fairview ranked as one of the most african american places in America.
And if you already knew these places were Black, check out the best places to live in Oregon or the most diverse places in Oregon.
The 10 Blackest Cities In Oregon For 2026
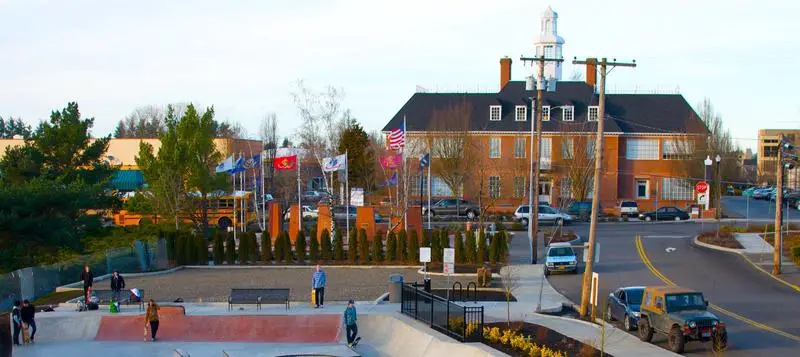
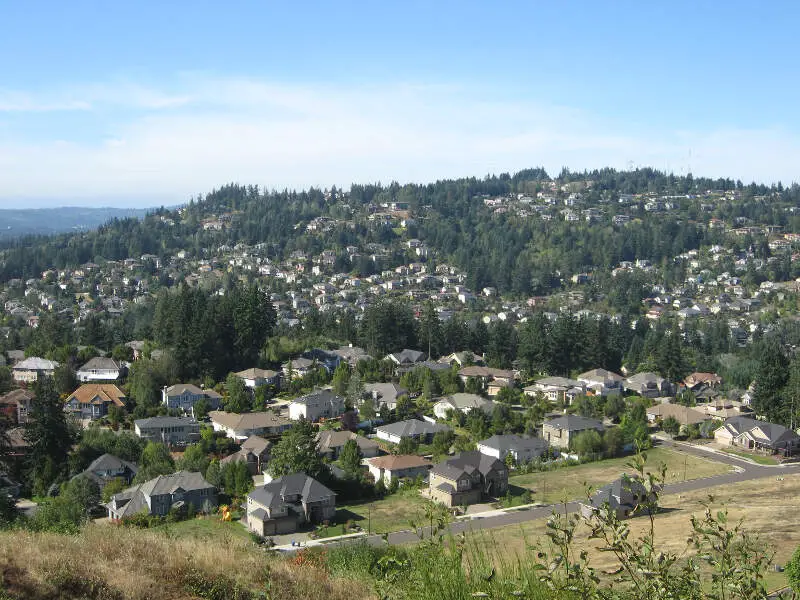
1. Fairview
/10
Population: 10,735
% African American: 11.39%
# Of African American Residents: 1,223
Percent Change Since 2010: 78.54%
More on Fairview: Data | Cost Of Living | Movers
2. Portland
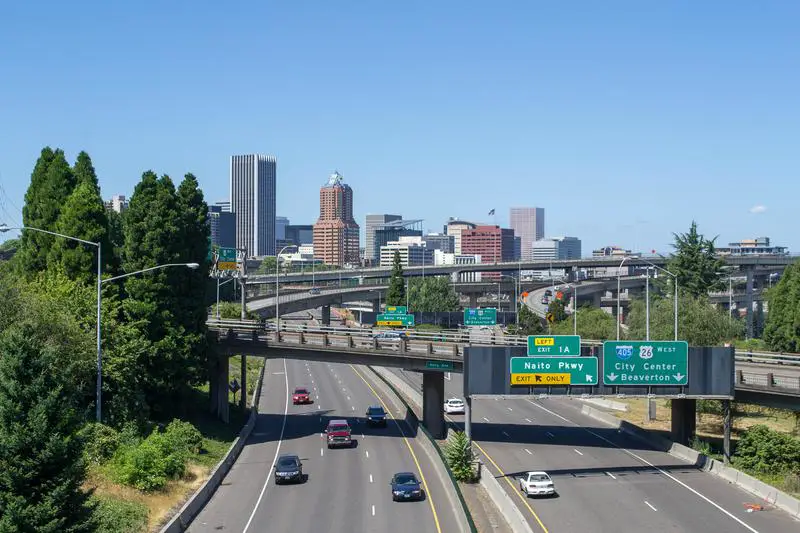
/10
Population: 641,165
% African American: 5.51%
# Of African American Residents: 35,307
Percent Change Since 2010: 0.25%
More on Portland: Data | Cost Of Living | Movers
3. Sheridan
/10
Population: 6,339
% African American: 4.75%
# Of African American Residents: 301
Percent Change Since 2010: 18.04%
More on Sheridan: Data | Cost Of Living | Movers
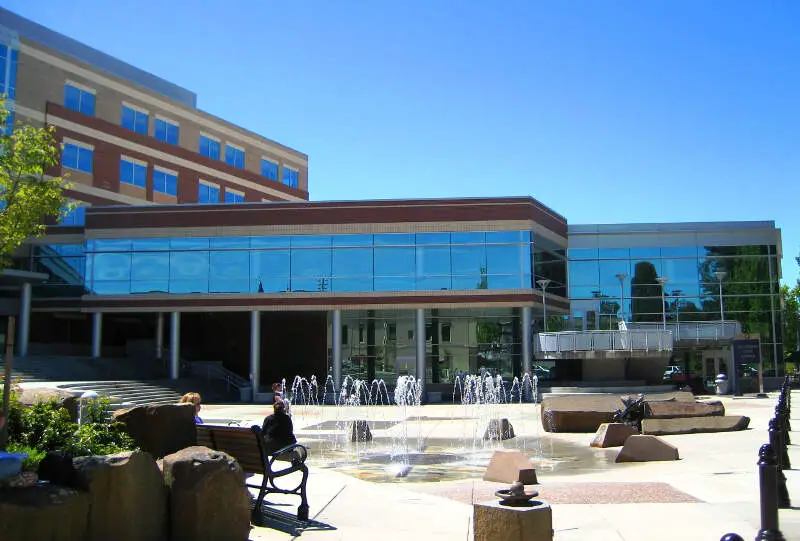
4. Gresham
/10
Population: 112,378
% African American: 4.54%
# Of African American Residents: 5,105
Percent Change Since 2010: 64.41%
More on Gresham: Data | Cost Of Living | Movers
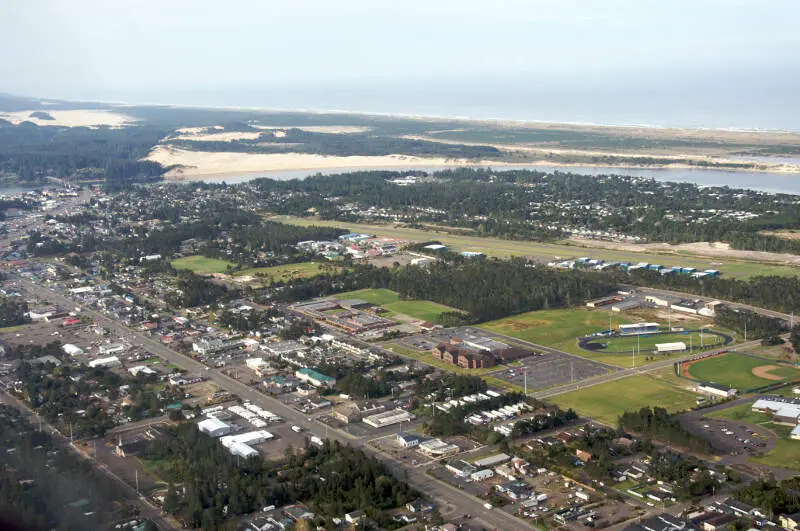
5. Florence
/10
Population: 9,482
% African American: 2.9%
# Of African American Residents: 275
Percent Change Since 2010: 1427.78%
More on Florence: Data | Cost Of Living | Movers
6. Hillsboro
/10
Population: 108,231
% African American: 2.89%
# Of African American Residents: 3,126
Percent Change Since 2010: 117.08%
More on Hillsboro: Data | Cost Of Living | Movers
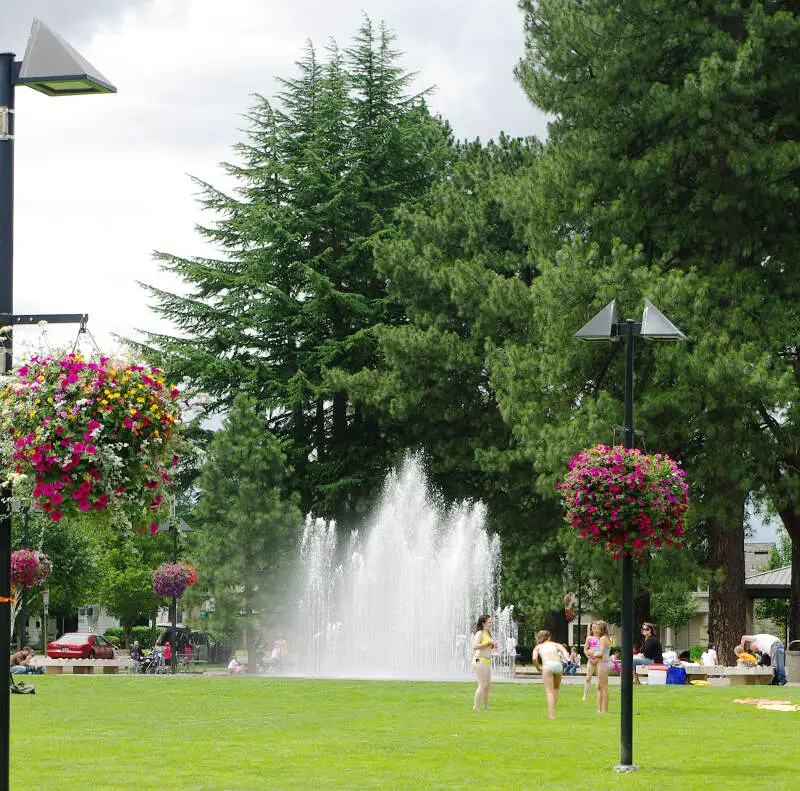
7. Beaverton
/10
Population: 97,812
% African American: 2.51%
# Of African American Residents: 2,454
Percent Change Since 2010: 112.1%
More on Beaverton: Data | Cost Of Living | Movers
8. Happy Valley
/10
Population: 26,738
% African American: 2.34%
# Of African American Residents: 626
Percent Change Since 2010: 135.34%
More on Happy Valley: Data | Cost Of Living | Movers
9. Troutdale
/10
Population: 15,923
% African American: 2.2%
# Of African American Residents: 350
Percent Change Since 2010: -14.22%
More on Troutdale: Data | Cost Of Living | Movers
10. Forest Grove
/10
Population: 26,529
% African American: 2.19%
# Of African American Residents: 582
Percent Change Since 2010: 4376.92%
More on Forest Grove: Data | Cost Of Living | Movers
Methodology: How We Determined The Cities In Oregon With The Largest Black Population For 2026
We still believe in the accuracy of data — especially from the Census. So that’s where we went to get the race breakdown across Oregon.
That leads us to the Census’s most recently available data, the 2020-2024 American Community Survey data from the US Census.
Specifically, we looked at table B03002: Hispanic OR LATINO ORIGIN BY RACE. Here are the category names as defined by the Census:
- Hispanic or Latino
- White alone*
- Black or African American alone*
- American Indian and Alaska Native alone*
- Asian alone*
- Native Hawaiian and Other Pacific Islander alone*
- Some other race alone*
- Two or more races*
Our particular column of interest was the number of people who identified as Black or African American.
We limited our analysis to non-CDPs with a population greater than 5,000 people in Oregon. That left us with 73 cities.
We then calculated the percentage of residents that are Black or African American. The percentages ranked from 11.4% to 0.0%.
Finally, we ranked each city based on the percentage of the Black population, with a higher score being more Black than a lower score. Fairview took the distinction of being the most Black, while Milton-Freewater was the least African American city.
We updated this article for 2026. This is our eleventh time ranking the cities in Oregon with the largest African American population.
Read on for more information on how the cities in Oregon ranked by population of African American residents or, for a more general take on diversity in America, head over to our ranking of the most diverse cities in America.
Summary: Black Populations Across Oregon
If you’re looking for a breakdown of African American populations across Oregon according to the most recent data, this is an accurate list.
The blackest cities in Oregon are Fairview, Portland, Sheridan, Gresham, Florence, Hillsboro, Beaverton, Happy Valley, Troutdale, and Forest Grove.
If you’re curious enough, here are the least African American places in Oregon:
- Milton-Freewater
- Winston
- Madras
For more Oregon reading, check out:
African American Population By City In Oregon
| Rank | City | Population | African American Population | % African American |
|---|---|---|---|---|
| 1 | Fairview | 10,735 | 1,223 | 11.39% |
| 2 | Portland | 641,165 | 35,307 | 5.51% |
| 3 | Sheridan | 6,339 | 301 | 4.75% |
| 4 | Gresham | 112,378 | 5,105 | 4.54% |
| 5 | Florence | 9,482 | 275 | 2.9% |
| 6 | Hillsboro | 108,231 | 3,126 | 2.89% |
| 7 | Beaverton | 97,812 | 2,454 | 2.51% |
| 8 | Happy Valley | 26,738 | 626 | 2.34% |
| 9 | Troutdale | 15,923 | 350 | 2.2% |
| 10 | Forest Grove | 26,529 | 582 | 2.19% |
| 11 | Milwaukie | 21,392 | 411 | 1.92% |
| 12 | Baker City | 10,210 | 180 | 1.76% |
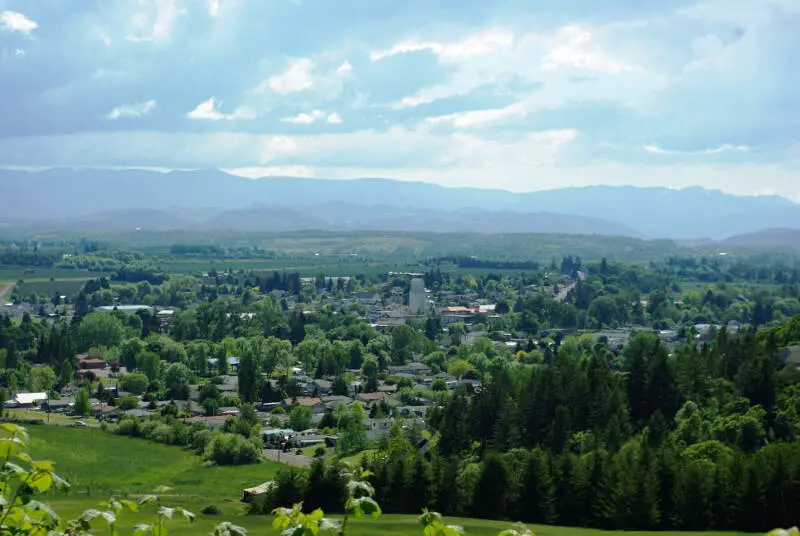
| 13 | Silverton | 10,456 | 174 | 1.66% |
| 14 | Eugene | 179,591 | 2,869 | 1.6% |
| 15 | Corvallis | 59,960 | 933 | 1.56% |
| 16 | Salem | 178,865 | 2,781 | 1.55% |
| 17 | Umatilla | 7,508 | 113 | 1.51% |
| 18 | West Linn | 26,935 | 399 | 1.48% |
| 19 | Dallas | 17,531 | 254 | 1.45% |
| 20 | Tigard | 56,011 | 797 | 1.42% |
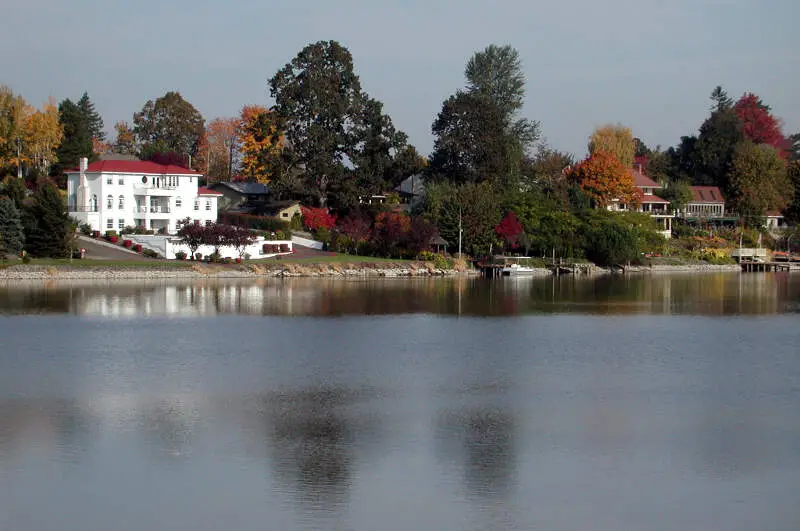
| 21 | Gladstone | 11,977 | 158 | 1.32% |
| 22 | Wilsonville | 26,974 | 355 | 1.32% |
| 23 | Cornelius | 14,255 | 185 | 1.3% |
| 24 | Prineville | 11,470 | 138 | 1.2% |
| 25 | Monmouth | 11,428 | 133 | 1.16% |
| 26 | Seaside | 7,192 | 77 | 1.07% |
| 27 | La Grande | 13,058 | 138 | 1.06% |
| 28 | Oregon City | 37,755 | 388 | 1.03% |
| 29 | Medford | 86,315 | 884 | 1.02% |
| 30 | Hermiston | 19,546 | 200 | 1.02% |
| 31 | Pendleton | 16,950 | 169 | 1.0% |
| 32 | Tualatin | 27,763 | 273 | 0.98% |
| 33 | Newport | 10,583 | 104 | 0.98% |
| 34 | Springfield | 61,499 | 572 | 0.93% |
| 35 | Keizer | 39,082 | 339 | 0.87% |
| 36 | North Bend | 10,171 | 84 | 0.83% |
| 37 | Sutherlin | 8,599 | 69 | 0.8% |
| 38 | Albany | 56,839 | 440 | 0.77% |
| 39 | Central Point | 19,216 | 147 | 0.76% |
| 40 | Newberg | 26,066 | 199 | 0.76% |
| 41 | Ontario | 11,842 | 86 | 0.73% |
| 42 | Hood River | 8,361 | 59 | 0.71% |
| 43 | Klamath Falls | 22,115 | 151 | 0.68% |
| 44 | Lake Oswego | 40,381 | 269 | 0.67% |
| 45 | Talent | 6,254 | 40 | 0.64% |
| 46 | Astoria | 10,109 | 63 | 0.62% |
| 47 | Independence | 10,199 | 57 | 0.56% |
| 48 | The Dalles | 15,917 | 87 | 0.55% |
| 49 | Coos Bay | 15,925 | 83 | 0.52% |
| 50 | Mcminnville | 34,596 | 160 | 0.46% |
| 51 | Cottage Grove | 10,698 | 49 | 0.46% |
| 52 | Scappoose | 8,179 | 34 | 0.42% |
| 53 | Grants Pass | 39,311 | 161 | 0.41% |
| 54 | Sweet Home | 10,078 | 36 | 0.36% |
| 55 | Bend | 103,390 | 360 | 0.35% |
| 56 | Canby | 18,134 | 63 | 0.35% |
| 57 | Eagle Point | 9,839 | 31 | 0.32% |
| 58 | Junction City | 6,947 | 20 | 0.29% |
| 59 | Sherwood | 20,307 | 54 | 0.27% |
| 60 | Redmond | 36,092 | 89 | 0.25% |
| 61 | Woodburn | 27,875 | 60 | 0.22% |
| 62 | Roseburg | 23,778 | 49 | 0.21% |
| 63 | Stayton | 8,292 | 17 | 0.21% |
| 64 | Lincoln City | 9,968 | 13 | 0.13% |
| 65 | St. Helens | 14,258 | 14 | 0.1% |
| 66 | Lebanon | 19,344 | 17 | 0.09% |
| 67 | Ashland | 21,259 | 16 | 0.08% |
| 68 | Sandy | 12,854 | 4 | 0.03% |
| 69 | Brookings | 6,703 | 1 | 0.01% |
| 70 | Molalla | 10,186 | 0 | 0.0% |
| 71 | Madras | 7,676 | 0 | 0.0% |
| 72 | Winston | 5,690 | 0 | 0.0% |
| 73 | Milton-Freewater | 7,036 | 0 | 0.0% |
seriously? you name the place with the federal prison as the place with the most blacks in the state.